The Chartsy Blog
Explore SaaS and BigCommerce analytics tips, integration guides, and no-code visualization insights. Unlock growth with our strategies!
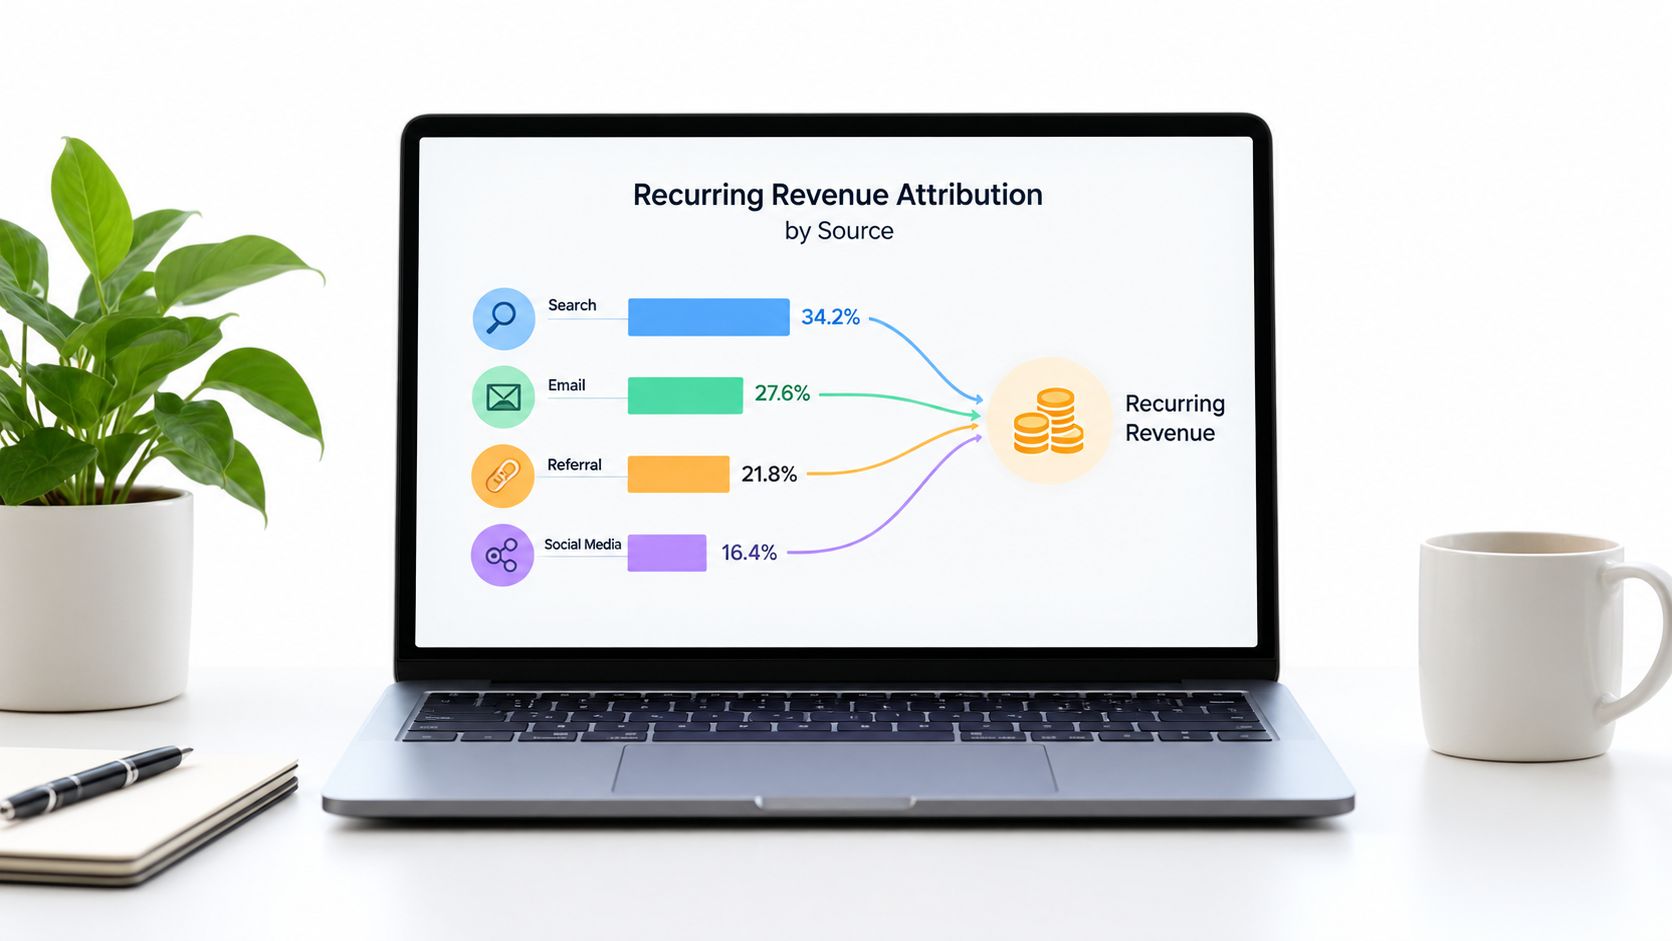
All Articles

How to Track Paying Customers by Marketing Channel
Learn how to track paying customers by marketing channel with practical tagging, attribution, and dashboard steps built for SaaS founders and small teams.

How to Track Signups by Traffic Source Without Hacking
Learn how to track signups by traffic source accurately using UTMs, server-side methods, and Chartsy attribution. No JS hack required.

UTM Tracking for SaaS: A Practical Implementation Guide
A practical guide to UTM tracking for SaaS — naming conventions, signup persistence, billing attribution, and QA workflows that connect sources to revenue.

First Touch vs Last Touch Attribution for SaaS
Compare first touch vs last touch attribution for SaaS. Learn pros, cons, biases, and when each model works, plus MRR impact and practical queries.

B2B SaaS Attribution: The Guide for Growth Teams
Understand B2B SaaS attribution from signup to revenue. Learn attribution models, common challenges, key metrics, and how to track MRR with tools like Chartsy.
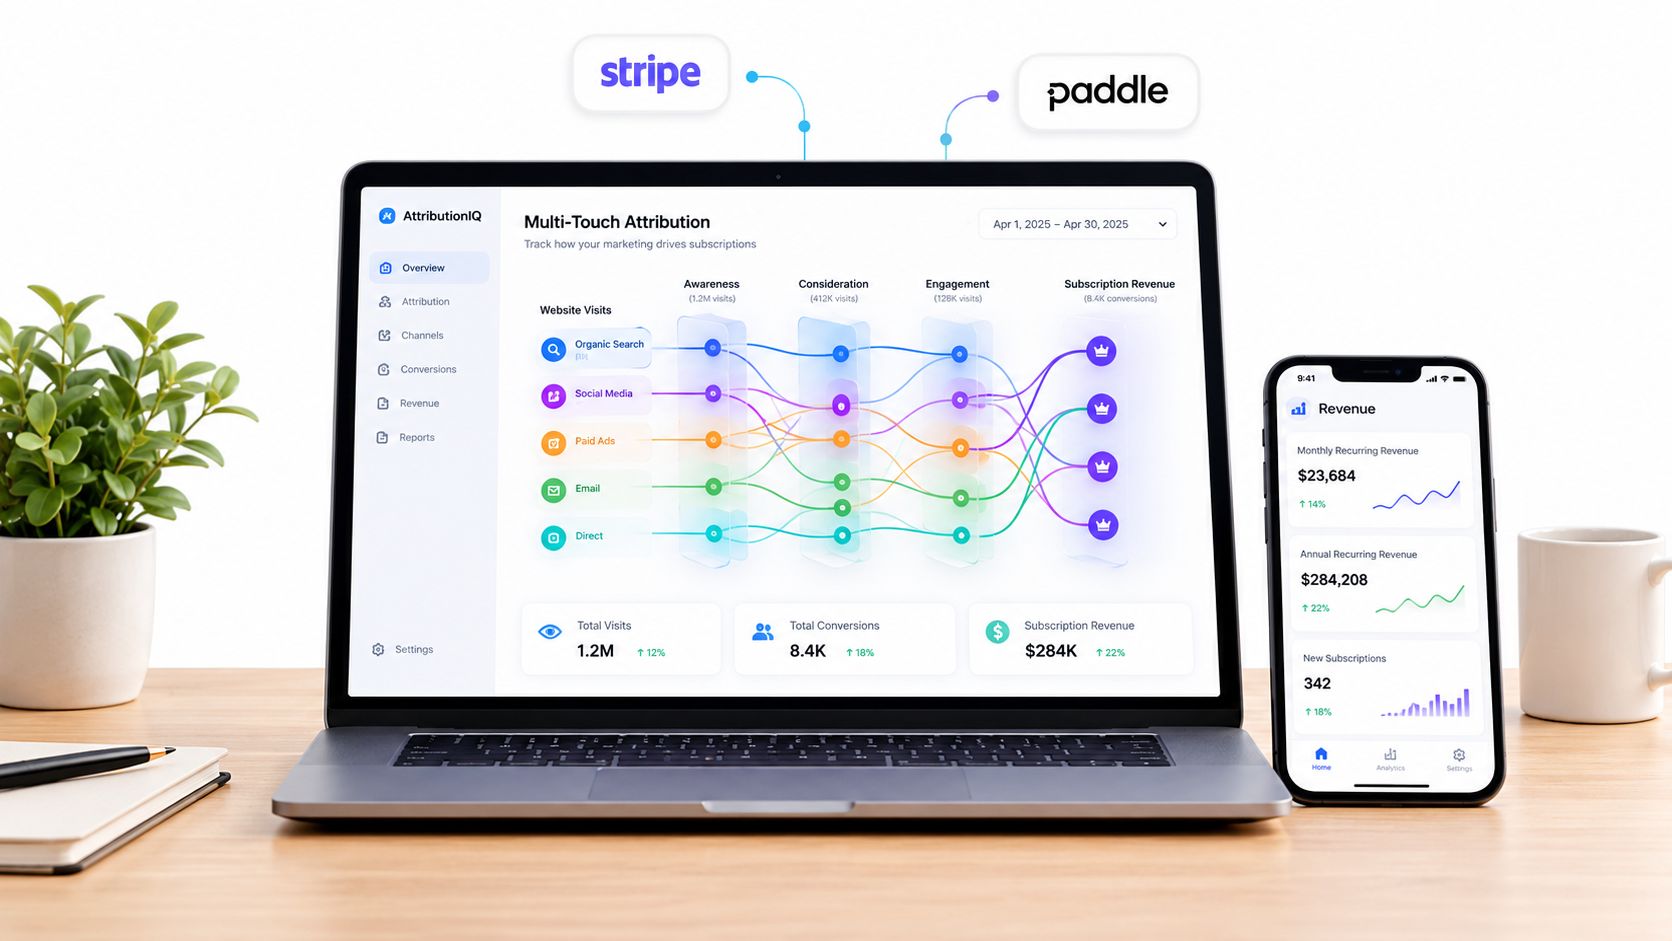
10 Marketing Attribution Tools for SaaS
Compare 10 marketing attribution tools for saas by revenue links, attribution models, setup effort, pricing, and fit for small SaaS teams.

Marketing Attribution Software for SaaS: A Practical Guide
Learn how marketing attribution software works for SaaS, from attribution models to implementation, and find the right tool for your small team.

Marketing Revenue Attribution for SaaS Growth Explained
Learn marketing revenue attribution for SaaS — models, data setup, MRR mapping, and how to link marketing to paying customers and recurring revenue.

SaaS Revenue Attribution Explained for Growth Teams
Learn saas revenue attribution models, metrics and setup to link traffic to MRR and churn. Practical guide with examples and Chartsy workflow.
Google Analytics MCP vs Revenue Analytics MCP Explained
A Google Analytics MCP answers traffic questions. A revenue analytics MCP answers what those visitors are worth. Here is what each can and cannot tell you.
Marketing Attribution MCP: Which Channel Actually Pays You
A marketing attribution MCP connects traffic sources to real subscription revenue in your AI client. See what it exposes and what it can finally answer.
MCP Server Security: What We Exposed and What We Didn't
We built an analytics MCP server and deliberately left things out. The MCP server security decisions behind read-only tools, IDs, and no raw customer records.
SaaS Analytics MCP: Ask Claude About Your MRR and Churn
A SaaS analytics MCP lets Claude read your MRR, churn, and at-risk customers directly from your Stripe or Paddle data. Setup, tools, and questions worth asking.
Stripe Analytics MCP: Why Raw Stripe Data Isn't Enough
A Stripe analytics MCP gives AI assistants calculated revenue metrics, not raw charges. Here is exactly why that decides whether the answers are trustworthy.
What Is an Analytics MCP? Connecting Business Data to AI
An analytics MCP lets an AI assistant read your business metrics directly. How it works, what it should expose, and what to check before connecting one.

SaaS Financial Metrics: A Practical How-To Guide
Learn how to calculate SaaS financial metrics such as MRR, churn, LTV, NRR, CAC, and payback, then use them to guide better decisions.
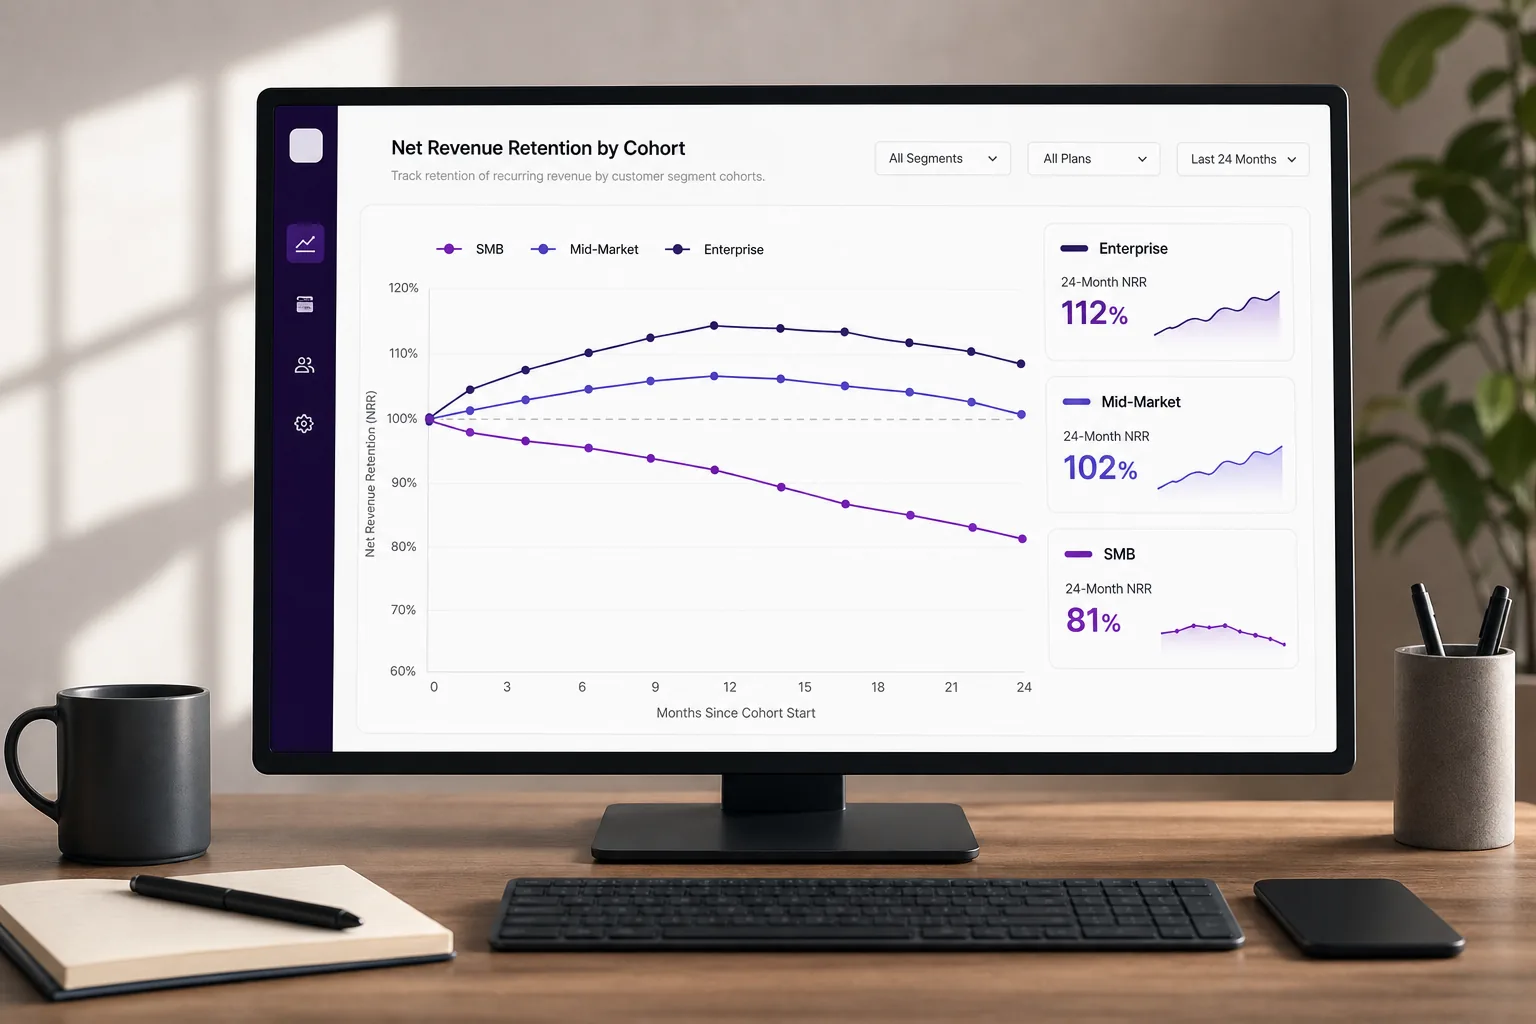
What Is a Good NRR for SaaS?
What is a good nrr for SaaS? Learn useful benchmarks, the NRR formula, how to read your result, and what to do next.

Best Subscription Analytics Tools for SaaS
Compare the best subscription analytics tools for SaaS. Review metrics, integrations, attribution, tradeoffs, and the right fit for your team.
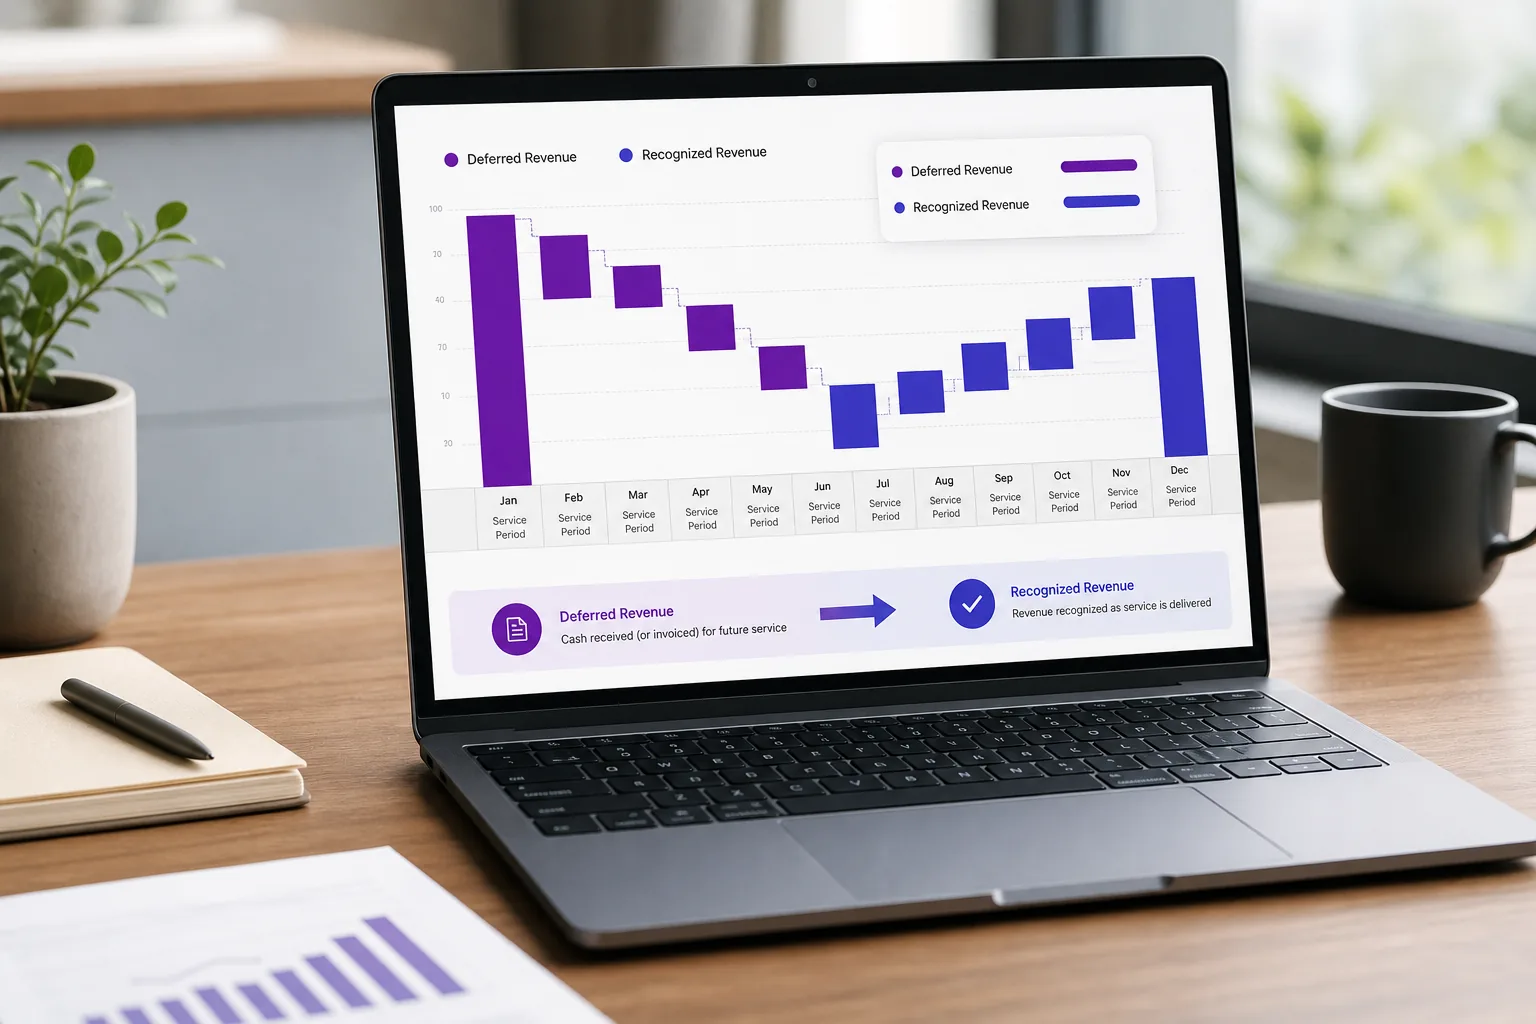
Subscription Revenue Recognition Explained
Learn subscription revenue recognition, deferred revenue, contract changes, refunds, and controls for SaaS accounting teams. Get the basics right.

Expansion Revenue: Definition, Formula, and Examples
Learn what expansion revenue means, how to calculate it, and how upgrades, add-ons, and seat growth affect SaaS MRR, NRR, and retention.

Subscription Business Metrics: The Complete Glossary
A plain-English glossary of the subscription business metrics SaaS teams track most, with one-line formulas and links to the full calculation guide for each.

SaaS Retention Benchmarks: How to Use Them
SaaS retention benchmarks by metric and segment, plus formulas and practical steps to compare your numbers and decide what to improve next.
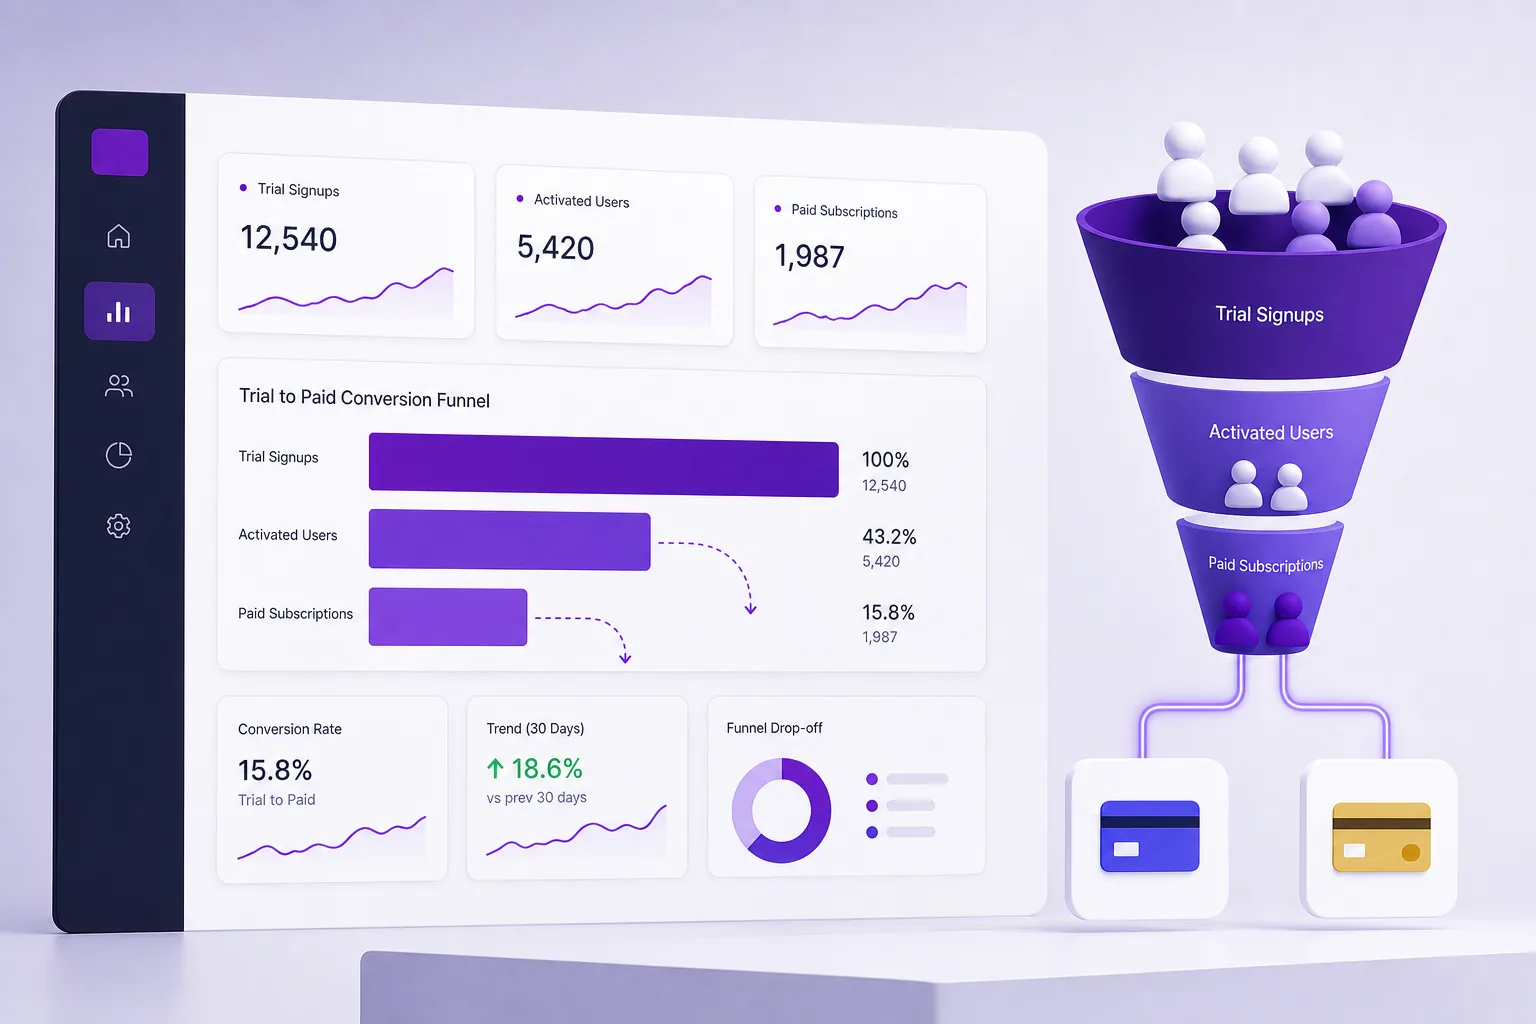
Trial to Paid Conversion Rate: SaaS Guide
Learn how to calculate trial to paid conversion rate, read SaaS benchmarks, find funnel leaks, and improve conversions with better data.

Best Revenue Churn Calculation Tools
Compare the best revenue churn calculation tools for SaaS. Track gross churn, net churn, MRR movements, NRR, and retention trends.
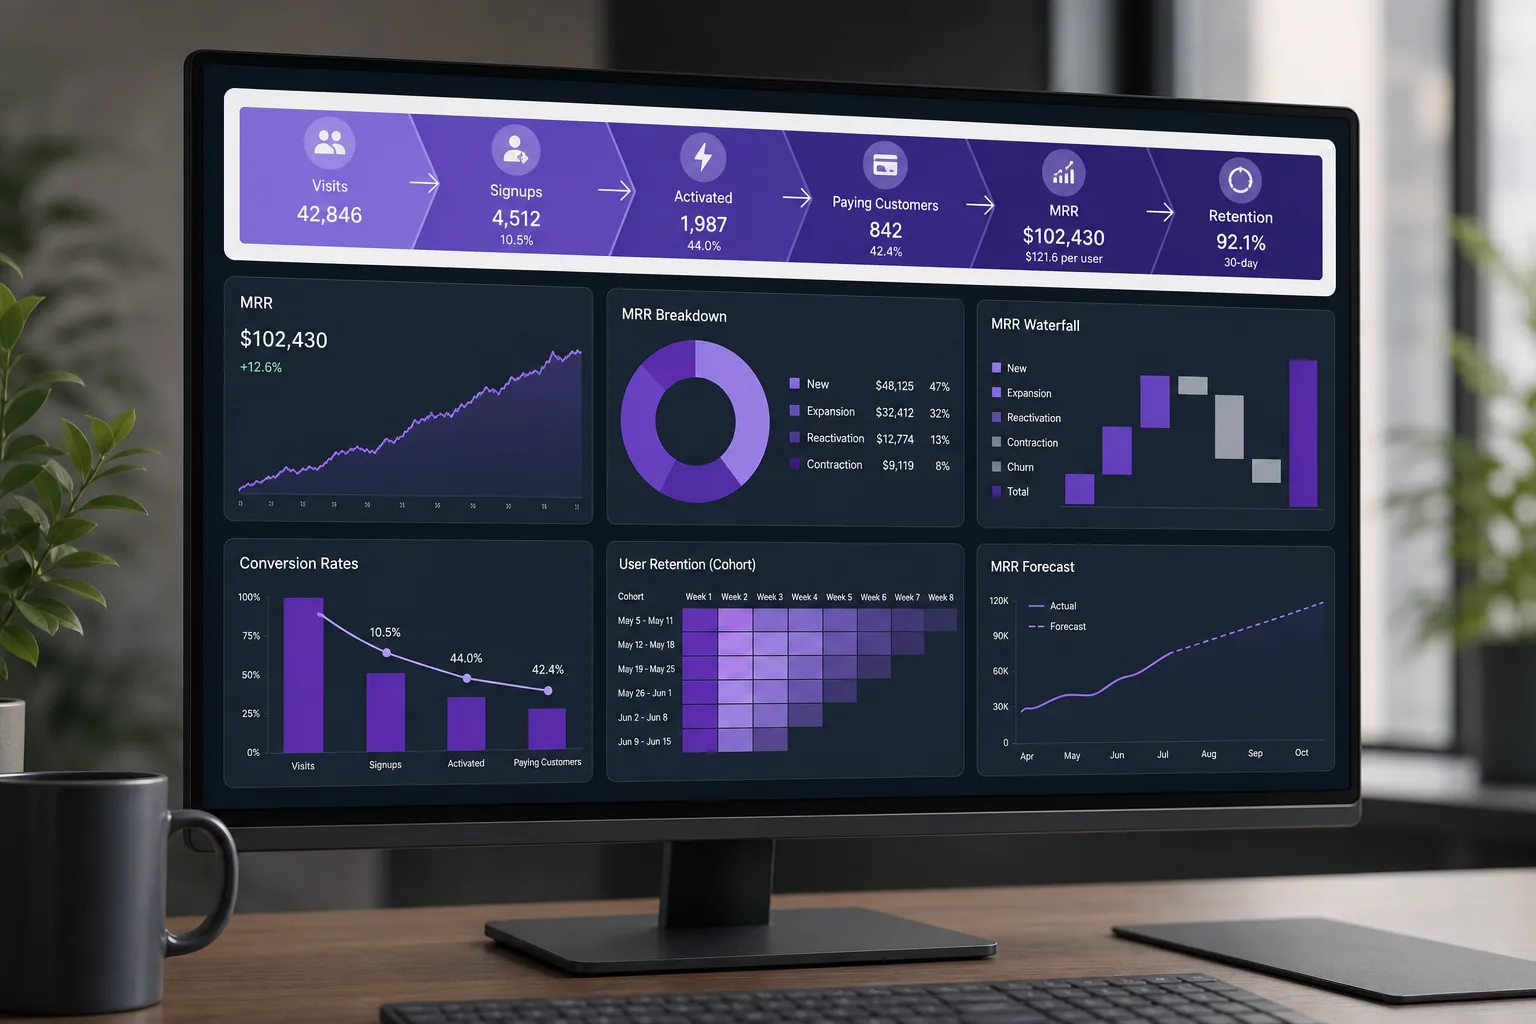
SaaS Funnel Analytics: Visits, Signups, and MRR
Learn how SaaS funnel analytics connects visits, signups, activation, churn, and MRR so you can make better growth decisions.
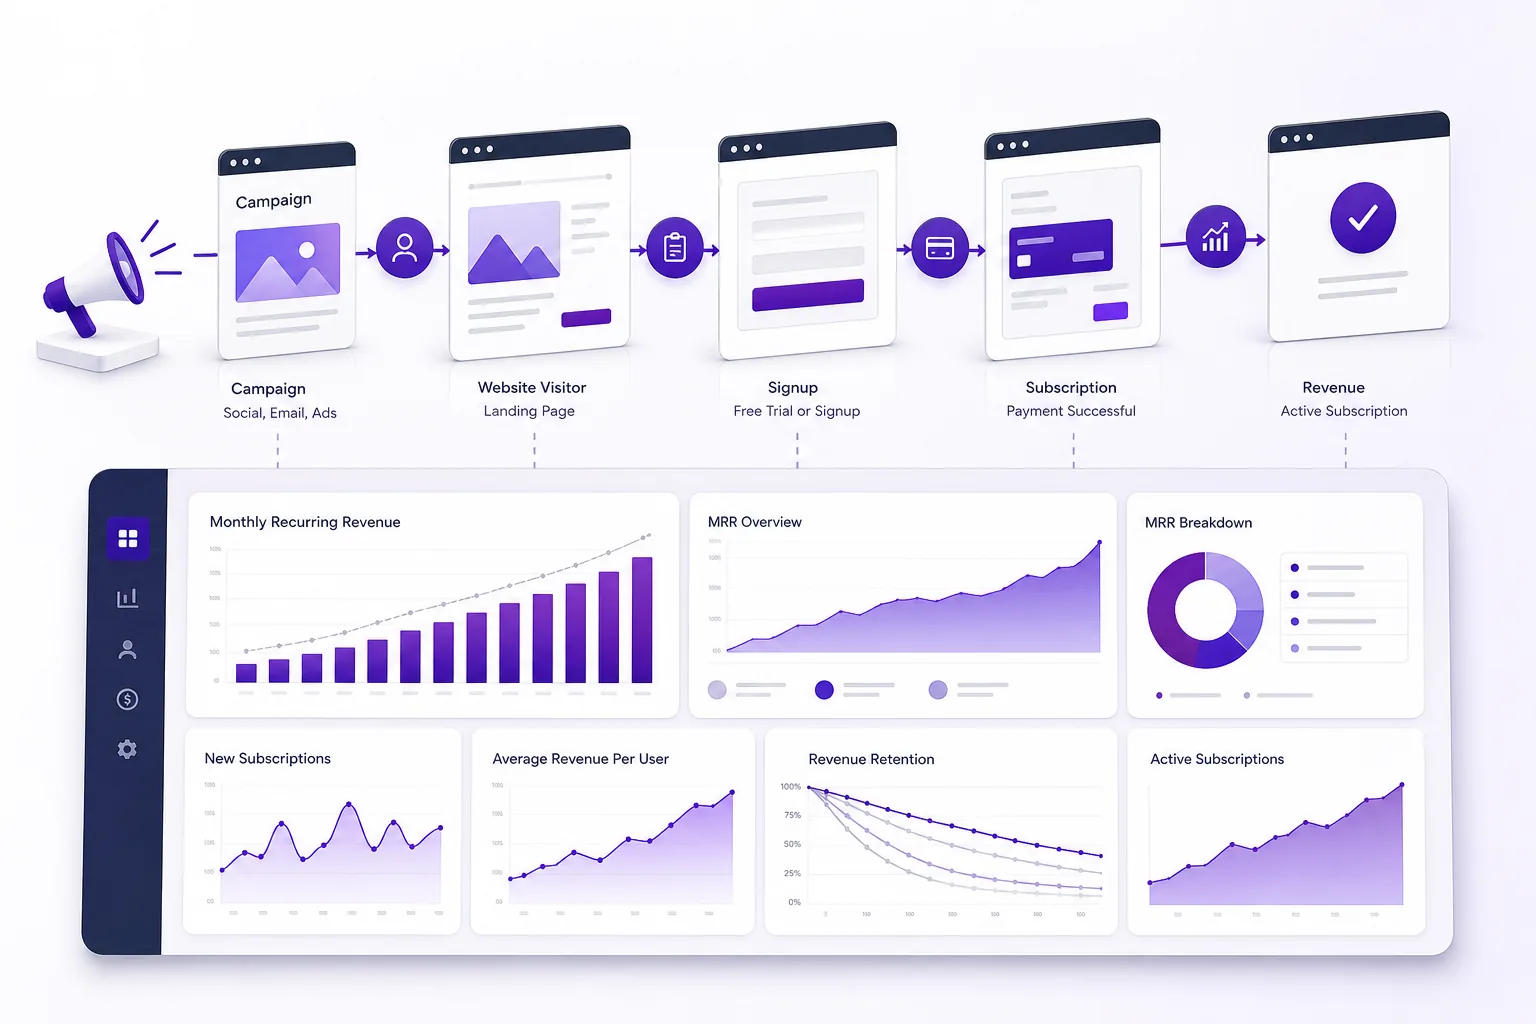
UTM Tracking Connected to Revenue: SaaS Guide
Learn how UTM tracking connected to revenue links campaigns to signups, MRR, ROI, and retention. Build reliable SaaS attribution today.

Launch Platform Attribution MRR: 2026 Update
Launch platform attribution MRR isolates what a Product Hunt or Hacker News launch actually earns in recurring revenue, from tagging the spike to checking 30-day retention.

Best Tools to Track Paying Customers by Channel
Compare the best tools to track which marketing channel drives paying customers, MRR, revenue, and retention. Find the right fit for your SaaS team.

Best SaaS Analytics Tools for 2026
Compare the best SaaS analytics tools for 2026. Find the right platform for revenue tracking, churn analysis, product analytics, and growth insights.

Best Chartsy Growth Feature Best Practices
A dos-and-don'ts checklist for getting accurate results from Chartsy Growth: UTM hygiene, event wiring, review cadence, and the mistakes that quietly break attribution.
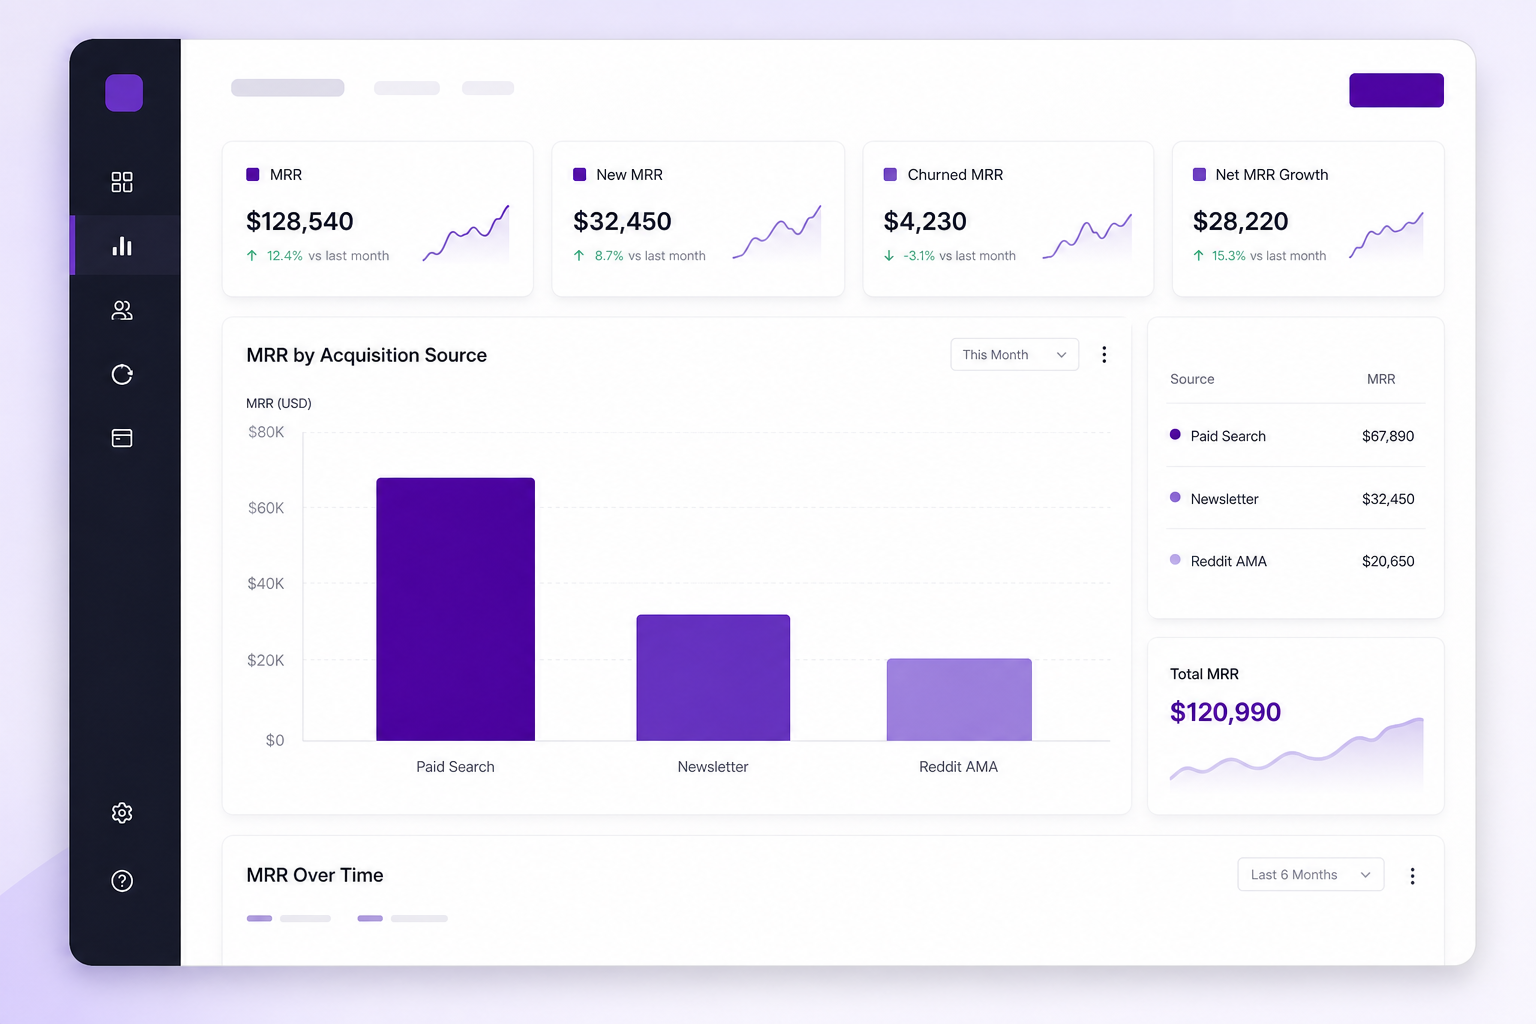
Chartsy Growth Feature Use Cases Explained
Explore Chartsy Growth feature use cases, from tracking marketing sources to connecting traffic, customers, MRR, revenue, and retention.
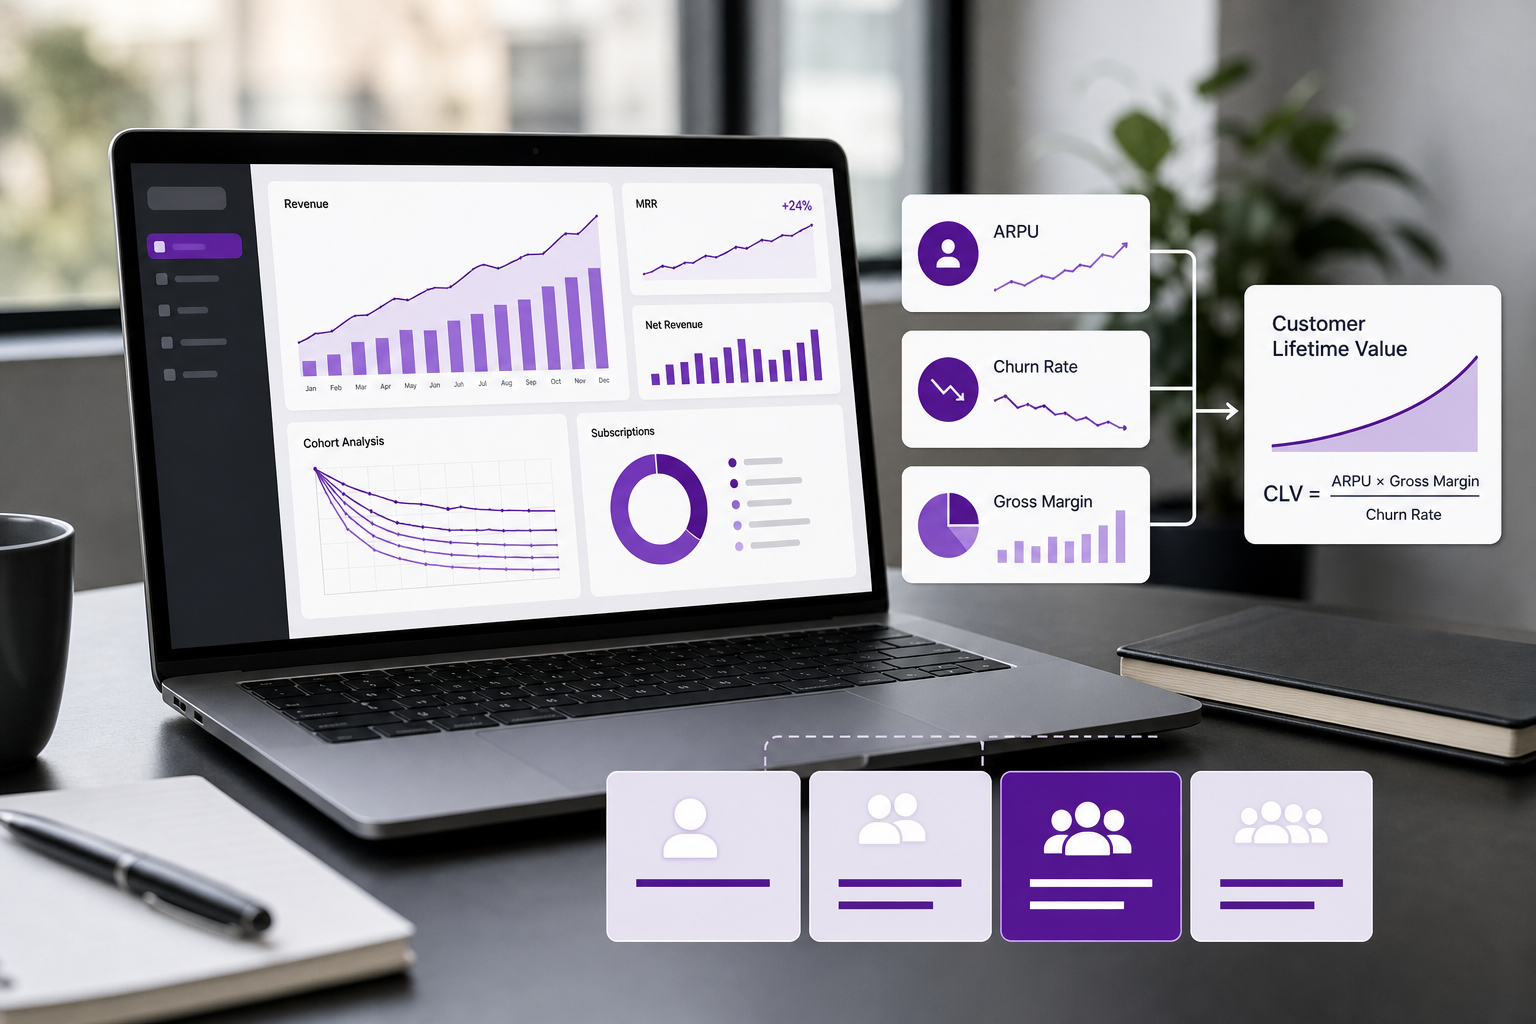
How to Increase Customer Lifetime Value
Learn how to increase customer lifetime value with SaaS tactics for pricing, retention, expansion revenue, segmentation, and better customer decisions.

Marketing Attribution for SaaS Revenue
Learn how marketing attribution connects SaaS channels to MRR, churn, and customer value. Compare models and see where Chartsy fits.
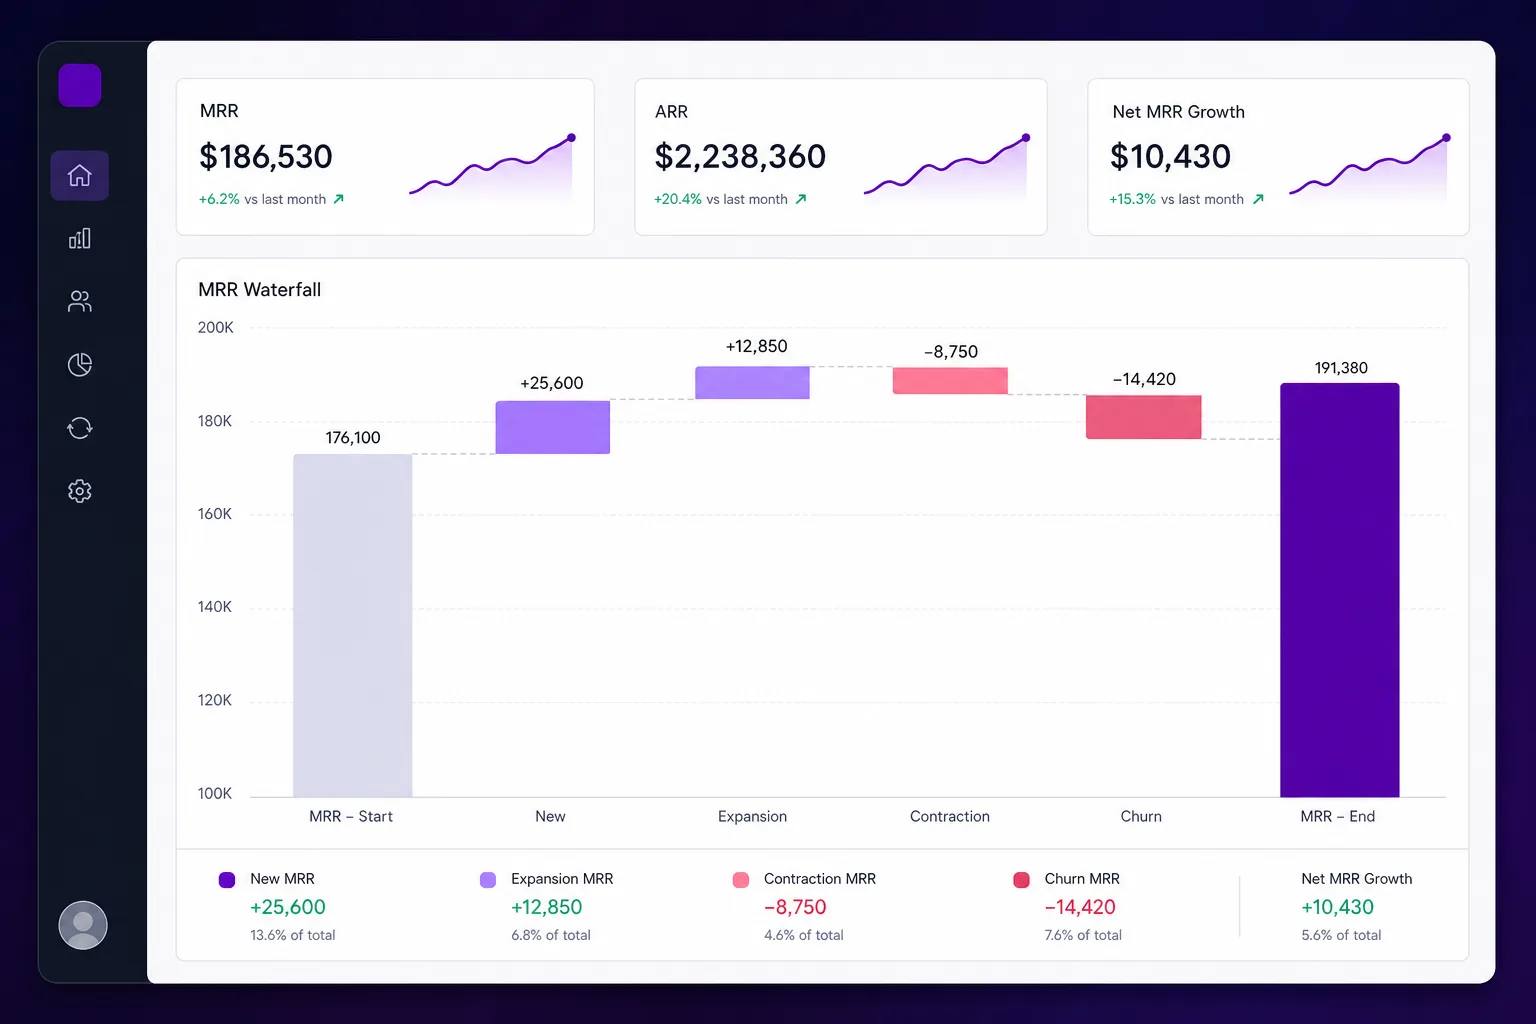
How to Track SaaS Growth Metrics
Learn how to track SaaS growth metrics, interpret MRR, churn, retention, LTV, and attribution, and turn subscription data into better decisions.
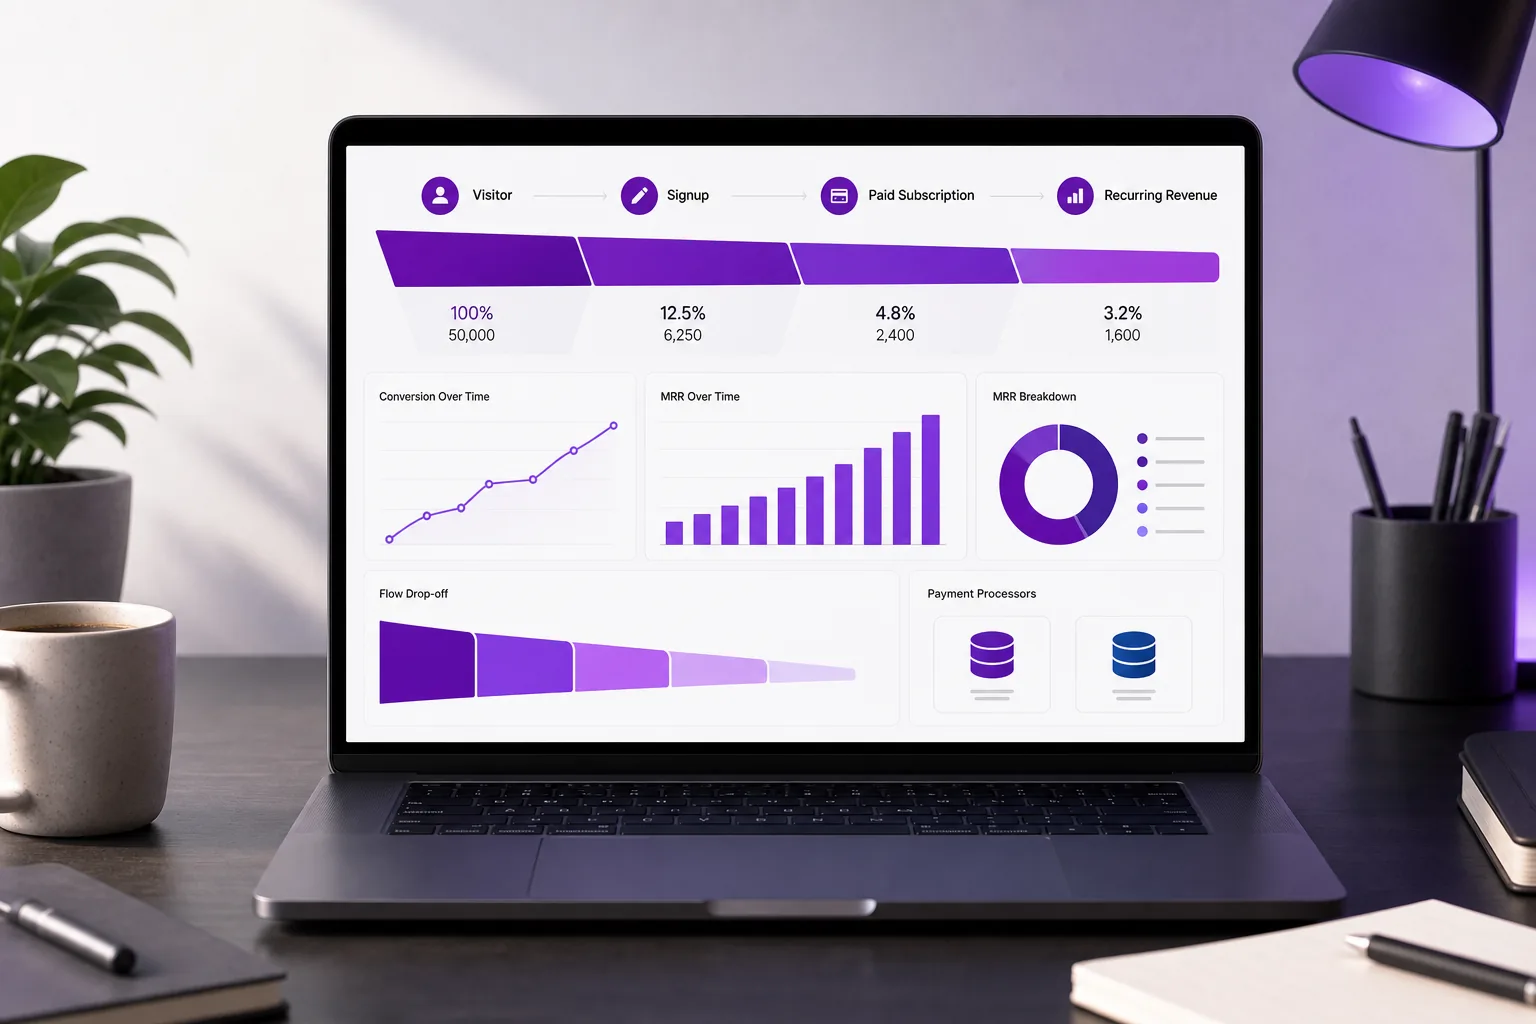
Signup to MRR Conversion Tracking Guide
Learn signup to MRR conversion tracking with GA4, GTM, attribution, CAC formulas, and revenue dashboards that connect acquisition to paying customers.
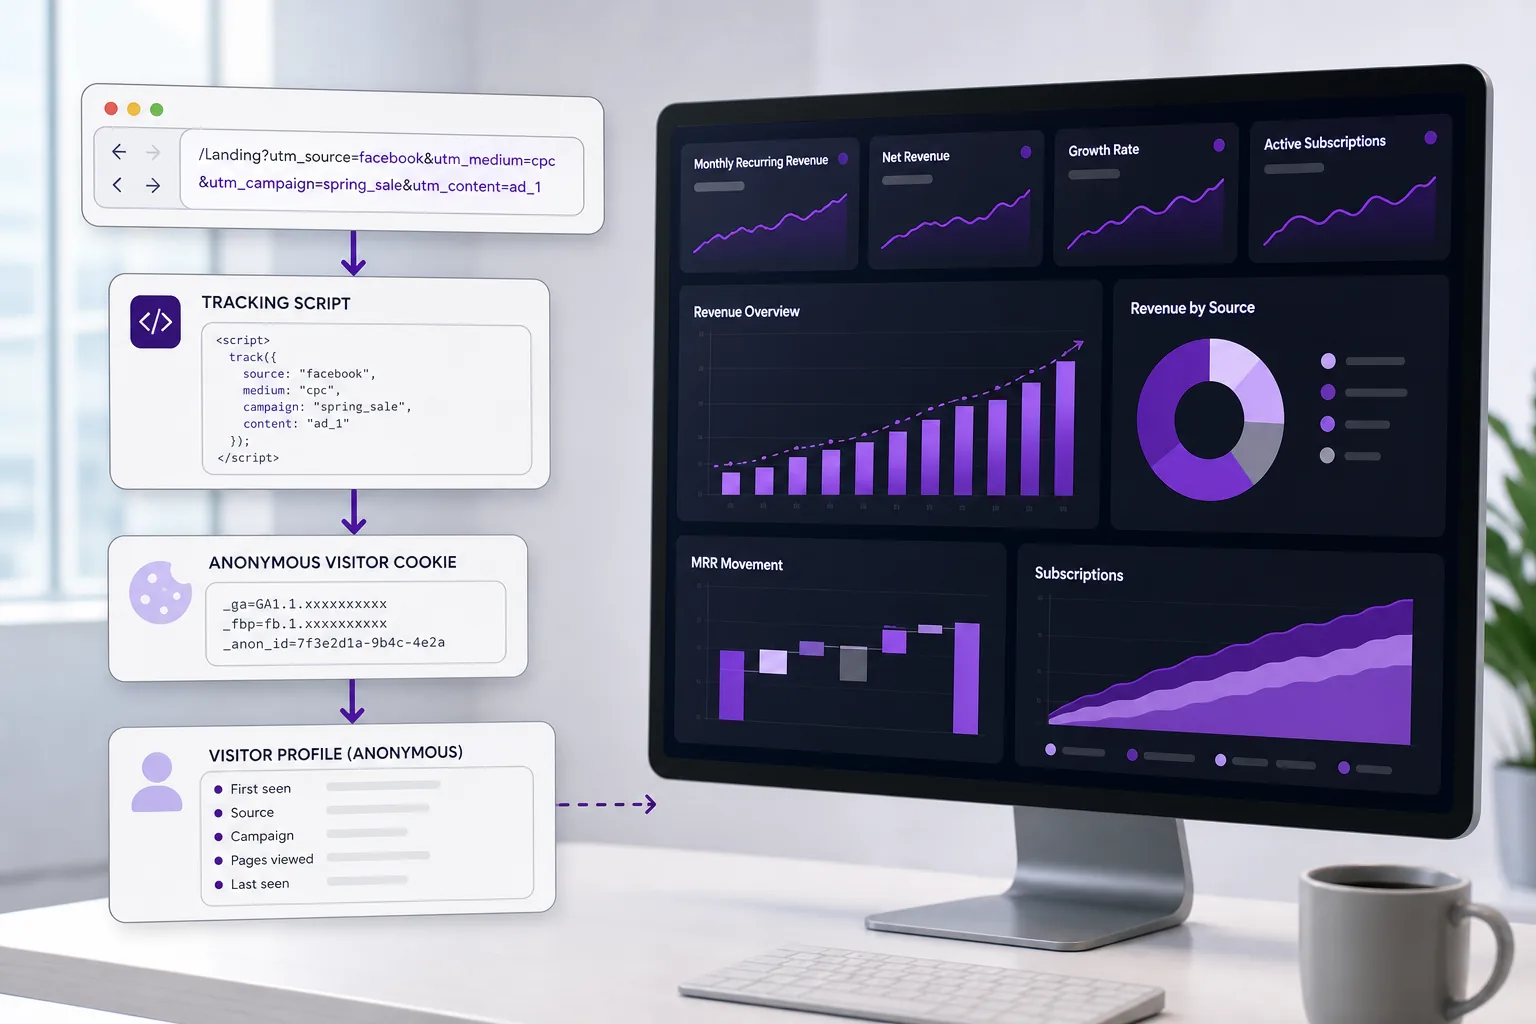
Website Visitor to Paying Customer Tracking Guide
Learn website visitor to paying customer tracking with pixels, UTMs, funnel metrics, attribution, compliance, and SaaS revenue analysis.

Best ProfitWell, Baremetrics, and ChartMogul Alternatives
Compare profitwell vs baremetrics vs chartmogul for SaaS metrics, pricing, integrations, cohorts, churn analysis, and the best fit for your team.

ChartMogul vs Stripe Analytics: SaaS Review
Compare ChartMogul and Stripe Analytics for SaaS metrics, integrations, reporting, and ease of use - and see where Baremetrics fits in too.
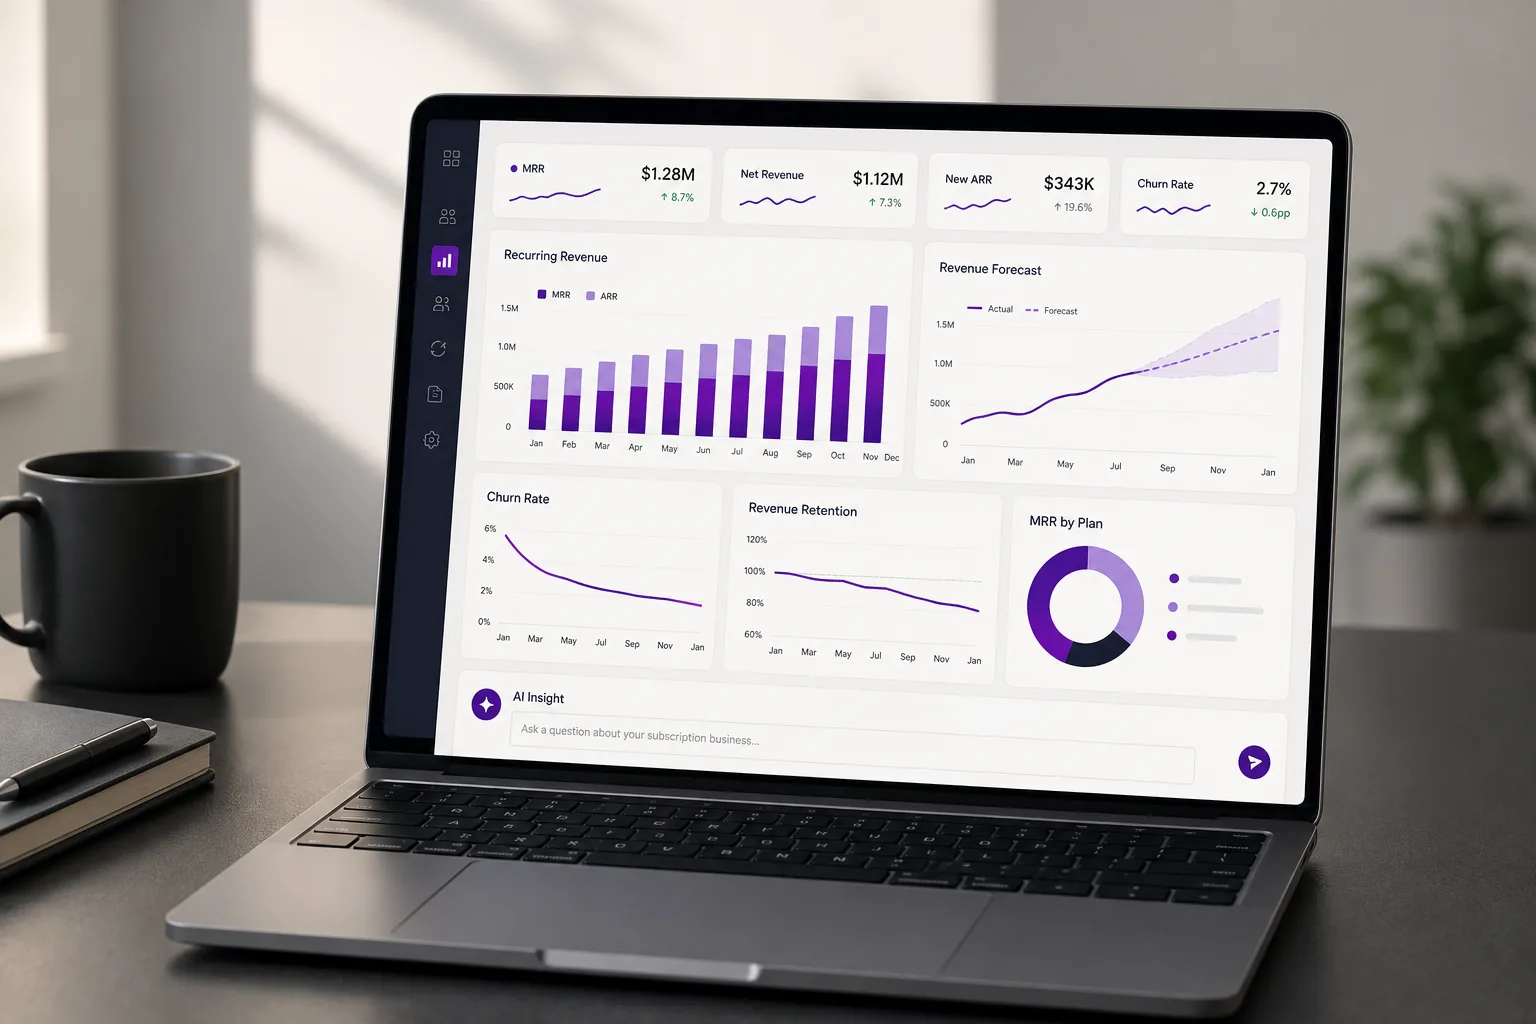
Baremetrics vs Paddle: Which Fits SaaS Teams?
Compare Baremetrics vs Paddle for SaaS analytics, billing, compliance, pricing, integrations, and growth. Find the better fit for your team.

ProfitWell vs Baremetrics: Which Is Better?
Compare ProfitWell vs Baremetrics for SaaS analytics, including MRR, churn, retention, payment recovery, integrations, pricing, and best-fit use cases.

Churnkey vs ProfitWell: Which Is Better?
Churnkey vs ProfitWell compared for SaaS teams: metrics, churn analysis, recovery automation, pricing reality, tradeoffs, and best-fit use cases.

Best Tools: How to Reduce Customer Churn
Learn how to reduce customer churn with six tools for tracking retention, finding at-risk customers, improving payments, and acting on SaaS data.
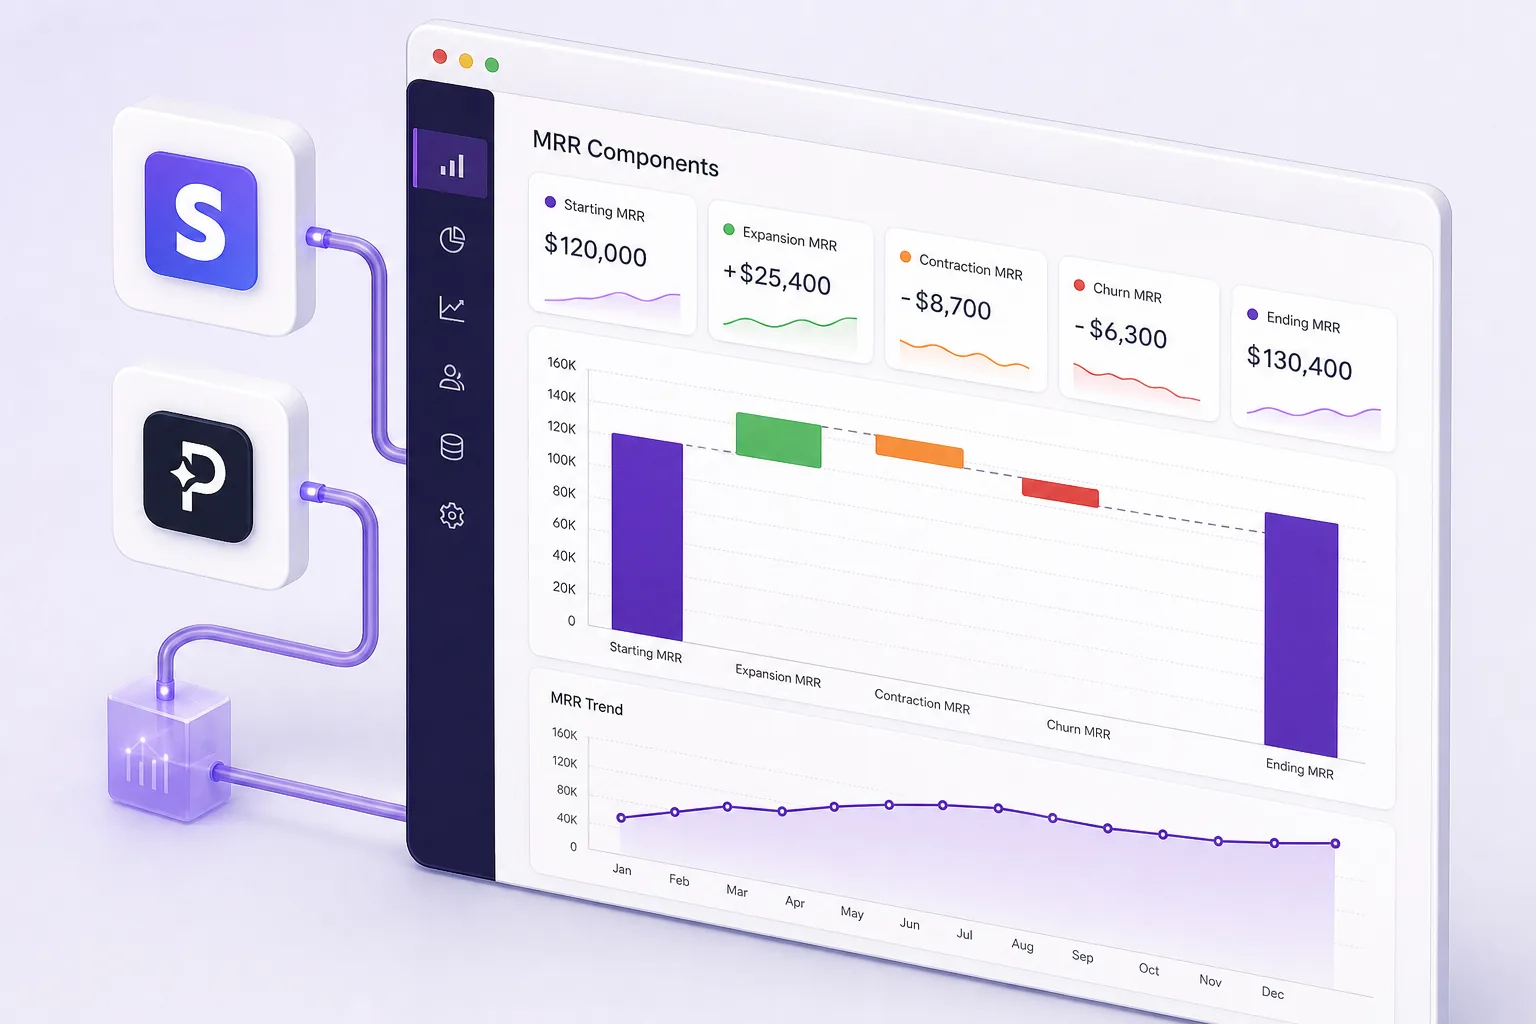
Net Dollar Retention vs Net Revenue Retention: Which Term Should You Use?
NDR and NRR measure the same thing, but the two terms show up in different rooms. Here's where each name comes from and which one to use in your own reporting.
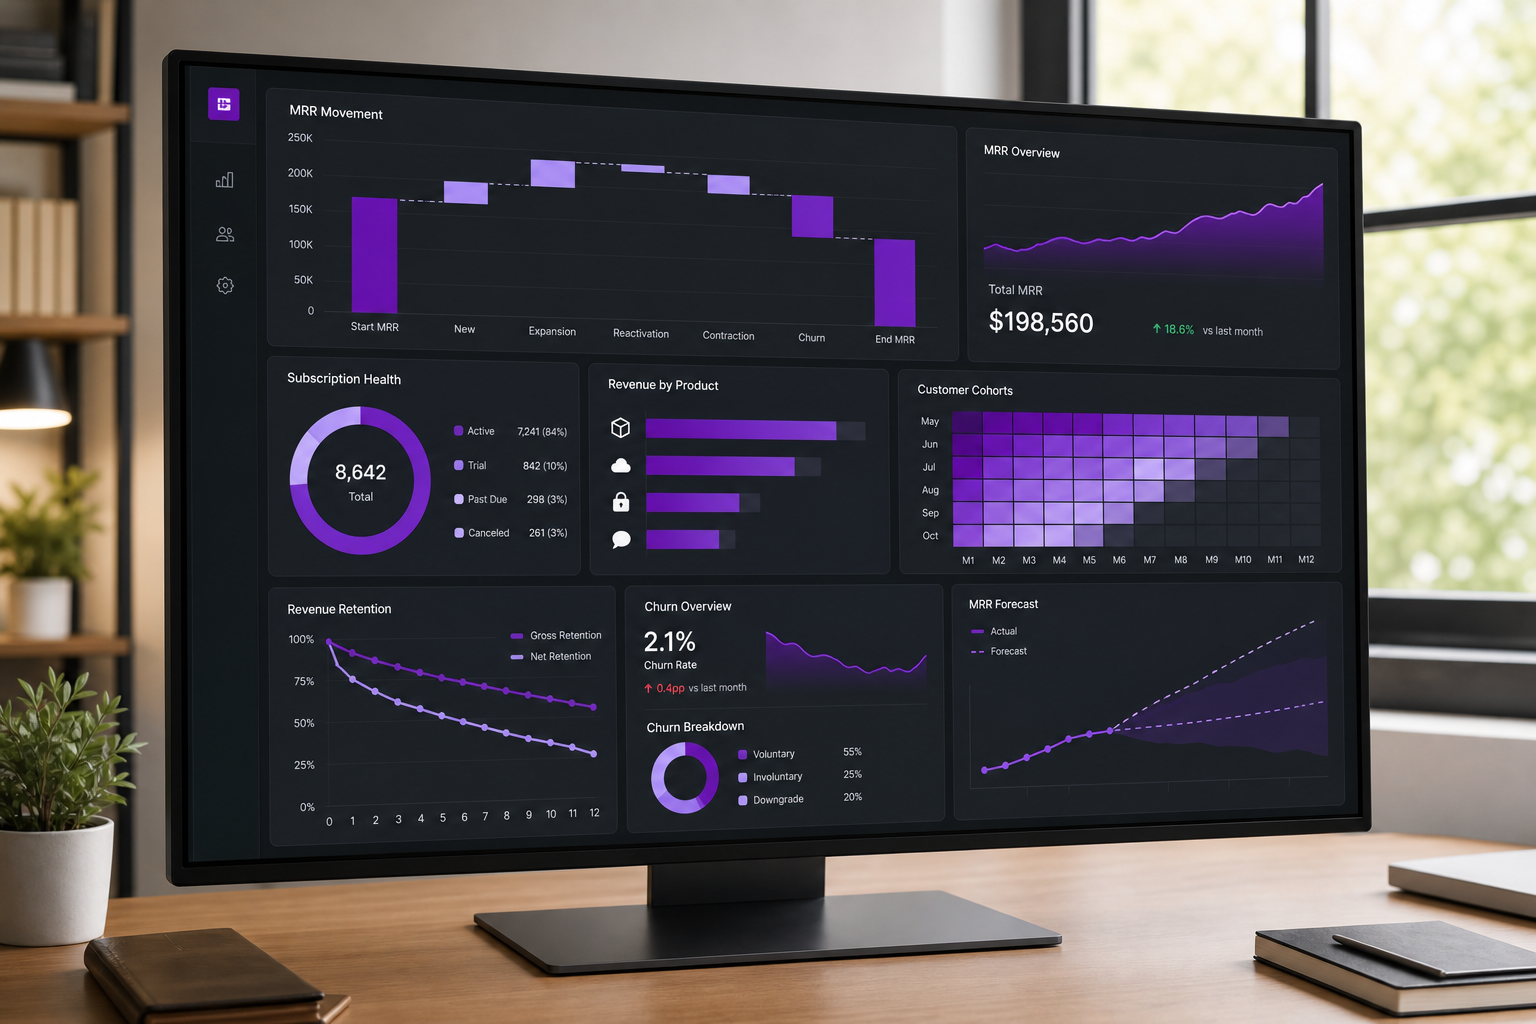
Revenue Analytics: Metrics, Methods, and Examples
Learn how revenue analytics helps SaaS teams track MRR, churn, retention, attribution, and customer value to make better growth decisions.

How to Use Chartsy Growth Feature
Learn how to use Chartsy Growth to connect acquisition sources with signups, customers, MRR, revenue, and retention for better SaaS decisions.

Chartsy Growth Feature Overview
Chartsy Growth feature overview: connect marketing sources to signups, customers, MRR, revenue, and retention with less spreadsheet work.
Introducing Growth: Track Revenue by Marketing Channel in Chartsy
Most attribution tools tell you where your signups came from. Growth tells you where your revenue came from - connecting every visit to a signup to real Stripe or Paddle subscription revenue, automatically, by channel.
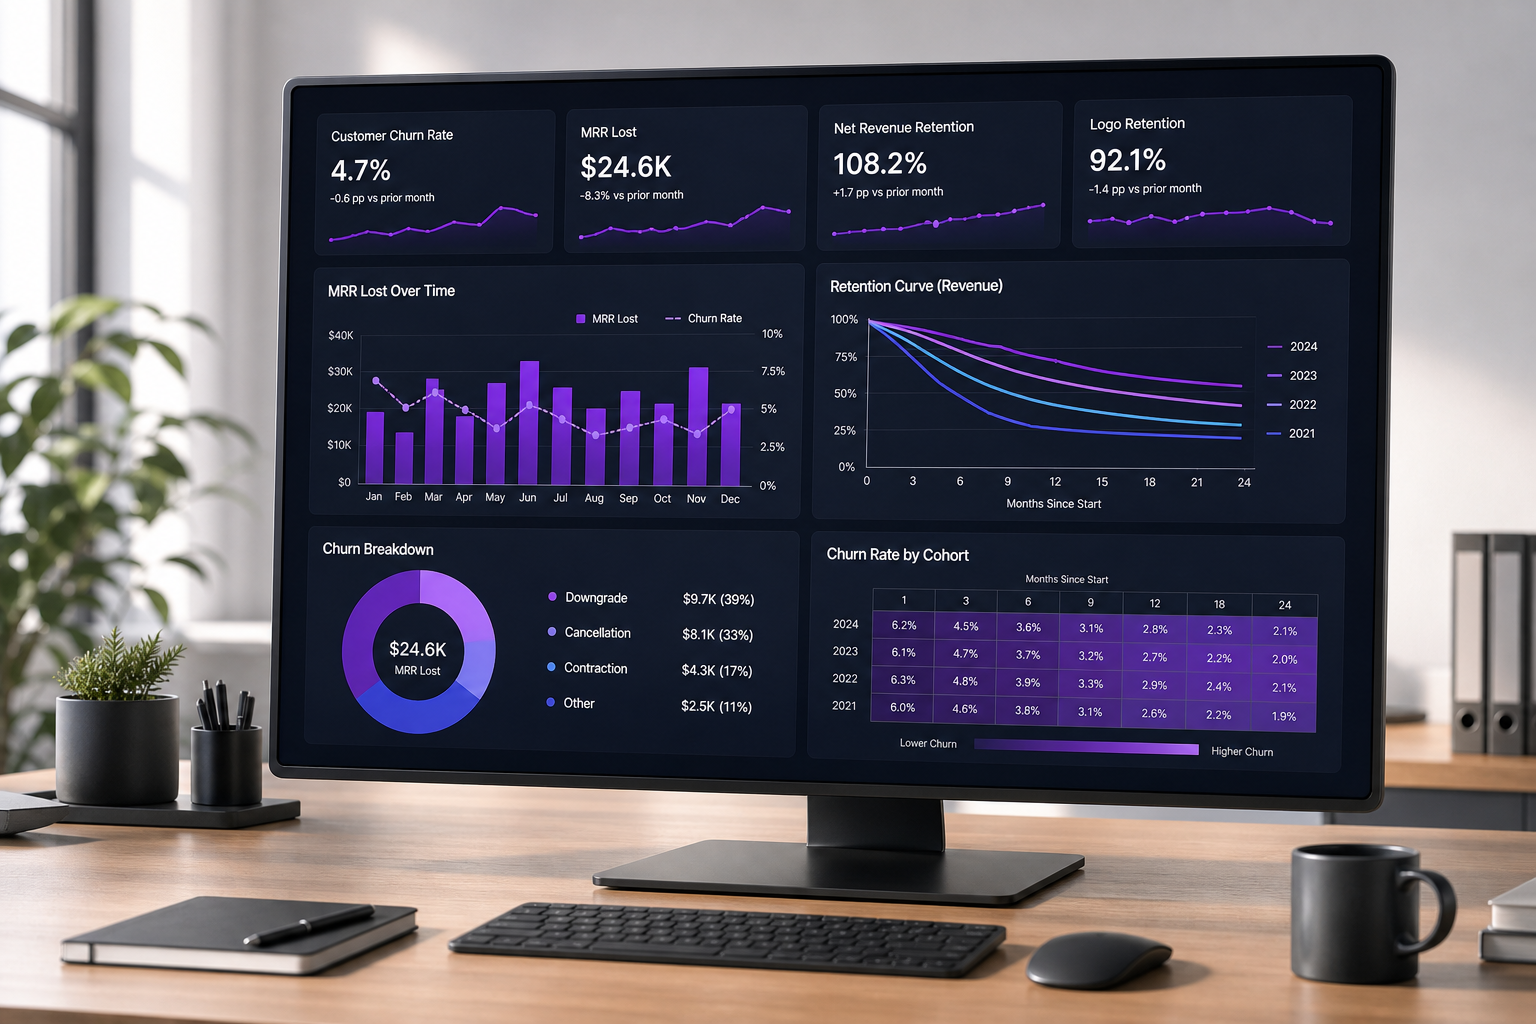
How to Do Customer Churn Analysis
Learn how to perform customer churn analysis for a SaaS business, calculate churn, find retention problems, and turn subscription data into action.
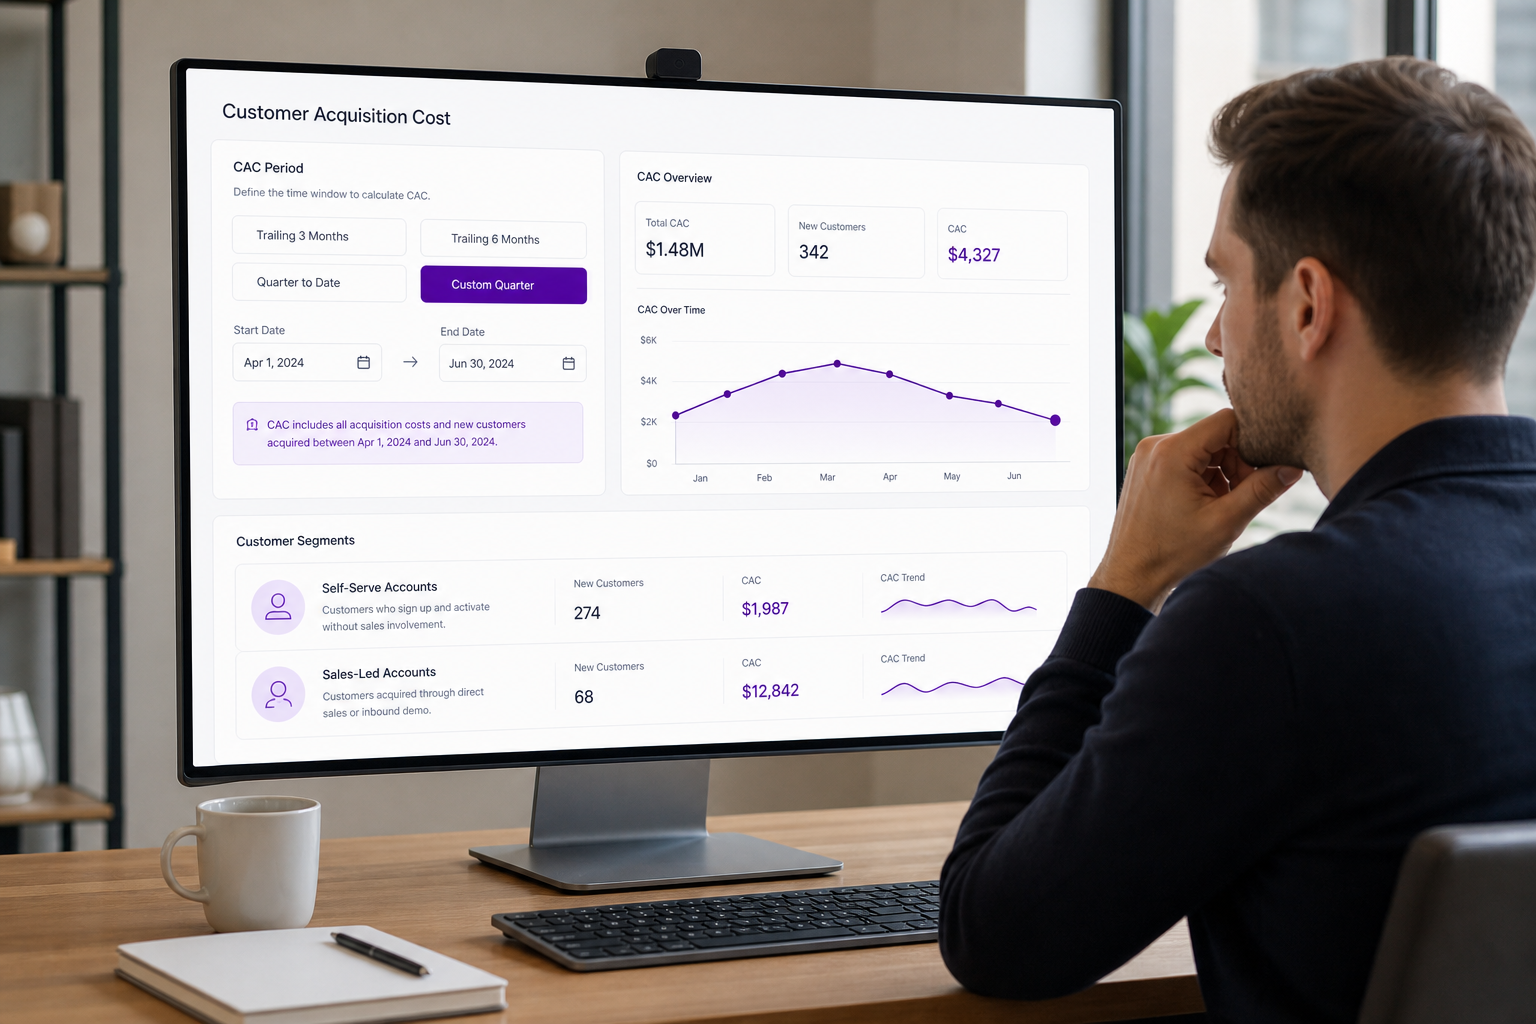
How to Calculate Customer Acquisition Cost
Learn how to calculate customer acquisition cost with the right formula, SaaS examples, channel breakdowns, and ways to improve CAC.
Marketing Attribution for SaaS: Why Most Tools Stop at Signups
Visit attribution and signup attribution are easy to get. Revenue attribution - knowing which channel is actually worth your time, after churn - almost never is. Here's why, and what closing that gap looks like.

Best Net Revenue Retention Formula Guide
Learn the net revenue retention formula, calculate NRR with examples, compare it with GRR, and improve retention across your SaaS business.
UTM Tracking for SaaS Founders: A No-Code Guide to First-Touch and Last-Touch Attribution
What UTM parameters, click IDs, and first-touch/last-touch cookies actually do - and how to get channel-level attribution set up without writing custom tracking code.

Annual Recurring Revenue Calculation: Formula & Examples
Learn annual recurring revenue calculation with formulas, SaaS examples, MRR links, forecasting tips, and reporting guidance.

How to Calculate LTV for SaaS
Learn how to calculate LTV for SaaS using ARPU, churn, and customer lifespan, with formulas, examples, and practical ways to interpret the result.

Customer Lifetime Value Formula: A SaaS Guide
Learn the customer lifetime value formula for ecommerce, marketplaces, and SaaS, compare LTV with CAC, and build cohort and predictive forecasts.
Best Paddle Analytics Tools in 2026
Paddle handles billing, tax, and payments well - but analytics is a different job. Here are the best Paddle analytics tools for MRR, churn, and retention reporting, compared.
Best Stripe Analytics Tools in 2026
Stripe's dashboard only goes so far. Here are the best Stripe analytics tools for MRR, churn, cohort, and revenue reporting - compared on data accuracy, setup, and price.
How to Build a Custom Investor Dashboard with AI (No Analyst, No Spreadsheet)
Investors don't want your default dashboard - they want the specific handful of metrics that answer their questions. Here's how to build that exact view with AI instead of exporting to a spreadsheet every quarter.
ChartsyAI vs. Traditional BI Tools: Why 'Ask a Question' Beats 'Build a Report'
Tableau, Looker Studio, and most BI tools still work the same way they did a decade ago: pick fields, configure a chart, publish a report. Here's what changes when you ask a question instead.
Custom SaaS Dashboards: How to Build Exactly the Dashboard You Need with AI
Preset dashboards show you what a vendor thinks matters. Here's how to build a fully custom SaaS dashboard, chart by chart, by asking questions in plain English instead of configuring a chart builder.
Fixed Dashboards vs. AI-Built Custom Dashboards: Why One-Size-Fits-All Analytics Doesn't Work for SaaS
Baremetrics, ChartMogul, and Paddle's own analytics all give you the same fixed set of charts every SaaS business gets. Here's what changes when a dashboard is built from your own questions instead.
How to Generate Charts from Your Paddle Data with AI
No spreadsheet export, no manual formulas - here's exactly how to turn your Paddle subscription and revenue data into a chart by asking a question in plain English.
How to Generate Charts from Your Stripe Data with AI
Skip the report builder. Here's exactly how to turn your Stripe subscription and revenue data into a chart by asking a question in plain English - with real example prompts.
Your Daily SaaS Briefing: How Chartsy Greets You With Today's Business Summary
Every time you open Chartsy's chatbot, it greets you with a daily briefing - MRR movement, new and churned subscribers, renewals, and failed payments - so you know what's happening before you ask a single question.
Best MRR Breakdown Dashboard Tools Compared (2026)
Compare the best MRR breakdown dashboard tools for SaaS - Chartsy, ChartMogul, Baremetrics, ProfitWell, and Stripe - and find the one that actually explains your revenue.
Stripe Metadata & Paddle Custom Data: Beyond Revenue Analytics
Most metadata guides only cover acquisition_source and plan_type. But metadata is just a key-value store - here's how to explore any field you've stored in Stripe or Paddle, revenue-related or not.
Chartsy Dashboard Templates: The Right Starting Point on Day One
A blank dashboard is intimidating and a fixed one rarely fits. Chartsy's four dashboard templates give you a relevant starting point the moment you connect Stripe or Paddle.
Chartsy Growth Goals & Challenges: Turn Your MRR Target Into a Habit
Setting an MRR or subscriber goal is easy. Sticking with it for months is the hard part. Here's how Chartsy's Goals and Challenges features turn a target into an ongoing habit.
What Is Customer Growth Rate? SaaS Formula and Benchmarks
Customer growth rate tracks how fast your subscriber count is growing - a different signal from MRR growth rate, and one that can quietly diverge from revenue in either direction.
How Chartsy Detects Upgrades, Downgrades, and Expansion MRR
Stripe and Paddle don't store a 'this customer upgraded' event. Here's how Chartsy infers expansion, contraction, and reactivation MRR from raw invoice history.
Is It Safe to Connect Stripe or Paddle to an Analytics Tool?
Connecting your payment processor to a third-party analytics tool is a fair thing to be cautious about. Here's exactly what read-only access means and what Chartsy can and can't do.
Paddle Classic vs Paddle Billing: What Actually Changed
Paddle rebuilt its billing product from the ground up. Here's what's different between Paddle Classic and Paddle Billing, and what to check before you migrate.
50 Questions to Ask Your SaaS Revenue Data With ChartsyAI
50+ real example questions you can ask ChartsyAI about your Stripe or Paddle data - from MRR trends to churn forensics - copy, paste, and try them today.
Building in Public: How to Share SaaS Progress Without Oversharing
Chartsy's Share Progress feature turns your monthly goal into a branded, shareable image - with a privacy toggle so you can build in public without publishing your exact revenue.
How to Switch From Stripe to Paddle Without Losing Revenue History
Switching payment processors shouldn't mean losing your MRR trend line. Here's how to move from Stripe to Paddle (or back) without a gap in your revenue reporting.
What Loss Aversion Taught Us About Trial-to-Paid Conversion
We rebuilt Chartsy's trial-ended screen around loss aversion instead of a generic upgrade prompt - blurring the user's own usage data behind a lock icon. Here's why, and what we learned.
Why Chartsy Sends a Weekly Report Instead of Another Dashboard
Chartsy automatically emails a weekly summary - subscribers, MRR, churn, plan performance, and geography - so you stay on top of your numbers without logging in.
10 Questions Your Stripe Dashboard Can't Answer About Churn
Stripe's dashboard shows you that revenue dropped - not why. Here are 10 churn and payment-failure questions Stripe can't answer, and how to actually get them answered.
What Is a SaaS Health Score? One Number That Combines Your Key Metrics
A SaaS health score blends churn, growth, conversion, revenue per customer, and runway into a single weighted score. Here's how it's calculated and what it's actually useful for.
10 Questions Your Paddle Dashboard Can't Answer About Retention
Paddle's dashboard and ProfitWell Metrics give you headline numbers - not the cohort and revenue-quality questions that actually explain your growth. Here are 10 of them.
Freemium vs Free Trial: Which Converts Better for SaaS?
Freemium and free trials solve the same problem - letting people try before they buy - in opposite ways. Here's how they differ, and how to tell which one fits your product.
SaaS Board Deck Metrics: What Investors Actually Want to See
Investors and board members care about a specific, narrow set of SaaS metrics - not a dashboard dump. Here's exactly what to include in your board deck and why.
Revenue Concentration Risk: How Many Customers Is Too Few to Rely On
Healthy MRR growth can hide a dangerous amount of revenue sitting in just a few accounts. Here's how to measure customer concentration risk and when it becomes a real problem.
How AI Is Changing SaaS Analytics: From SQL to Plain English
SaaS teams used to need a SQL query and a data analyst to answer a revenue question. Here's how natural-language AI analytics is changing that - and where it still falls short.
Reactivation MRR: How to Measure and Grow Win-Back Revenue
Reactivation MRR is revenue from customers who churned and came back. It's usually the smallest line in your MRR movement - and the most underused growth lever.
SaaS Customer Segmentation: How to Use Your Stripe Data to Find Your Best Customers
Not all customers are created equal. Customer segmentation lets you group customers by shared characteristics so you can focus on the ones that matter most - and stop averaging out the signal.
How to Combine Stripe and Paddle Data Into One Dashboard
Running both Stripe and Paddle means two separate MRR numbers, two churn rates, and no combined view. Here's how to unify them into one accurate dashboard.
The MRR Waterfall Chart: How to Visualize Revenue Movement Month to Month
A waterfall chart breaks total MRR change into new, expansion, contraction, churned, and reactivation revenue - turning one confusing number into a clear story.
How to Use NPS Data to Predict and Reduce Churn in Your SaaS Business
Most SaaS founders treat NPS as a feel-good metric. But used correctly, NPS is one of the most powerful leading indicators of churn available to you - if you act on it before a customer cancels.
Gross Revenue vs Net Revenue in SaaS: What's the Real Difference?
Gross revenue is everything billed. Net revenue is what's left after refunds, discounts, and chargebacks. Confusing the two makes your SaaS reporting look healthier than it is.
Product-Led Growth Analytics: The Metrics That Actually Drive PLG Success
PLG only works if you're measuring the right things. Traditional SaaS metrics like MRR and CAC are lagging indicators. PLG success is driven by a different set of upstream signals - ones that most analytics tools aren't built to surface.
SaaS Cohort Analysis: How to Track Retention by Signup Month
A single churn number hides more than it reveals. Cohort analysis groups customers by signup date so you can see exactly when and why retention breaks down.
Involuntary Churn, Failed Payments and Dunning: Fix SaaS Leaks in 2026
Involuntary churn happens when payments fail, not when customers decide to leave. Here's how dunning - card updates, timed retries, and a short outreach sequence - recovers a large share of that lost MRR before cancellation becomes permanent.
Logo Churn vs Revenue Churn: Why Losing Fewer Customers Can Still Destroy Your Business
Logo churn counts customers lost. Revenue churn counts money lost. They tell completely different stories - and optimizing for the wrong one leads to decisions that look smart on paper but quietly destroy your MRR.
SaaS Churn Rate Benchmarks: What's Good, What's Bad, What's Fatal
Churn benchmarks vary significantly by ARR stage, customer segment, and pricing model. Here's what the numbers actually look like across the industry - and how to interpret where yours stands.
Introducing Chartsy's MRR Breakdown Dashboard
A guided look at where your subscription revenue comes from - and what's changing. The new MRR Breakdown dashboard surfaces current MRR, movement trends, plan-level splits, and top customers in one clear, narrative-driven view.
How an MRR Dashboard Helps You Make Better Decisions Every Day
When your MRR, plan breakdown, movements, and top customers are in one place, the decision you need to make each morning becomes obvious. Here's how a complete MRR dashboard changes the way you run your subscription business.
Stripe Metadata: What to Track, How to Set It Up, and Why It Changes Your Analytics
Most SaaS founders use Stripe metadata inconsistently or not at all - and miss out on the most powerful segmentation layer in their business. Here's a practical guide to what to track, how to set it up, and what you can do with it once it's there.
Chartsy MRR Dashboard vs ProfitWell: Which Gives You Answers?
Chartsy's MRR dashboard gives guided answers. ProfitWell gives deep analytics. Both track subscription revenue - but they're solving different problems. Here's how to choose.
Stripe MRR vs Chartsy Dashboard: Raw Data vs. Guided Insight
Stripe shows you payment data. Chartsy's MRR dashboard explains your subscription revenue - plan by plan, movement by movement. Here's the difference and why it matters.
Turn Your Stripe Metadata Into Business Intelligence
You've been tagging customers and subscriptions in Stripe for years. Here's how to finally use that data for real analysis - without a spreadsheet in sight.
Stripe vs Paddle: Which Payment Processor is Right for Your SaaS?
A detailed comparison of Stripe and Paddle on pricing, features, tax handling, and total cost of ownership - so you can choose the right payment processor for your SaaS business.
Best ProfitWell Alternatives in 2026: Subscription Analytics Tools Compared
Looking for a ProfitWell alternative? We compare the top subscription analytics platforms - Baremetrics, ChartMogul, Chartsy, and others - so you can find the right fit for your SaaS.
MRR Dashboard: How to Visualize Monthly Recurring Revenue (2026 Guide)
A complete guide to building an MRR dashboard for your SaaS business - what metrics to include, which tools to use, and how to go from raw Stripe or Paddle data to clear visual insights.
SaaS Pricing Calculator: How to Price Your Product Using Real Revenue Data
Learn how to calculate and optimize your SaaS pricing using actual subscription data - including formulas for ARPU, LTV, churn impact, and a step-by-step pricing model framework.
Stripe Analytics Dashboard: Build One Without a Developer (2026 Guide)
A step-by-step guide to building a custom Stripe analytics dashboard - tracking MRR, churn, LTV, and revenue trends - without SQL, exports, or a data team.
What Is Stripe Sigma? Features, Pricing & Limitations (2026)
A plain-English guide to Stripe Sigma: what it does, how much it costs, what SQL skills you need, and when a no-code alternative like Chartsy makes more sense.
Best Analytics Tools for SaaS Businesses Using Stripe or Paddle
Comparing the top analytics tools for SaaS businesses that run on Stripe or Paddle. Find out which platform gives you the clearest picture of MRR, churn, and revenue growth.
Best Ecommerce Analytics Tools for Online Store Owners
A practical comparison of the best ecommerce analytics tools available today. Learn which platforms help online store owners track sales, customers, and growth without the complexity.
What Is a Good Conversion Rate for a BigCommerce Store?
Wondering what counts as a good conversion rate for your BigCommerce store? Learn industry benchmarks, what affects your CVR, and how to improve it with the right analytics.
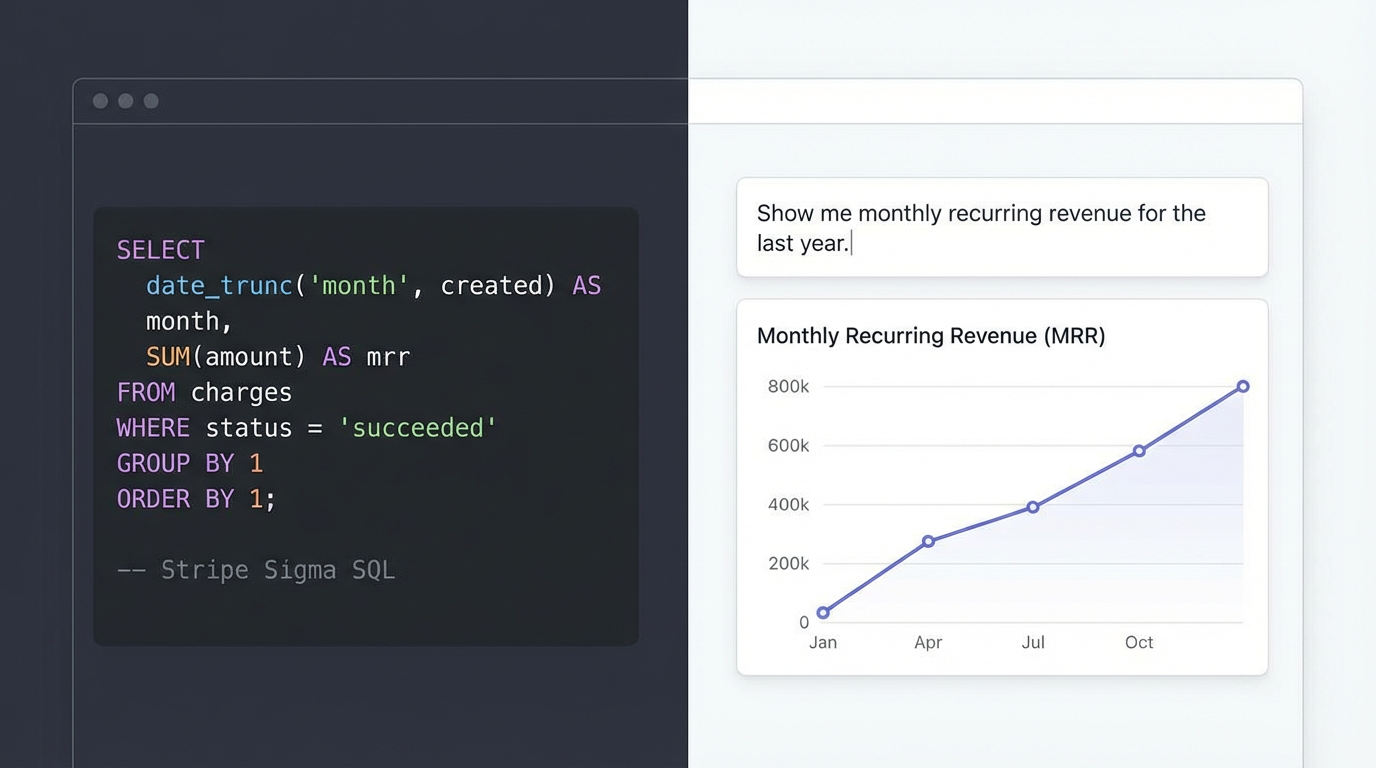
Stripe Sigma vs. Chartsy: Real Business Examples of How Teams Actually Use Them (2026)
Stripe Sigma is great for SQL-savvy analysts. Chartsy is built for founders and operators who want instant, visual answers from Stripe data without writing queries. Here's how both tools behave in real business scenarios.

How Chartsy Can Boost BigCommerce Sales in 2026
Boost BigCommerce sales in 2026 with ChartsyAI. Get actionable insights on products, customers, and revenue - no coding or developer needed.

How to Build a BigCommerce Dashboard Without Hiring a Developer (2025 Guide)
Learn how to create a BigCommerce analytics dashboard with ChartsyAI. Track sales, customers, products, and segments - no developer needed.

Why BigCommerce's Built-in Analytics Aren't Enough (And What to Do Instead)
BigCommerce's native analytics dashboard is fine for quick snapshots of revenue and orders — but it breaks down the moment you ask deeper questions about LTV, churn, or cohorts. Learn what's missing and what to use instead.
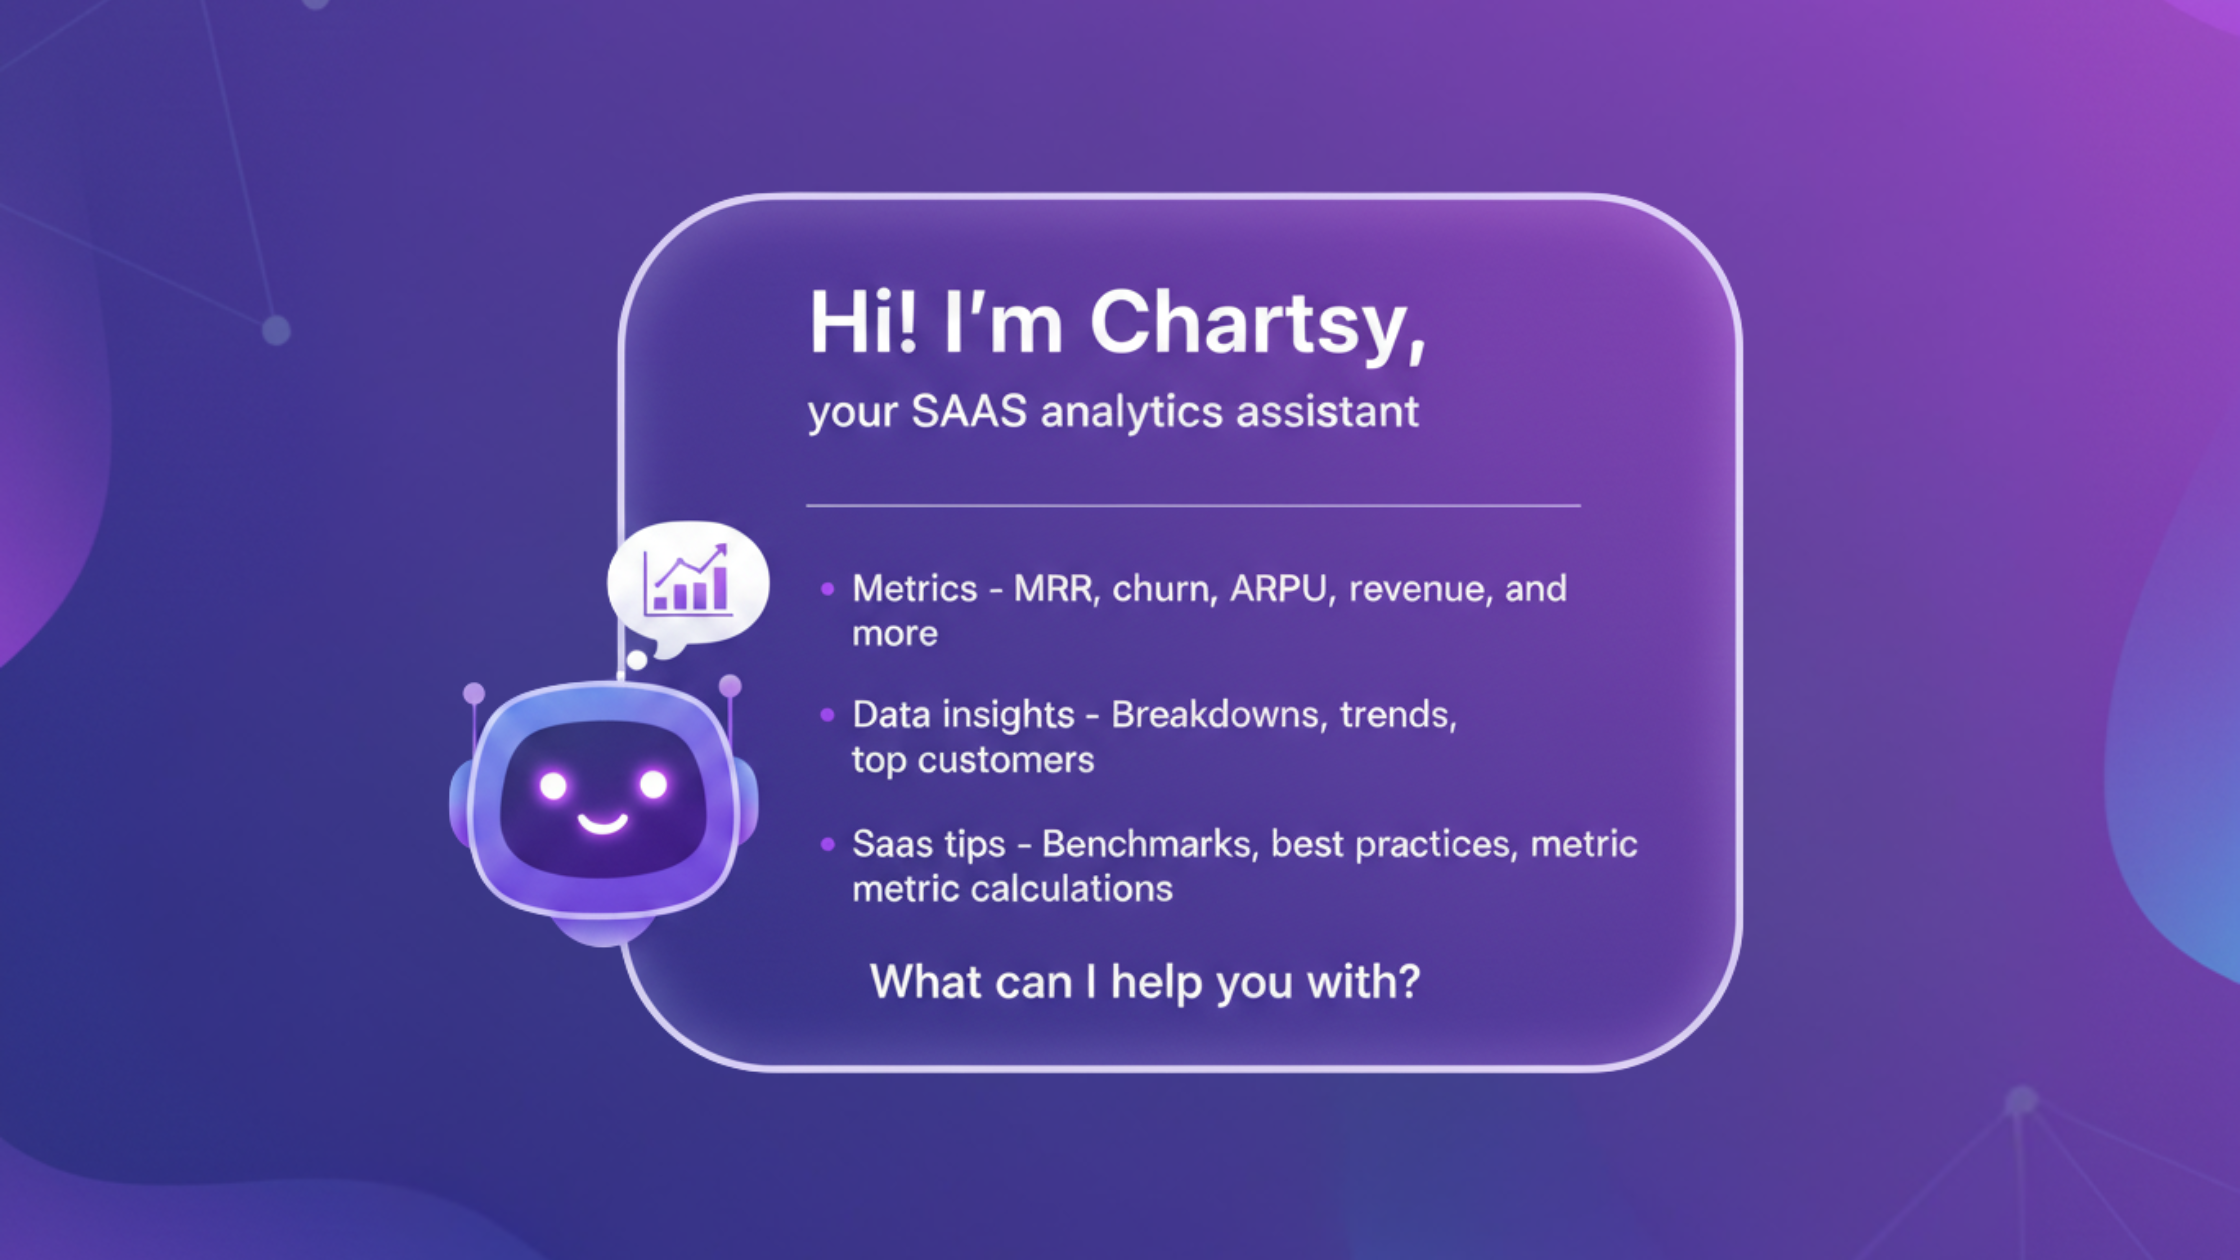
Meet Chartsy's New AI Chatbot for SaaS Data
Understanding your SaaS metrics just got a whole lot easier. Chartsy's new AI chatbot lets you explore your data in a simple, ChatGPT-style conversation — with clear explanations, real calculations, and instant visual insights.

Top 5 Best BigCommerce Apps to Grow Your Store in 2026
Scale revenue, improve retention, and understand your customers with the right tools. Discover the best BigCommerce apps for analytics, email marketing, reviews, subscriptions, and conversion optimization.

BigCommerce Custom Reports: How to Get the Data Your Store Actually Needs
BigCommerce's built-in reports can't answer most specific merchant questions - no SKU breakdowns, no COGS by month, no custom filters. Here's how to get exactly the reports you need, in plain English, without SQL or spreadsheets.
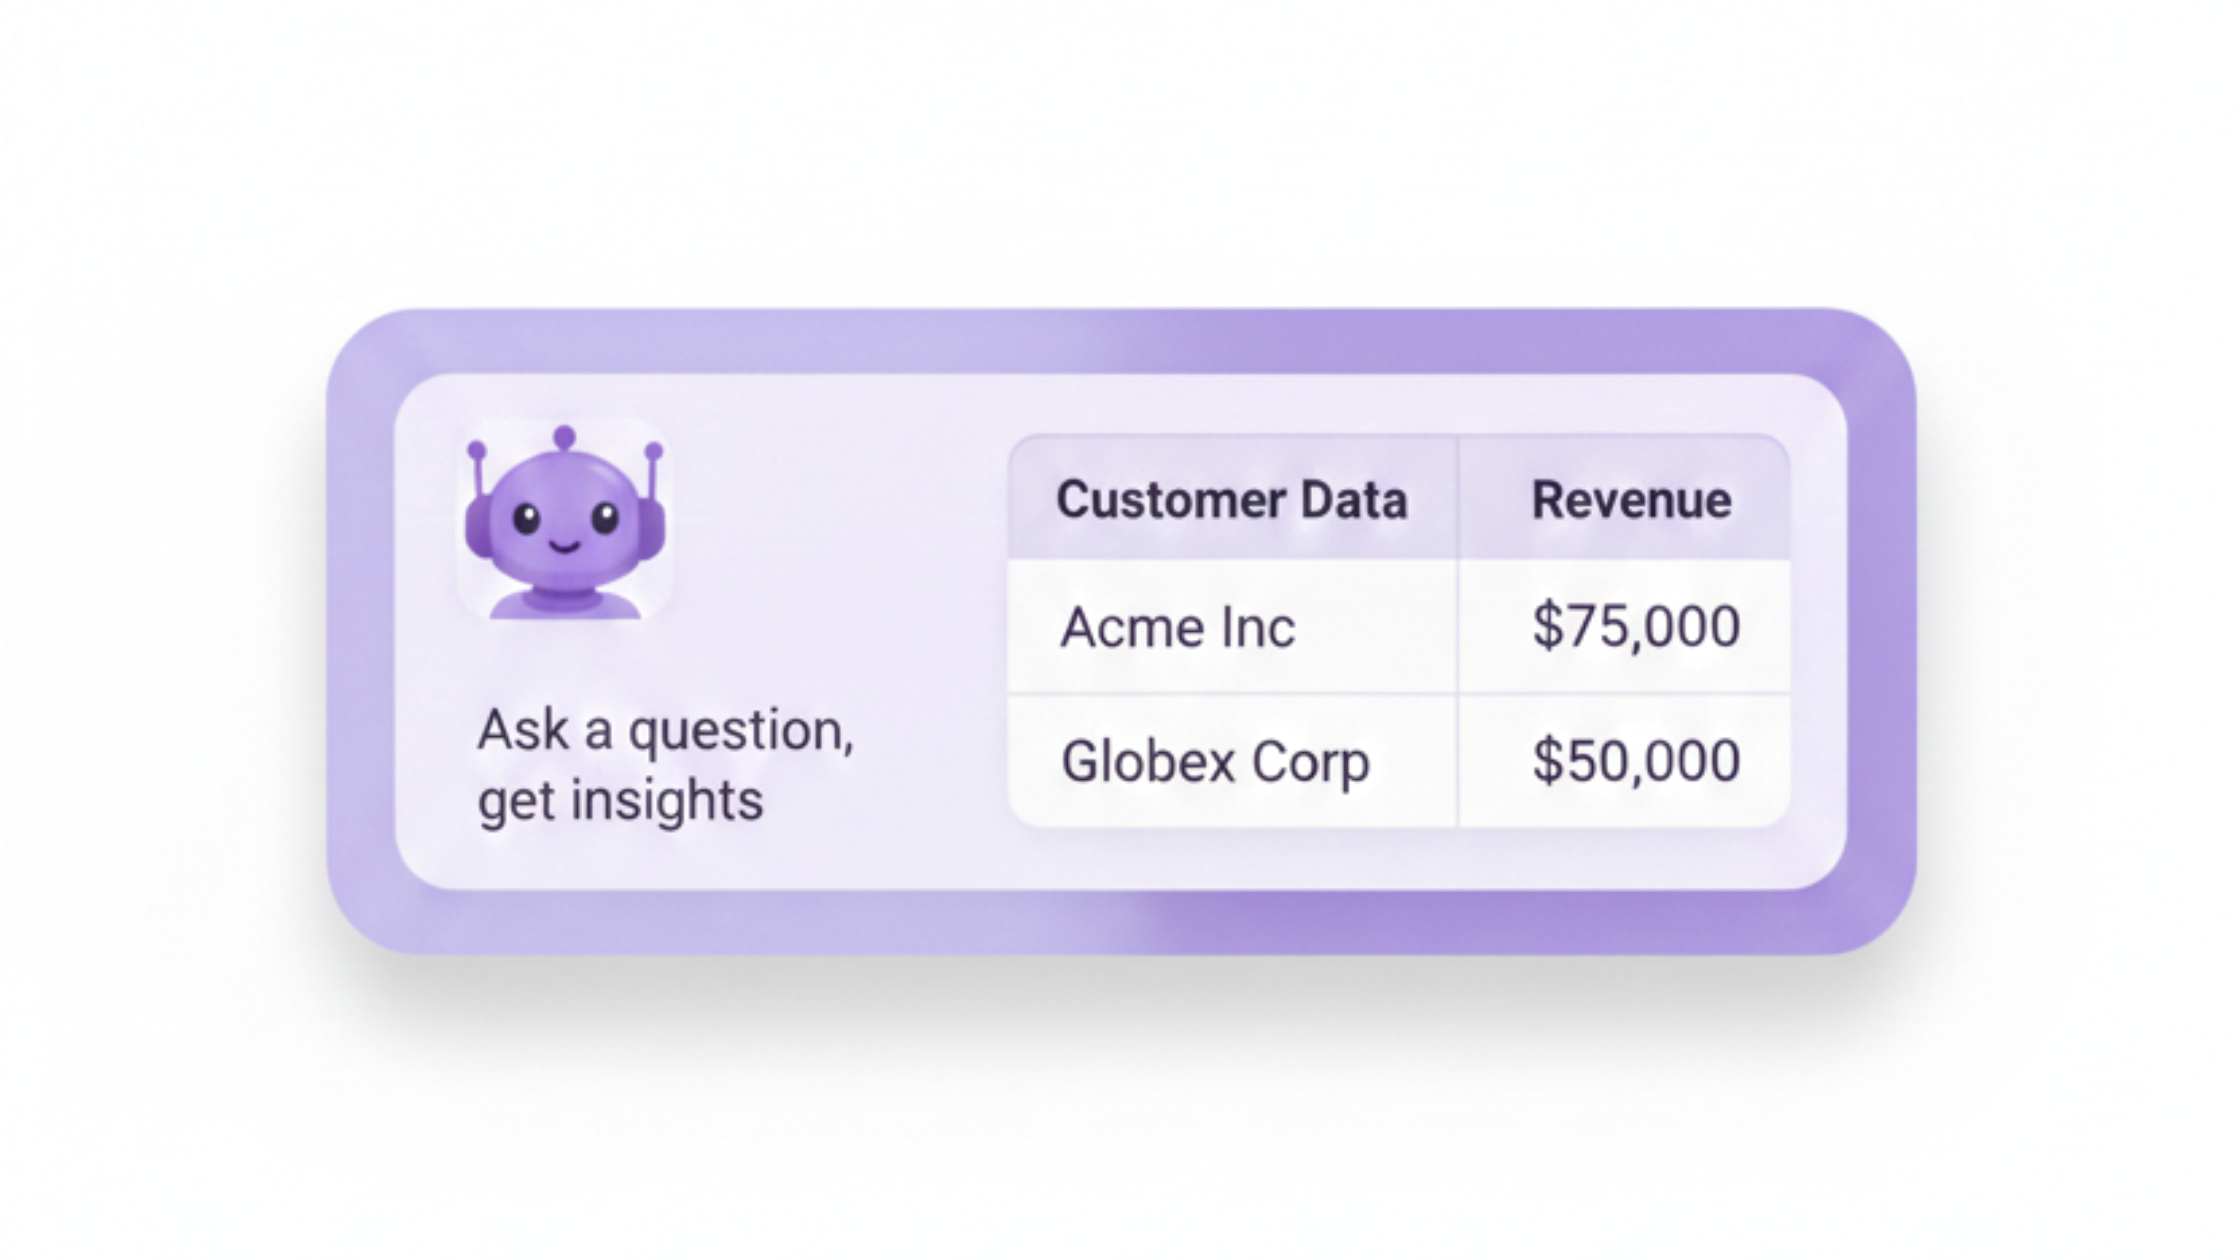
BigCommerce Customer Data and Reporting Made Simple with Chartsy
A BigCommerce store owner struggled to combine business names, billing addresses, and revenue into a single, usable report — until Chartsy turned scattered data into clear, actionable insights.
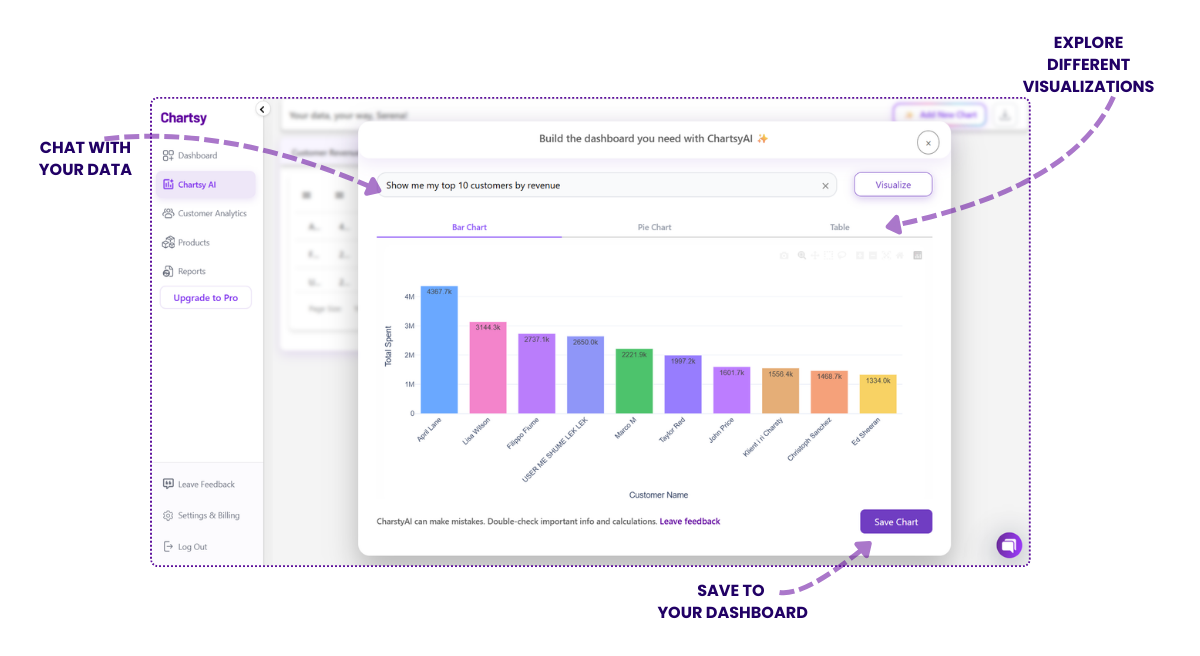
Chartsy vs Glew.io: A Smarter and More Flexible Alternative for BigCommerce Analytics
Choosing the right ecommerce analytics software can directly impact how quickly you make data-driven decisions. Compare AI-powered natural language reporting with Chartsy vs traditional dashboards with Glew.io.
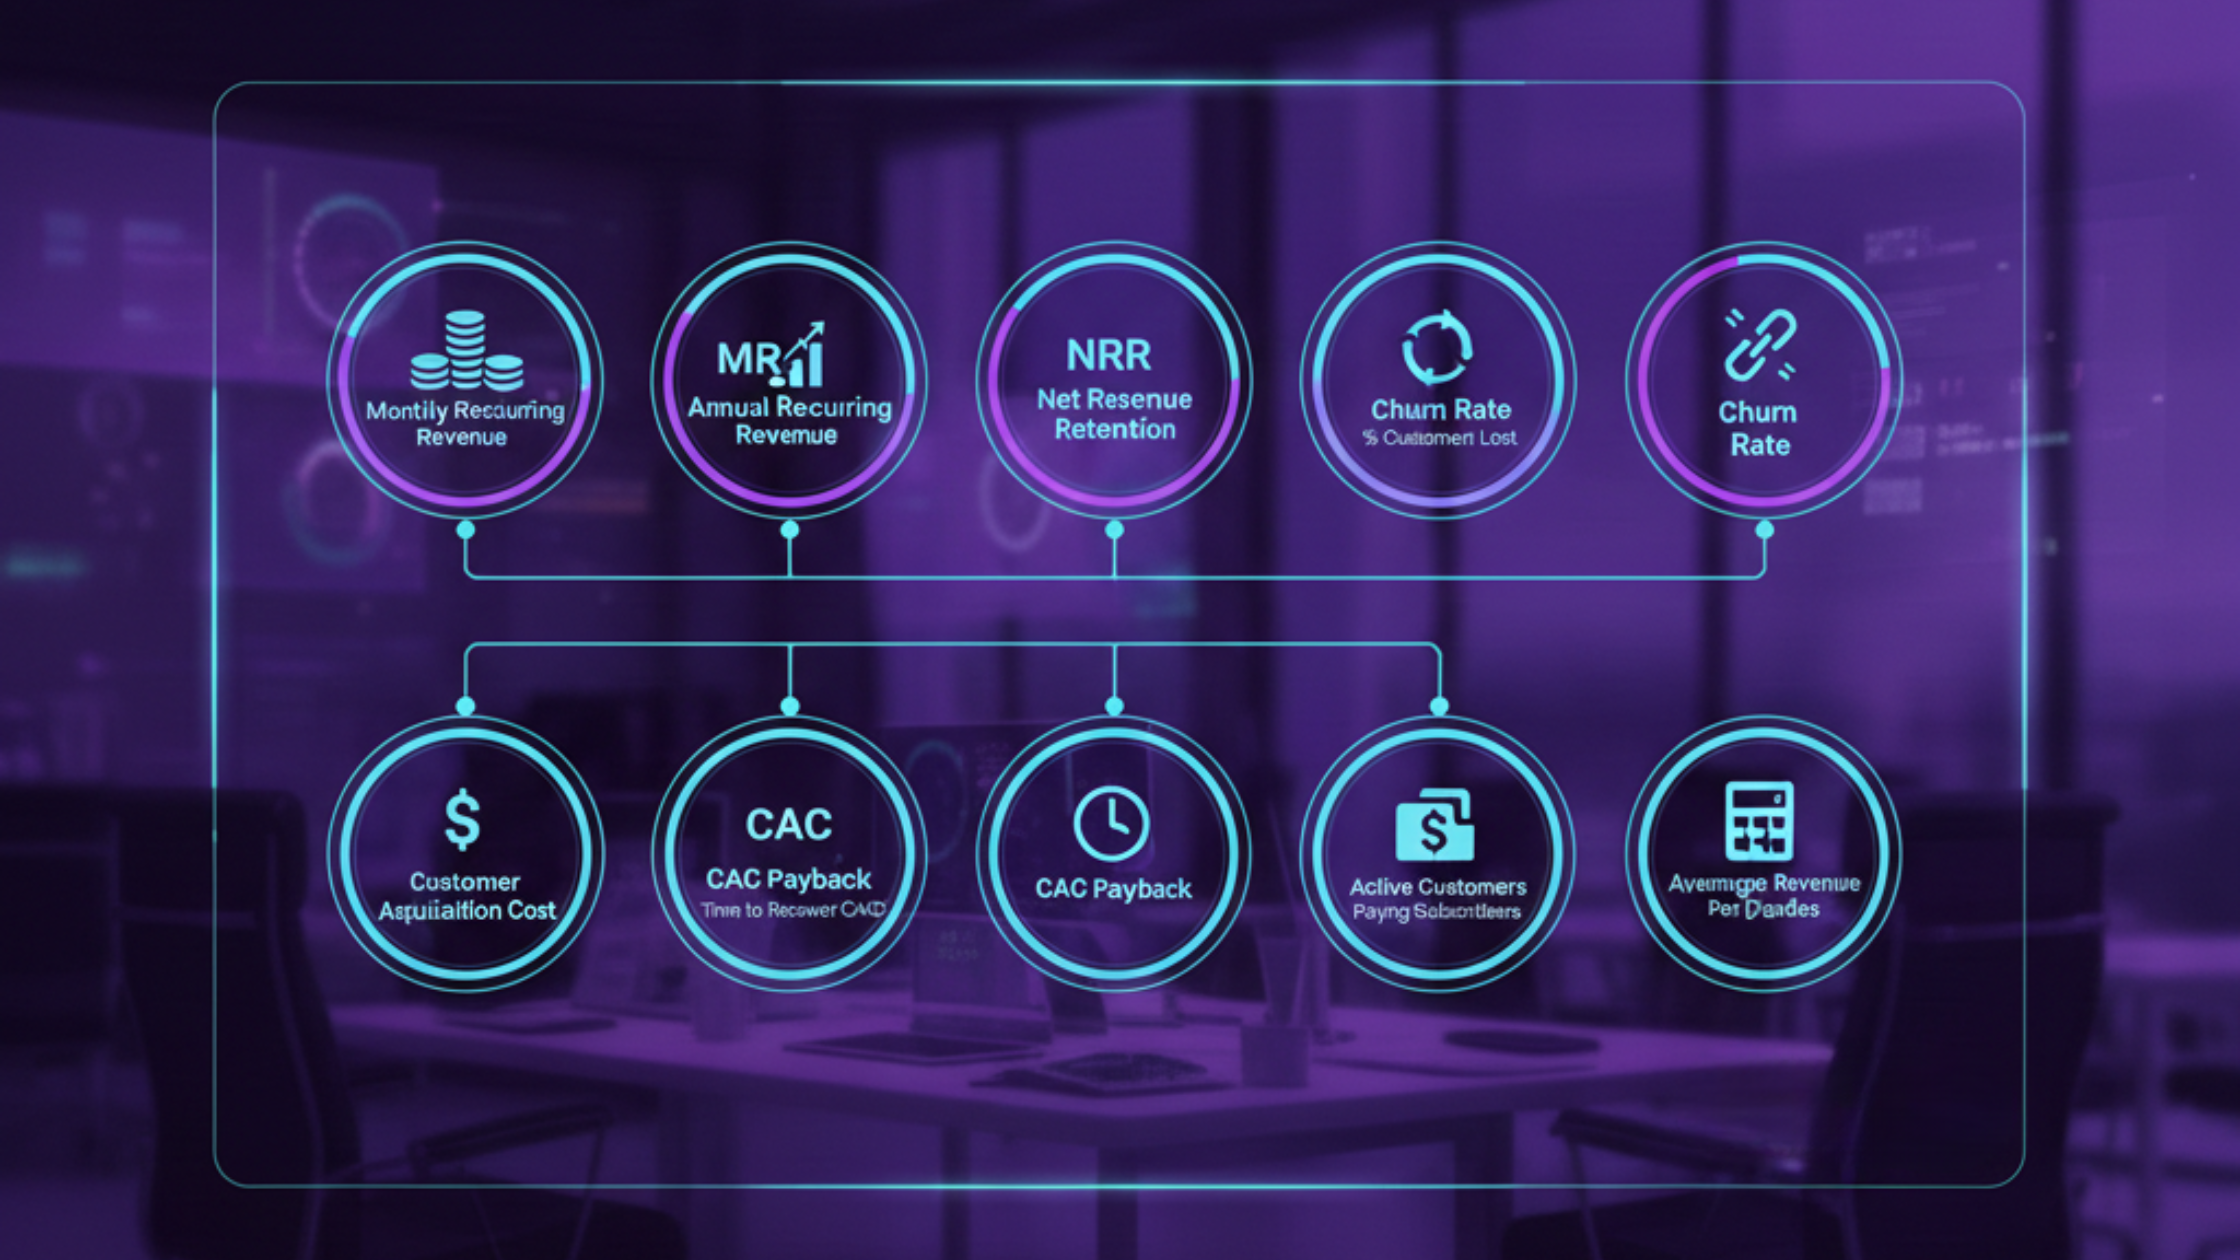
10 Most Important Metrics Every Founder Should Track
Good decisions need good data. Learn the 10 key metrics every founder should track - MRR, ARR, churn, CLV, CAC, and more - and how to interpret them with subscription analytics software.

How We Calculate MRR at Chartsy (and Why It Differs From Stripe)
Chartsy calculates MRR from paid invoices only, applying every discount, proration, and cancellation the moment it happens. That single decision is why your Chartsy MRR will often read lower than Stripe's - and why it's the number worth trusting for forecasts.
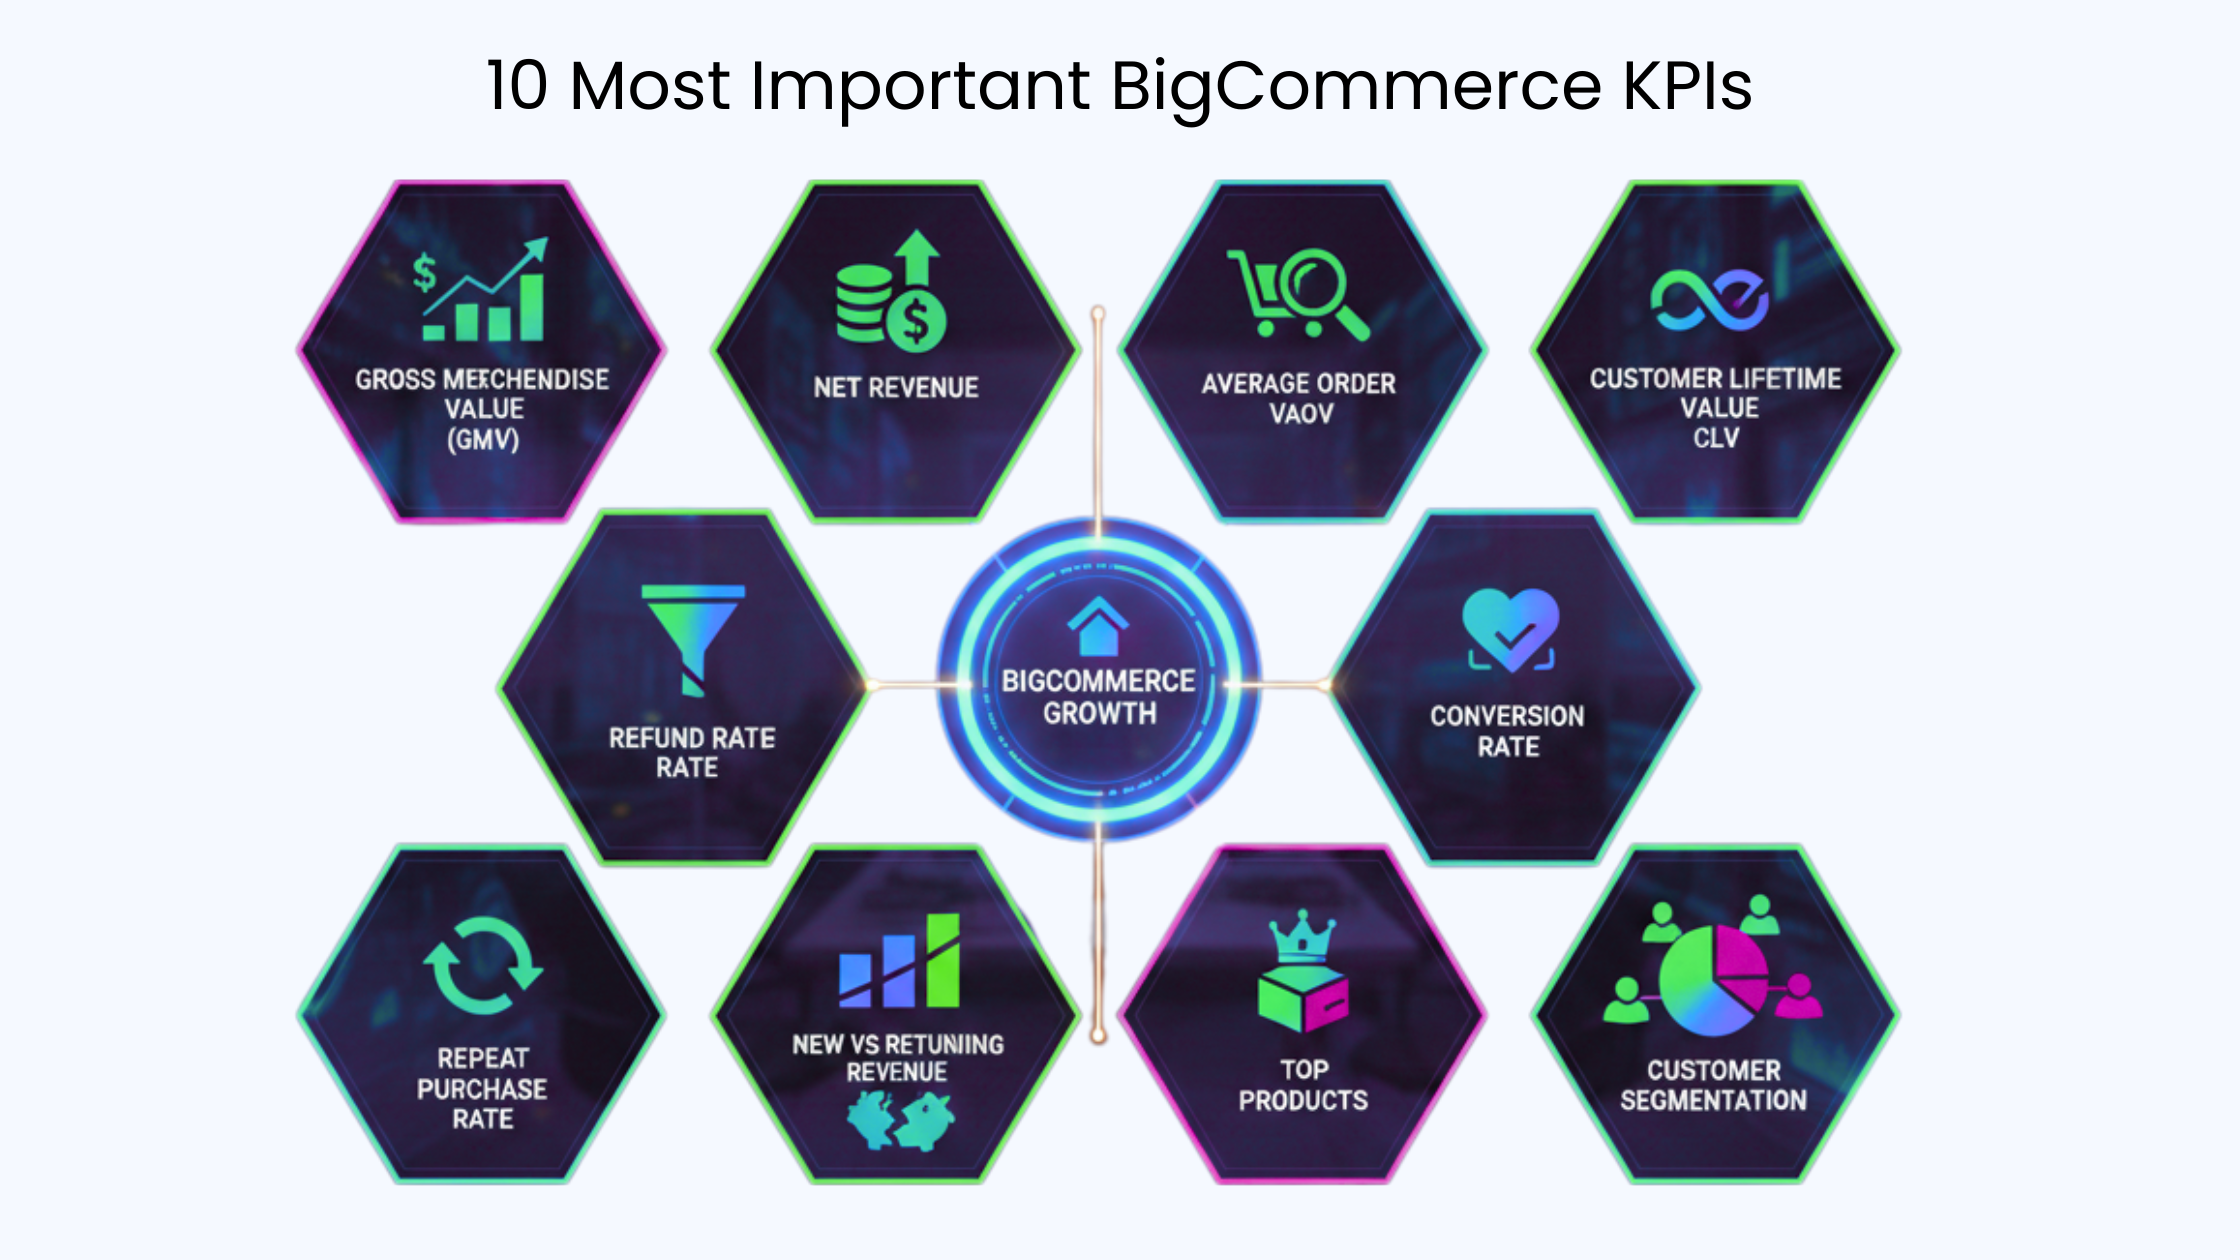
10 Most Important BigCommerce KPIs to Track for eCommerce Growth
Data alone doesn't drive growth. Learn the 10 essential BigCommerce KPIs every store should track - GMV, AOV, conversion rate, CLV, and more - for sustainable eCommerce growth.
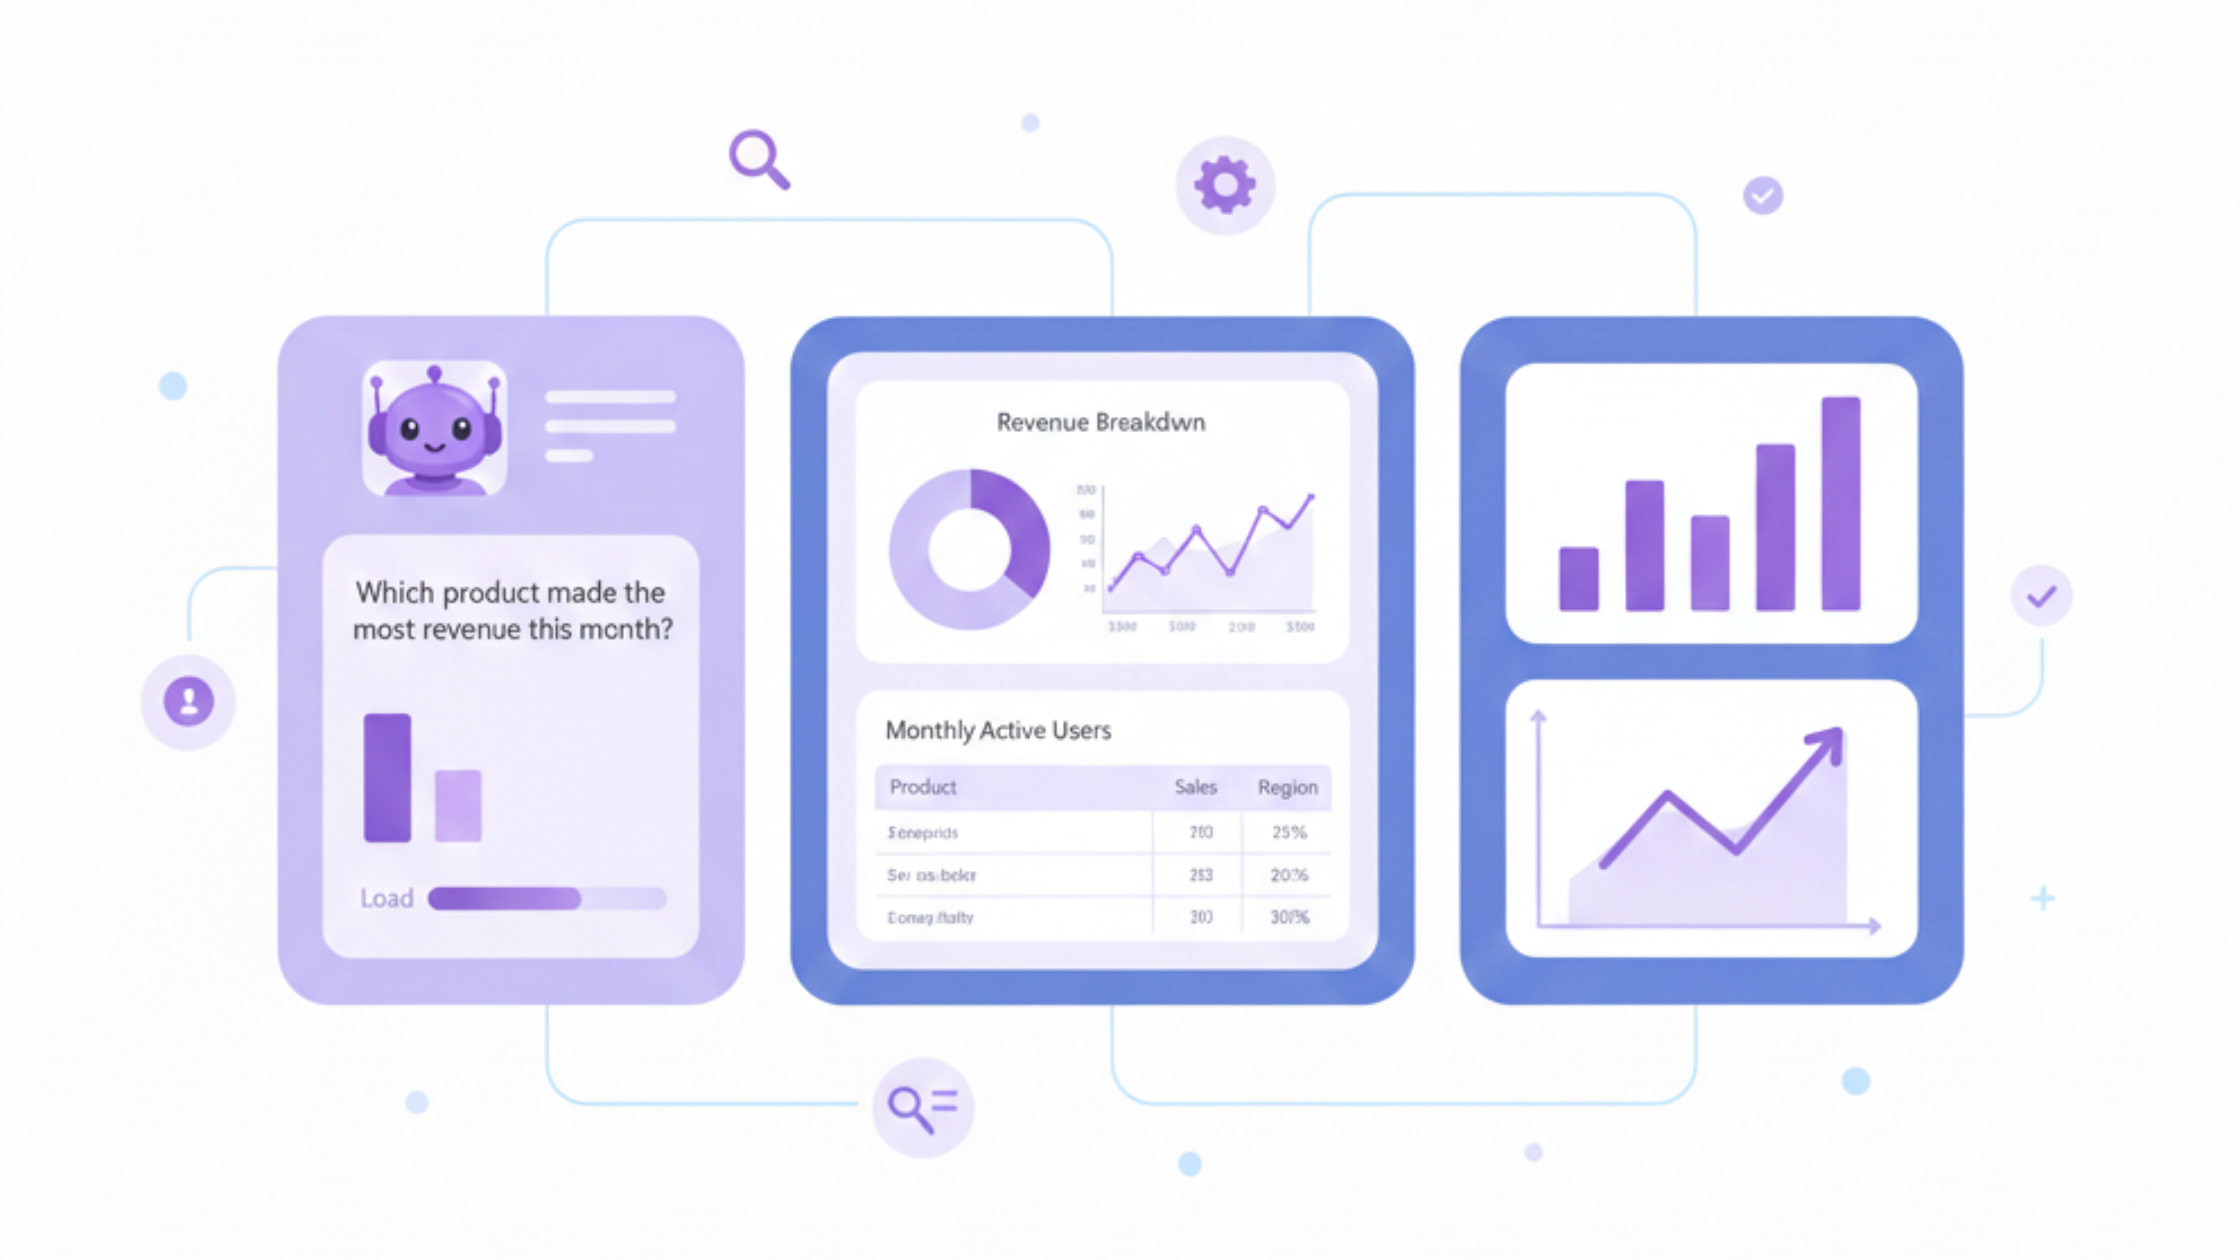
Why Custom Charts Beat Pre-Built Dashboards in BigCommerce Analytics
Pre-built dashboards are fine for quick overviews, but growing BigCommerce stores need flexible, question-driven analytics. Learn why custom charts unlock deeper insights and smarter decisions.

BigCommerce Customer Segmentation: How to Understand Your Customers and Increase Revenue
Learn how to segment your BigCommerce customers using RFM analysis. Identify your best buyers, prevent churn, and increase revenue with actionable strategies and clear charts.
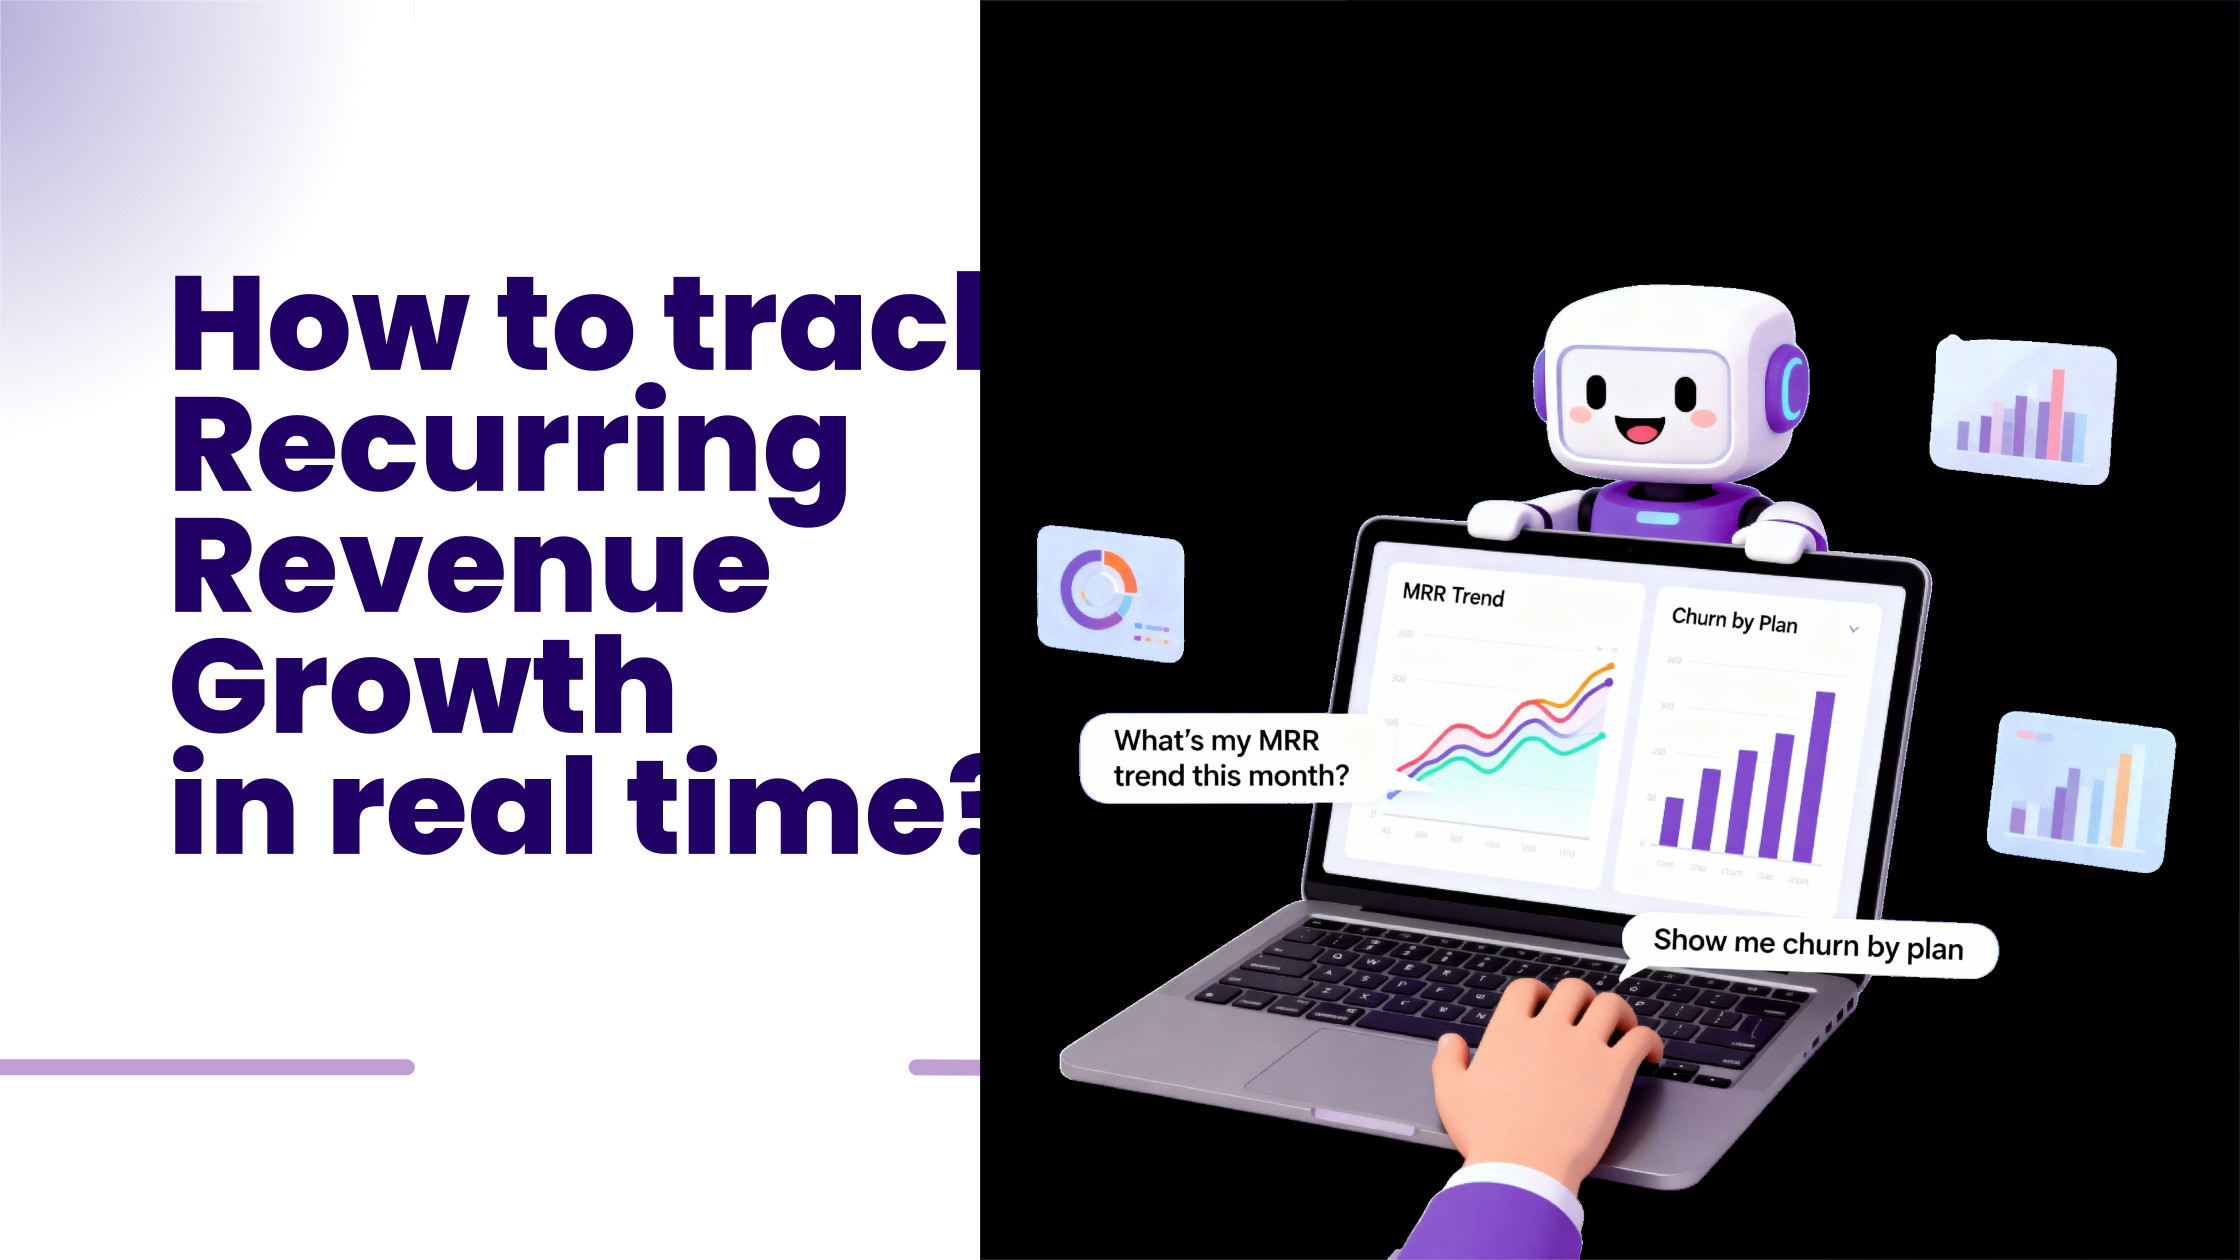
A Clear Path to Understanding SaaS Revenue Performance
Create a Revenue Performance Dashboard that reveals MRR trajectory, top-performing plans, and customer retention trends. Transform your Stripe and Paddle subscription data into actionable insights for your SaaS.
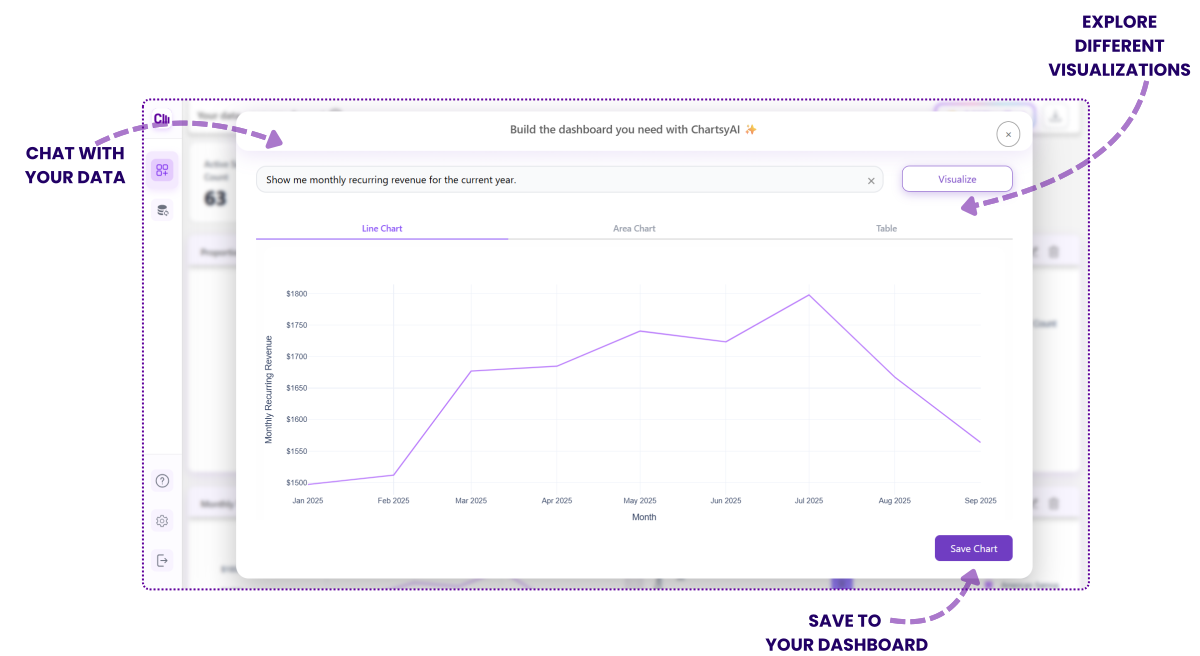
Chartsy vs ProfitWell: The Ask-Anything Alternative
Looking for a ProfitWell Metrics alternative? ProfitWell now lives inside Paddle's dashboard. Chartsy lets you ask any question about your Stripe or Paddle data and get an instant chart — no fixed views.

Why Most SaaS Dashboards Fail and How to Fix Them
Traditional SaaS dashboards overwhelm with generic metrics, leaving founders and operators searching for answers. Chartsy redefines analytics by letting you ask questions in plain English, delivering tailored insights instantly to drive growth.
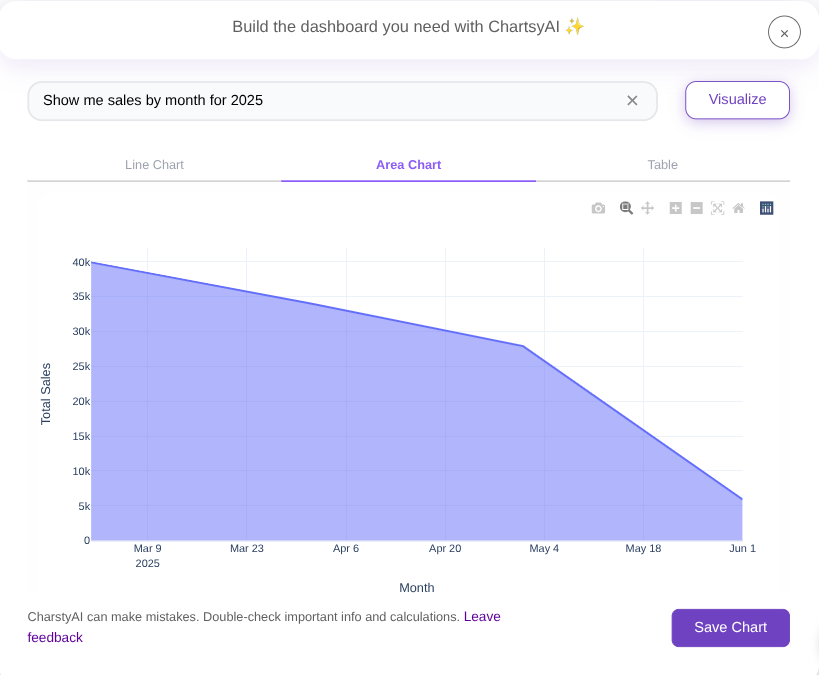
Unlock Your SaaS Growth with Chartsy's Stripe Analytics Dashboard in 2025
Struggling to decode your Stripe data? Manual spreadsheets and complex SQL queries waste time and obscure insights. With Chartsy, you can transform your Stripe subscription, revenue, and customer data into powerful, no-code Stripe visualizations in seconds.

