A rising churn rate tells you that customers are leaving. It doesn't tell you which customers leave first, what revenue you lose, or what caused the decision.
Good customer churn analysis turns that vague warning into a work plan. Follow these steps to define the right metric, clean your subscription data, find the worst segments, and choose a retention action.
Table of Contents
- Step 1: Define Churn and Set the Analysis Goal
- Step 2: Prepare Clean Subscription and Customer Data
- Step 3: Calculate Customer Churn, Revenue Churn, and Retention
- Step 4: Segment Churn by Cohort, Plan, and Customer Behavior
- Step 5: Find the Cause and Choose a Retention Action
- FAQ
- Conclusion
Step 1: Define Churn and Set the Analysis Goal
Start your customer churn analysis by deciding what “churn” means for your business. If your team uses three different definitions, your reports won't agree.
In a subscription business, customer churn usually means a paying customer canceled during a set period. Some teams call this logo churn. That name focuses on the number of customer accounts lost, rather than the money tied to those accounts.
Write down these rules before you pull data:
- Customer unit: Decide whether one customer means one account, one subscription, or one user.
- Churn event: State whether churn happens at cancellation, at the end of the paid term, or after a failed payment.
- Time frame: Pick a month, quarter, or year. Monthly analysis usually gives a faster signal.
- Included customers: Exclude trials if you want paid churn. Include them in a separate trial-conversion review.
- Reactivations: Decide whether a returning customer counts as new business or a reactivated account.
A customer exchanges value for a good or service. For SaaS reporting, the key point is simpler: tie the customer record to a clear subscription event.
Next, choose the question you want to answer. “What is our churn?” is too broad. Better questions include:
- Are new customers leaving before they reach their first useful outcome?
- Did a price change affect one plan more than another?
- Are failed payments being counted as voluntary cancellations?
- Are a few large accounts driving most lost MRR?
By now you should have one written churn definition and one analysis goal. Keep both at the top of the report so nobody changes the rules halfway through.
Step 2: Prepare Clean Subscription and Customer Data
Customer churn analysis is only as good as the subscription records behind it. Before you calculate a rate, check whether your source data can explain each change in customer status.
Start with a row for each subscription event or a daily snapshot of each active subscription. At minimum, keep:
- Customer ID
- Subscription ID
- Plan and billing interval
- Subscription start date
- Cancellation date
- Effective end date
- MRR at the start of the period
- Upgrade, downgrade, and reactivation events
- Trial status
- Payment failure and refund status
Then match those fields to customer context. Useful fields may include signup month, acquisition source, company size, region, plan, coupon code, and product metadata. Don't add fields just because they exist. Add them when they can change the action your team takes.
Watch for common data errors:
- A canceled subscription remains marked active because the paid term has not ended.
- A failed card payment looks like a voluntary cancellation.
- One account has several subscriptions, so one cancellation gets counted as several lost customers.
- A plan migration looks like churn followed by a new sale.
- Refunds reduce cash revenue but don't always mean the customer canceled.
Use one customer ID across billing records, support notes, product events, and survey responses. If your payment system uses a different ID than your product database, build a small crosswalk table. That one step can save hours when someone asks why a high-value account left.
Chartsy connects with Stripe and Paddle, so SaaS teams can work from their subscription data without starting with a manual export. You can also ask questions in plain English when you need to inspect MRR movement or customer segments. Review the source fields first, though. A connected account doesn't fix unclear business rules.
By now you should have a clean customer list, a subscription event log, and a note for every exclusion. Save a copy of the rules with each monthly report.
Step 3: Calculate Customer Churn, Revenue Churn, and Retention
Use more than one metric in customer churn analysis. Customer churn tells you how many accounts left. Revenue churn tells you how much recurring revenue left. Retention shows what stayed. For the formulas behind customer churn, gross revenue churn, and NRR, see What Is Churn Rate? — the table below is about choosing which metric to read for which question, not re-deriving the math.
| Metric | What happened? | Best use | Common mistake |
|---|---|---|---|
| Customer churn | Accounts left | Find customer groups with retention problems | Giving every account equal revenue weight |
| Gross revenue churn | Recurring revenue fell | Measure the financial cost of churn and downgrades | Ignoring contraction from customers who stayed |
| NRR | The starting MRR base changed | Judge expansion against losses | Adding new sales to the result |
| Gross revenue retention | Starting MRR remained after losses | Check the health of the existing base | Counting expansion as retention |
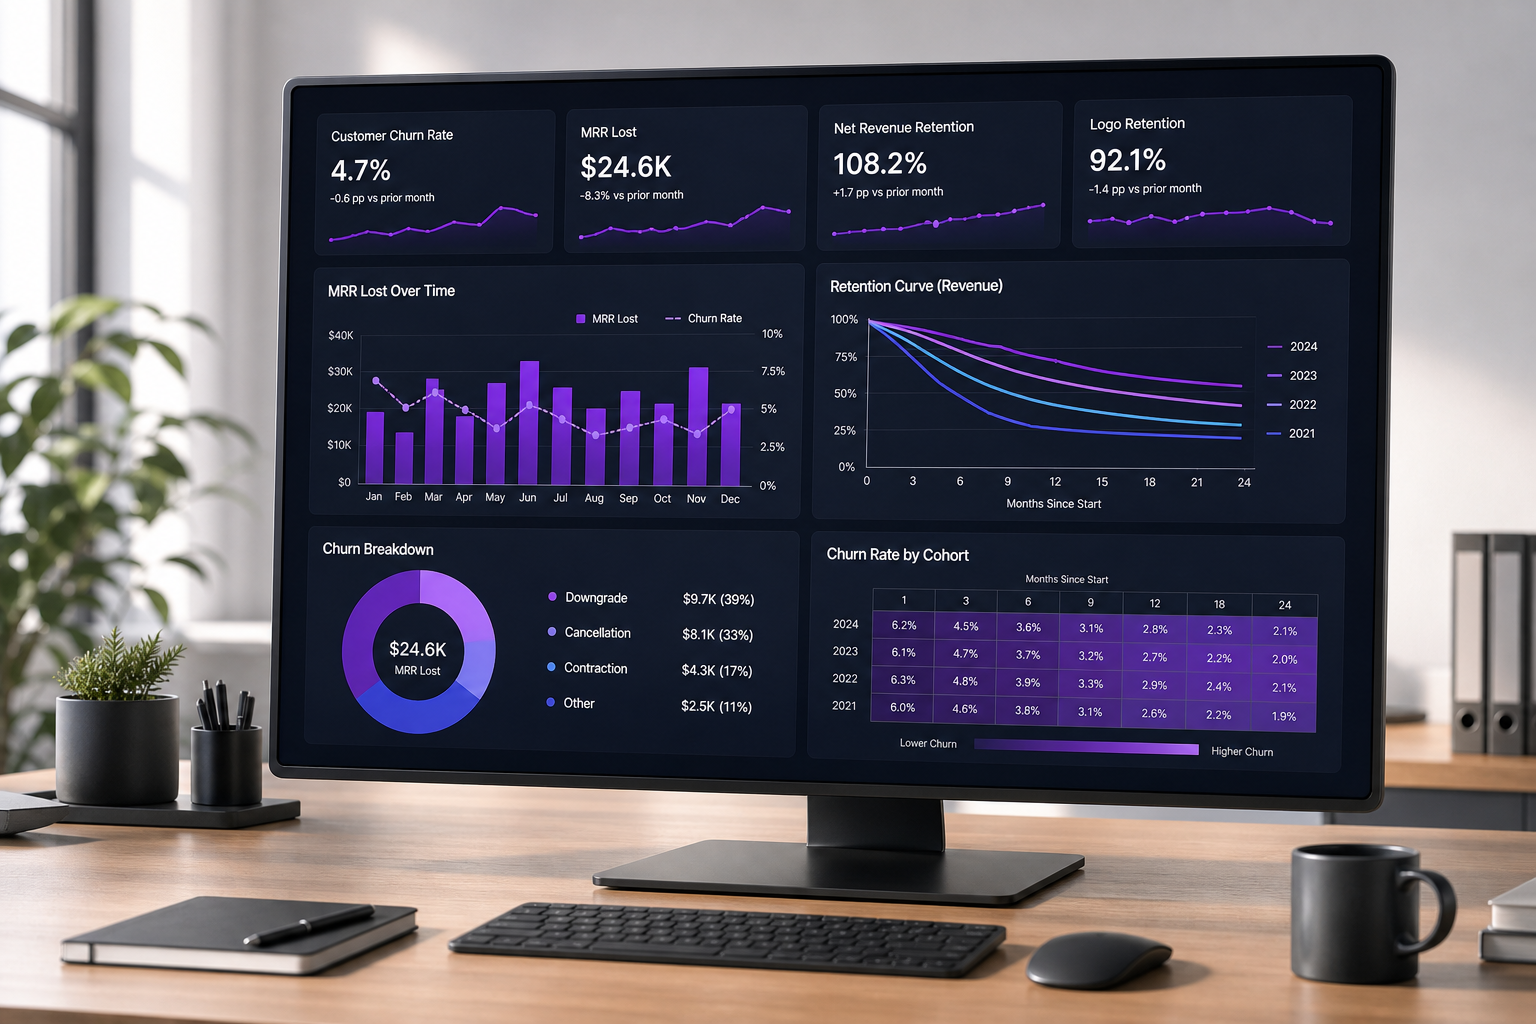 |
Compare customer churn with revenue churn each month. If customer churn is high but revenue churn is low, many small accounts may be leaving. If customer churn is low but revenue churn is high, a few large accounts need attention.
Chartsy can turn Stripe or Paddle data into views for MRR over time, MRR churn rate, plan performance, and customer revenue. That helps when the same question comes up in a weekly finance review and nobody wants to rebuild the calculation by hand.
By now you should have a metric set that shows both customer count and revenue impact. Don't use one rate as the full story.
Step 4: Segment Churn by Cohort, Plan, and Customer Behavior
Segmenting customer churn analysis shows where the problem lives. An overall rate can look stable while one new plan or signup group gets worse.
Start with cohorts
Group customers by signup month, then track each group over the same number of months. A January cohort should be measured after month one, month two, and month three. This lets you compare customer age rather than calendar dates.
A cohort table can reveal several patterns:
- New cohorts churn faster than older cohorts. Check onboarding, acquisition quality, or a recent product change.
- Every cohort drops sharply after the first invoice. Check activation and the first-use experience.
- Older cohorts remain stable, but one calendar month falls across all groups. Check billing, outages, pricing, or policy changes.
For a deeper look at retention curves, use this guide to track SaaS retention by signup month. The main rule is to compare like with like. A three-month-old customer has not had the same chance to churn as a two-year customer.
Then split by plan and customer type
Break the result by plan, billing interval, trial status, company size, acquisition source, and region when those fields are reliable. Start with one cut at a time. If you split by ten fields at once, small groups can produce noisy results that lead to bad calls.
Look at both count and MRR. A basic plan may have the most cancellations, while an enterprise plan may produce the largest revenue loss from one account.
Add behavior signals
Match churned customers to activity before cancellation. Useful signals include a drop in logins, low use of the main feature, unresolved support work, failed payments, and a short time between signup and cancellation.
Don't treat these signals as proof of cause. They are clues. A customer may log in less because the product works well, or because the team has stopped using it. Ask the customer or review account notes before you change the product.
One finding from the reviewed tools is worth keeping in mind: transparency varies. ChartMogul explicitly lists expansion, contraction, and churn support, while several other tools provide less detail about churn types. When you assess a dashboard, ask what each metric includes before you compare results.
By now you should have a ranked list of segments, not one giant average. Pick the segment with enough customers to matter and a pattern your team can act on.
Step 5: Find the Cause and Choose a Retention Action
The final stage of customer churn analysis is turning a pattern into a test. A chart can show what happened. Your team still has to learn why.
Build a short cause list for each high-risk segment:
- Activation: Customers don't reach the first useful outcome.
- Product fit: The product solves a problem the customer no longer has.
- Price: The plan costs more than the value the buyer sees.
- Payment: A failed charge leads to an avoidable loss.
- Support: A key issue stays open too long.
- Contract or policy: Cancellation terms create surprise or friction.
Use evidence from more than one source. Review cancellation reasons beside support tickets. Compare failed-payment events with cancellation dates. Read a sample of customer notes. Then speak with a few churned customers if your privacy rules and consent process allow it.
Keep the interview question plain: “What changed before you decided to cancel?” Avoid asking, “Was the price too high?” That question pushes the person toward one answer.
Choose one action for one segment. For early churn, test a better first-week setup. For payment churn, improve reminders and recovery steps. For a plan with repeated downgrades, review the value gap before offering a discount.
Set a success measure before the test starts. That could be first-month retention, failed-payment recovery, downgrade rate, or retention for the next signup cohort. Keep a control group when you can. Otherwise, a seasonal shift may look like a product win.

Chartsy can help you inspect plan and customer segments from Stripe or Paddle data. Pair that view with customer feedback. Billing data can show the pattern, but it rarely explains the full reason on its own.
Write down the owner, start date, target segment, and review date. If nobody owns the next step, the analysis ends as a report.
FAQ
What is customer churn analysis?
Customer churn analysis is the process of measuring lost customers and finding the reasons behind those losses. A SaaS team reviews cancellation events, revenue changes, customer age, plan type, payment history, and behavior. The goal is to find a segment or cause that supports a specific retention action.
How do you calculate customer churn rate?
Calculate customer churn rate by dividing customers lost during a period by customers at the start of that period, then multiply by 100. For example, losing 10 customers from a starting base of 200 produces a 5% rate. State whether you count cancellations immediately or when the paid term ends.
What is the difference between customer churn and revenue churn?
Customer churn counts the accounts you lost, while revenue churn measures the recurring revenue lost from cancellations or downgrades. The two rates can move in different directions. Many small cancellations may raise customer churn, while one large account can drive much more revenue churn.
How often should a SaaS company analyze churn?
A SaaS company should review churn each month and inspect key signals each week. Monthly data gives you a stable view of customer and revenue loss. Weekly checks can catch failed payments, sudden plan changes, or a new cohort problem before the next monthly review.
What data do you need for churn analysis?
You need customer IDs, subscription dates, plan details, MRR, cancellation events, and payment status for a useful churn analysis. Add signup cohort, customer metadata, product activity, support history, and cancellation feedback when those fields are trustworthy. Clean definitions matter as much as the number of fields.
Conclusion
Start with one clear churn definition, then compare customer loss with MRR loss by cohort and plan. Pick one high-impact segment and test one retention action. If your data lives in Stripe or Paddle, Chartsy can give your team a faster way to inspect those patterns. Set up the first report today, save the rules, and review the result with its owner next month.

Written by
Chartsy TeamAnalytics team at Chartsy
The Chartsy Team writes guides, product updates, and resources to help SaaS and eCommerce founders make sense of their metrics, without SQL or spreadsheets.
Chartsy
