
Picking a subscription analytics tool gets hard once your business has more than one question about revenue. MRR is only the start. You also need to see churn, retention, LTV, failed payments, and the customer groups behind the totals. Here are three strong options, each with a different strength.
Table of Contents
- ProfitWell, A free starting point for early-stage SaaS metrics
- Baremetrics, An all-in-one option for metrics, dunning, and forecasting
- ChartMogul, Deep cohort analysis for SaaS teams scaling past $10K MRR
- FAQ
- Conclusion
1. ProfitWell, A free starting point for early-stage SaaS metrics
ProfitWell is a free subscription metrics product aimed at seed-stage teams and pre-revenue startups. In the profitwell vs baremetrics vs chartmogul discussion, its main draw is simple: early teams can start tracking core SaaS numbers without adding a paid analytics bill.

ProfitWell's dashboard answers the handful of questions a founder asks before there's a finance function to ask them: where recurring revenue stands, how fast customers are leaving, what each one is worth over time, and how those numbers stack up against peer benchmarks.
The free model matters when your business is still testing pricing or searching for product-market fit. You may not know if your next hire should be in sales, support, or product. A clear view of new MRR beside expansion and churn can help show what is actually moving the business.
ProfitWell supports Stripe, Chargebee, Recurly, and Braintree. That gives it wider billing coverage than a Stripe-only product. Paddle’s broader product family also includes ProfitWell Metrics in its billing ecosystem, which may make the setup more natural for teams already using Paddle.
ProfitWell is a good fit when your questions match its built-in views. It becomes less attractive when every weekly review leads to a new question that the default reports cannot answer. Fixed dashboards can keep reporting tidy, but they can also make unusual analysis slow.
There is another tradeoff. ProfitWell's paid offerings add automated dunning on top of the core metrics view, which makes it more useful when failed payments are a key source of lost revenue. But analytics and recovery are different jobs, so decide which problem needs attention first.
For definitions, it helps to keep the metrics clear. Churn rate is commonly defined as the rate at which customers or revenue leave during a set period. A low customer churn rate can still hide serious revenue churn if large accounts cancel.
Pro Tip: Before choosing a free tool, list the five questions you review each month. Make sure the product can answer those questions with your billing data, not just show top-line MRR.
2. Baremetrics, An all-in-one option for metrics, dunning, and forecasting
Baremetrics is an all-in-one SaaS analytics option built around metrics, dunning, cancellation surveys, and forecasting. It suits teams that want a polished reporting system with payment recovery work close by.
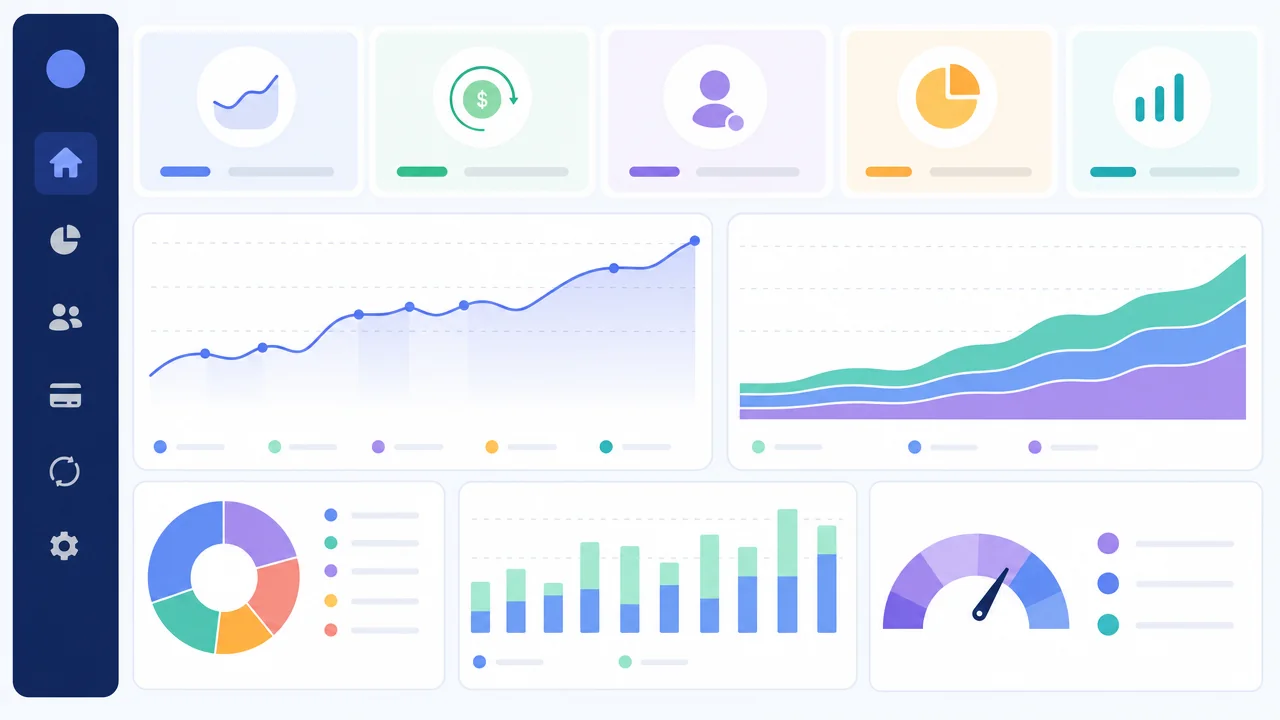
Baremetrics is best for companies that want more than a dashboard. Its revenue reporting covers the standard subscription set - recurring revenue, churn, and lifetime value trends - but the reason teams pick it over a plain metrics tool is what sits next to those numbers: retry logic for failed cards, and an exit survey that records why a customer canceled instead of leaving the loss unexplained.
That combination can reduce the gap between seeing a problem and acting on it. A rise in involuntary churn may point to failed cards rather than poor product value. A cancellation survey may show a pricing issue instead. Those cases need different responses, so keeping the signals near each other can help.
Baremetrics also includes forecasting in its product positioning. Forecasts are useful when they are treated as planning tools, not promises. If expansion revenue falls while customer churn stays flat, a forecast should reflect that weaker revenue quality. The next move may be a pricing review or a customer success plan.
The cost decision still matters for a small SaaS team. A paid analytics product can be worth it when recovery or forecasting saves staff time, but the business should tie the spend to a clear operating need.
Its main limit is the query model. Baremetrics centers on designed dashboards and add-on workflows rather than open-ended, ask-anything queries. That works well for teams that lean on repeatable reports, and less well for teams whose questions change week to week.
LTV also needs care. Customer lifetime value is an estimate of the value a customer brings over the relationship, not a guaranteed future payment. Treat it as a guide for pricing and acquisition decisions, then test the result against actual retention.
3. ChartMogul, Deep cohort analysis for SaaS teams scaling past $10K MRR
ChartMogul is a subscription analytics tool for startups that plan to scale past $10K MRR quickly. In this comparison, it stands out for deep cohort analysis and segmentation across plan, geography, and acquisition data.

ChartMogul is best for teams that need to study retention over time. A top-line churn number tells you what happened this month. Cohort analysis can show whether customers who joined during one period retain better than customers from another period.
That difference matters when you change pricing, launch a new plan, or shift acquisition channels. Suppose new customers grow while the latest signup cohort retains poorly. The problem may sit in onboarding or customer fit, not in the total market demand.
ChartMogul covers MRR, ARR, subscriber counts, and MRR movements. Its segmentation depth suits finance and revenue teams that need repeatable reporting.
| Decision area | ProfitWell | Baremetrics | ChartMogul |
|---|---|---|---|
| Best fit | Early-stage teams that need free metrics | Metrics plus dunning and forecasting | Teams focused on cohorts and scale |
| Free tier | Free | No free tier | Free up to $10K MRR |
| Processor coverage | Stripe, Chargebee, Recurly, Braintree | Stripe, Recurly, Chargebee, Braintree, Apple App Store | Multi-source focus |
| Open-ended questions | Built-in views | Designed dashboards | Preset reports and segmentation |
| Automation focus | Dunning through paid offerings | Retry sequences and messaging | Webhook-based alerts |
The free-tier picture is worth watching. ProfitWell is free, Baremetrics has no free tier, and ChartMogul defines a free limit up to $10K MRR. Those models can change the cost of growth. A tool that looks cheap at launch may become more expensive as revenue rises if pricing follows MRR or ARR.
ChartMogul’s limitation is flexibility outside its reporting model. It is a strong choice when cohort depth and multi-source data are the priority. It is less suited to founders who want a lightweight, plain-English way to ask a new question without learning the report structure first.
FAQ
What is the best tool in profitwell vs baremetrics vs chartmogul?
ProfitWell is a strong free starting point for early-stage teams. Baremetrics suits teams that want metrics beside dunning and forecasting. ChartMogul fits companies that need deep cohort analysis or broader billing-source coverage. The right pick depends on whether your main gap is cost, recovery automation, or cohort depth.
Is ProfitWell still free?
It covers core metrics such as MRR, churn, LTV, ARPU, and benchmarks. Check the current product terms before you commit, especially if you need paid automation or features tied to Paddle’s billing ecosystem.
Which tool is best for churn analysis?
ChartMogul is the strongest choice here for deep cohort-based churn analysis. Baremetrics is better when you also want cancellation surveys and payment recovery workflows alongside the churn numbers.
Which SaaS analytics tool has the best integrations?
ChartMogul, Baremetrics, and ProfitWell each list a different processor coverage footprint. Compare their current integration lists directly against your billing stack, since support for a specific processor is often the deciding factor.
Should a startup choose a free analytics tool?
A free analytics tool is a sensible starting point when cash is tight and your reporting needs are basic. But free is not always cheaper if the team spends hours exporting data or building spreadsheets. Write down the questions you need answered, then compare the time cost with the product cost.
Conclusion
Choose ProfitWell for a free starting point, Baremetrics for recovery and forecasting workflows, or ChartMogul for deep cohorts and multi-source reporting. Next, connect your billing data to the top match and test your five most important monthly questions.

Written by
Serena PriftiFounder of Chartsy
Serena Prifti is the founder of Chartsy and writes about analytics, growth, and subscription metrics. She focuses on helping founders and operators turn raw data into clear insights that drive better decisions.
Serena Prifti
