
Revenue can grow while your customer base quietly leaks money through cancellations, downgrades, and failed payments. The right tool makes that leak visible by tying churn to MRR, customer segments, and cohorts. Here are the best revenue churn calculation tools, with a clear fit and tradeoff for each.
Table of Contents
- 1. Chartsy: Fast churn analysis from Stripe and Paddle data
- 2. Subscription Metrics Platforms: Straightforward subscription metrics for founder-led SaaS
- 3. MRR Movement and Cohort Analysis Tools: Detailed MRR movements and cohort-based churn analysis
- 4. Retention and Monetization Analytics Tools: Retention and monetization analysis for subscription teams
- 5. Spreadsheet Calculation: Flexible spreadsheet calculation for small SaaS teams
- 6. Billing-Native Reporting: Billing-native reporting for subscription-based businesses
- 7. Merchant-of-Record Billing Reporting: Revenue churn tracking for SaaS businesses using a merchant-of-record billing system
- 8. Recurly: Subscription reporting for teams managing recurring billing at scale
- 9. B2B Subscription Revenue Operations Reporting: Revenue operations reporting for B2B subscription businesses
- 10. Custom SQL and Data Warehouse Reporting: Maximum control over churn definitions
- Compare the Best Revenue Churn Calculation Tools
- Revenue Churn Calculation FAQ
- Conclusion
1. Chartsy: Fast churn analysis from Stripe and Paddle data
Chartsy connects to your Stripe or Paddle account and calculates gross and net revenue churn automatically, so you're not maintaining a spreadsheet formula every time a plan or billing rule changes.
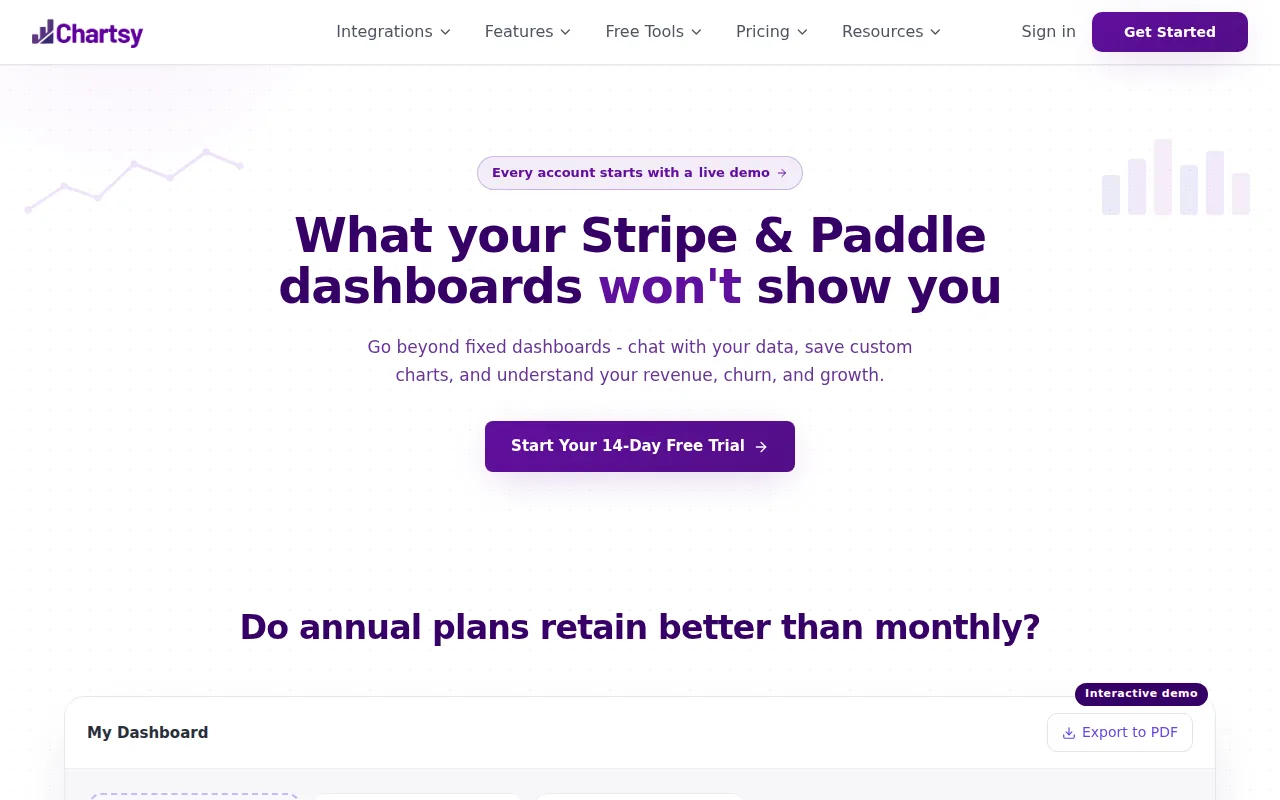
Chartsy is best for founders and lean teams that need a quick view of gross MRR churn, expansion, contraction, and NRR. You can ask questions about churn by plan, customer segment, or time period instead of starting with a blank spreadsheet. That makes it useful during a weekly revenue review, when the team needs to know what changed and where to look next.
It can also help separate new MRR from churned MRR. That distinction matters because a business may add customers while losing too much recurring revenue from existing accounts. The main caveat is simple: Chartsy works best when your Stripe or Paddle data is clean and your subscription events have consistent labels.
2. Subscription metrics tools: Straightforward metrics for founder-led SaaS
A subscription metrics tool built around recurring revenue reporting can fit founder-led SaaS companies that want a familiar dashboard for MRR, churn, customer value, and related subscription measures.
For revenue churn calculation, the appeal is focus. A founder can review whether lost MRR came from full cancellations or smaller downgrades, then compare that result with customer churn. That helps answer a useful question: are many small accounts leaving, or did one large account move the number?
A tool like this is most useful when the same definitions stay in place each month. Revenue churn should use MRR at the start of the period as its base, not ending MRR. Churn is the rate at which customers stop using a service, which is why the time period must always be stated.
The tradeoff is that a focused metrics product may not match a company with unusual billing rules, many data sources, or complex account hierarchies. Check how it handles refunds, annual contracts, trials, and reactivations before making it your main report.
3. Subscription analytics tools: Detailed MRR movements and cohort-based churn analysis
Subscription analytics tools are known for detailed MRR movement reporting. They are a strong fit for SaaS teams that need cohort analysis and want to study how customer groups behave after signup.
Cohorts reveal patterns that a single churn rate hides. For example, customers who joined after a pricing change may cancel sooner than older customers. A cohort view can also show whether annual customers retain more revenue than monthly customers, though the result still depends on your customer mix.
Subscription analytics tools make sense when finance, customer success, and growth teams need one shared view of recurring revenue. The team can trace a change in MRR to new sales, expansion, contraction, reactivation, or cancellation. That is more useful than watching one percentage move up or down.
The caveat is setup. Detailed movement analysis depends on clean event history and agreed rules for pauses, refunds, plan swaps, and free-to-paid conversions. If your team only needs a monthly churn figure, this level of detail may be more than you need.
4. Subscription analytics platforms: Retention and monetization analysis for subscription teams
Subscription analytics platforms are aimed at teams that want to connect retention with monetization. They suit companies that look at churn beside pricing, customer value, and expansion behavior.
Revenue churn is easier to interpret when you pair it with NRR. Gross revenue churn counts lost recurring revenue from cancellations and contractions. NRR starts with the existing customer base, then adds expansion and subtracts contraction and churn. If expansion is larger than the losses, NRR can rise even while some customers leave.
This makes a monetization-focused view useful for a land-and-expand motion. A team can ask which customer groups expand after adoption, then build onboarding and account plans around those groups. Selling more seats to a customer who already gets value can also reduce reliance on new acquisition.
These tools may be less suitable if you want a very custom data model or need plain-English questions across several billing accounts. Confirm how their definitions match your finance team's rules before using their figures in board reports.
5. Spreadsheet calculation: Flexible revenue churn tracking for small SaaS teams
A spreadsheet is a practical low-cost starting point when your SaaS has modest data volume and one person owns the report. It gives you full control over the revenue churn calculation, which is useful while your metric definitions are still changing. For the gross and net MRR churn formulas themselves, see What Is Churn Rate? — this section is about the spreadsheet mechanics, not the math.
Start with one row per customer and columns for starting MRR, ending MRR, churned MRR, contraction MRR, expansion MRR, and customer status. Build an MRR bridge alongside it, since a bridge that doesn't reconcile starting MRR with ending MRR is usually a sign one of the formula columns is wrong.
A spreadsheet also works well for a pivot table. Group rows by signup month, plan, or customer size. Then compare churn across those groups. Keep one tab for raw billing data and another for calculated fields, so a formula change does not overwrite the source.
The weakness is maintenance. Manual exports can miss failed payments, reactivations, or mid-cycle plan changes. Once several people depend on the report, an analytics tool will usually reduce disputes over which number is correct.
6. Billing-native reporting for Stripe-based subscriptions
A billing-native reporting setup is a natural choice for SaaS businesses that already run subscriptions through a single billing system. It keeps billing events close to the source, which can help teams trace a cancellation or failed renewal back to the original account record.
A broader billing platform can support many currencies and payment methods. Those details matter for teams whose churn reports need to account for international billing or payment method changes.
A billing-native setup is useful for separating voluntary churn from involuntary churn. A customer who clicks cancel belongs in one group. A customer lost after repeated payment failure belongs in another. The recovery action differs, so combining both types into one line can hide an avoidable problem.
A billing-native setup is less attractive if your business also uses Paddle or several other subscription systems. You may need a separate reporting layer to compare all revenue in one place. For a single-system business, though, it is a sensible foundation for event-level reporting.
7. Billing systems: Revenue churn tracking for SaaS businesses
A billing system can fit SaaS businesses that already use a billing and merchant-of-record system. The main reason to choose this approach is proximity to the subscription records that drive your revenue reports.
That setup can help teams track cancellations, renewals, plan changes, and payment problems within the same billing environment. For churn analysis, start by deciding whether your report uses billed revenue, recognized revenue, or normalized MRR. Those measures answer different finance questions.
A billing system is a good starting point for a business that wants billing data first and deeper analysis later. You can export the records into a spreadsheet, warehouse, or analytics layer when you need cohort cuts or custom customer segments.
The limitation is scope. A billing system may tell you what happened to a subscription, but it may not explain why the customer left. Add product usage, support history, survey responses, or account notes if you want root-cause analysis rather than a cancellation count.
8. Recurly: Subscription reporting for teams managing recurring billing at scale
Recurly is a recurring billing platform for teams that need subscription reporting alongside their billing operations. It suits businesses with a larger volume of recurring transactions and more formal revenue processes.

For a revenue churn calculation, the key benefit of a billing-centered system is event detail. You can distinguish a full cancellation from a downgrade, then check whether a payment failure caused the loss. That supports a better MRR bridge and gives customer success a clearer list of accounts to review.
Recurly may also fit teams that need repeatable reporting across many plans. Set the rules once, document them, and use the same period cutoffs each month. Annual subscriptions need special care because annual churn and monthly churn are not directly comparable.
The caveat is that scale often brings process work. Finance and customer success must agree on how to treat pauses, refunds, trials, and reactivated accounts. A good billing record cannot fix unclear metric definitions.
9. B2B subscription revenue operations tools
B2B subscription revenue operations tools are designed for businesses with needs beyond a simple monthly dashboard. They can fit teams that need recurring revenue reporting to support finance, sales, and customer success planning.
B2B companies often have different contract terms, billing schedules, and account sizes. In that setting, logo churn can look healthy while revenue churn rises because one large account left. A revenue view puts the financial weight of each account into the analysis.
These tools are worth considering when you need reporting that connects recurring revenue with operational planning. Use them to examine churn by contract type, account size, or sales channel, then compare those findings with CAC and LTV. A high churn rate can shorten customer lifetime and make an acquisition channel look better than it really is.
They may be more system than a small self-serve SaaS needs. If your team has no finance process for reviewing contract data, start with a smaller model and add complexity only when the business requires it.
10. Custom SQL and Data Warehouse Reporting: Maximum control over churn definitions
Custom SQL and data warehouse reporting is the right option when your business needs full control over the revenue churn calculation. It works best for teams with data engineering support and several systems that must be joined.
You can build an MRR bridge that starts with opening MRR, then adds new, expansion, and reactivation MRR. Subtract contraction and churned MRR to reach ending MRR. That structure makes it easier to spot a broken join or a missing event because the bridge should reconcile.
SQL also lets you compare monthly and annual churn without hiding the time period. For a simple average-lifetime estimate, divide one by the churn rate. A 5% monthly churn rate implies 20 months under that basic model. It is a rough view, not a promise, because real customers do not all behave the same way.
The cost is ownership. Someone must maintain the model when pricing, billing events, or account structures change. Put metric definitions in writing and test the report against known customer records before executives rely on it.
Compare the Best Revenue Churn Calculation Tools
The best choice depends on where your data lives and how much control you need. Use this comparison to narrow the shortlist before testing a tool with your own billing records.
| Option | Best fit | Main strength | Main limitation |
|---|---|---|---|
| Chartsy | Lean SaaS teams | Plain-English analysis across Stripe and Paddle data | Depends on clean source data |
| Subscription metrics tools | Founder-led SaaS | Focused subscription metrics | May not fit unusual data models |
| MRR movement analytics tools | Cohort-heavy analysis | Detailed MRR movements | Needs careful event setup |
| Retention and pricing analytics tools | Retention and pricing teams | Links churn with monetization | May be more than a small team needs |
| Spreadsheet models | Small teams | Full formula control | Manual upkeep |
| Billing-platform tools | Single-platform SaaS | Billing-native subscription records | Less useful across mixed billing systems |
| Merchant-of-record billing platforms | Merchant-of-record SaaS | Close to billing events | Needs extra data for root-cause analysis |
| Recurly | Recurring billing teams | Subscription event reporting | Definitions still need internal agreement |
| Revenue operations platforms | B2B subscription operations | Revenue reporting for complex accounts | Can be too much for early-stage SaaS |
| Custom SQL | Data-mature companies | Maximum control | Requires ongoing technical ownership |
Key Takeaway: Pick the option that preserves the detail behind each churn event, not just the one that displays the cleanest percentage.
Revenue Churn Calculation FAQ
What is revenue churn?
Revenue churn is the recurring revenue lost from existing customers during a set period. It usually includes MRR lost through full cancellations and downgrades. Divide lost MRR by MRR at the start of the period, then multiply by 100. Always state whether the result is monthly or annual.
How do you calculate gross revenue churn?
Gross revenue churn equals churned MRR plus contraction MRR, divided by starting MRR, multiplied by 100. It excludes new sales and expansion revenue. This shows how much existing recurring revenue disappeared before upsells or reactivations offset the loss.
What is the difference between revenue churn and NRR?
Revenue churn measures lost recurring revenue, while NRR measures the full change in an existing customer base. NRR includes expansion and subtracts contraction and churn. A company can have revenue churn while still posting NRR above 100% if expansion from retained customers is larger than the loss.
Should failed payments count as churn?
Failed payments should be tracked as involuntary churn when the subscription ends because payment was not recovered. Keep it separate from voluntary cancellations. That split tells the team what action to take next: improve payment recovery for involuntary churn, or address product value and customer fit for voluntary churn.
Why is my churn rate different from my revenue churn rate?
Customer churn counts lost accounts, while revenue churn counts lost recurring dollars. The two figures differ when customers pay different amounts. Losing one large B2B account may produce low customer churn but high revenue churn, while many small accounts can do the opposite.
How often should a SaaS company track revenue churn?
Most SaaS teams should review revenue churn monthly and study trends over several periods. A monthly report catches recent changes, while cohort and annual views reduce the risk of reacting to one unusual month. Pair the rate with an MRR bridge so the team can see what caused the movement.
Conclusion
For most lean SaaS teams, Chartsy is the best place to start because it turns Stripe and Paddle subscription data into fast churn analysis without a heavy reporting project. Connect your billing source, define gross and net churn once, then review an MRR bridge by plan and cohort each month. If you need a deeper refresher on the metric itself, usethis guide to churn rate and its formulasnext.

Written by
Chartsy TeamAnalytics team at Chartsy
The Chartsy Team writes guides, product updates, and resources to help SaaS and eCommerce founders make sense of their metrics, without SQL or spreadsheets.
Chartsy
