
Net revenue retention equals (starting cohort MRR + expansion − contraction − churn) ÷ starting cohort MRR × 100. An NRR of 100% means the existing cohort's recurring revenue is unchanged at period end, and an NRR above 100% means it grew without counting new customers.
You're about to send the board a slide that says recurring revenue is up. Someone will ask how much of that came from people who were already paying on day one. That is the question net revenue retention is built to answer, and one percentage can still describe two opposite businesses.
Say the quarter added a stack of new logos while three older accounts downgraded and one cancelled. Total MRR looks fine. The customers you started with did not. Founders and finance leads who stop at the headline treat those situations as the same result. They are not. The useful read is the cohort boundary, then the split between expansion, contraction, and churn.
Table of Contents
- Net Revenue Retention Formula With a Worked Example
- What NRR Measures and Why It Ignores New Customers
- Which Revenue Movements Count Toward NRR
- Reading NRR Above, At and Below 100%
- Why Companies With the Same NRR Carry Different Risk
- NRR Benchmarks by Company Segment
- Mistakes That Make NRR Comparisons Misleading
- Start Tracking NRR by Segment Each Month
Net Revenue Retention Formula With a Worked Example
NRR = (starting cohort MRR + expansion − contraction − churn) ÷ starting cohort MRR × 100.
Every input has to come from the same customers and the same window. Mix in a new logo, or pull starting MRR from a month-end export, and the percentage answers a different question than the one you think you asked.
Five steps for one cohort
- Fix the cohort. List every customer paying recurring revenue on the first day of the period. Total their MRR. That total is the only denominator you will use.
- Add expansion. Upgrades, added seats, add-ons, and price increases on those same customers. A plan move from a lower tier to a higher one belongs here, measured against what that customer paid at the start.
- Subtract contraction. Downgrades and reduced usage, again measured against each customer's starting level. The customer is still paying. They are paying less.
- Subtract churn. The full recurring revenue of customers who cancelled or did not renew. Partial losses stay in contraction. A full loss is churn.
- Divide and scale. Divide the result by starting MRR and multiply by 100.
| Component | Amount |
|---|---|
| Starting cohort MRR | $50,000 |
| Expansion MRR | $8,000 |
| Contraction MRR | −$2,000 |
| Churned MRR | −$3,000 |
| Ending cohort MRR | $53,000 |
| NRR (ending ÷ starting × 100) | 106% |
Walk the arithmetic on that quarter. Start at $50,000. Add $8,000 of expansion, subtract $2,000 of contraction and $3,000 of churn, and you are left with $53,000. Then $53,000 ÷ $50,000 × 100 = 106%. The original customers produced 6% more recurring revenue than they did on day one.
Customers who signed up during the quarter stay off both sides of the calculation, even when they were the largest source of revenue growth. Their first payment is new revenue. It can make the company look like it is compounding when the opening cohort is flat or shrinking.
Practical rule: Rerun the same five steps on last quarter's cohort, and take the starting figure from the first day of that quarter, not from month-end totals.
If the opening list and the closing list are not the same people, you are no longer measuring retention. You are mixing acquisition into a metric that exists to keep acquisition out.
What NRR Measures and Why It Ignores New Customers
Treat the cohort like water already in a bathtub on the first day. Net revenue retention tells you how much of that water is still there at the end, after leaks and top-ups. Churn and contraction are the leaks. Expansion is water you add to the same tub. Water poured in later, the customers acquired during the period, is ignored.

Total MRR growth counts everything in the tub, including the new pour. A company can add 20% to total MRR while its existing customers pay 8% less, because new sales cover the loss. An NRR of 92% in that case shows a shrinking base that the headline growth hides.
The Revenue Bug guide to net revenue retention defines the metric as recurring revenue that remains from the cohort present at the start, with new customers excluded. Expansion covers upsells, cross-sells, seat growth, and price increases. Contraction covers downgrades or reduced usage. Churn is revenue lost when those customers cancel. On that definition, 100% means the cohort generated the same recurring revenue at period end, and a result above 100% means expansion outweighed contraction and churn.
That boundary is why the metric is more informative than total growth when you are judging durability. It isolates how well existing customers are monetized and retained, separate from how well sales acquires new ones. Broader SaaS market data and trends from Statlyst are useful context for how subscription businesses grow, but they will not tell you whether your own installed base is holding.
When an investor or a board asks whether growth is durable, NRR answers a different question from the growth rate. Growth rate can be bought with new logos. NRR cannot.
Compare last period's total MRR growth with NRR from the same window, and note which one is driving the story. If growth is high and NRR is under 100%, acquisition is papering over a leak. If NRR is above 100% and total growth is modest, the base is doing more work than the new-logo count suggests.
Which Revenue Movements Count Toward NRR
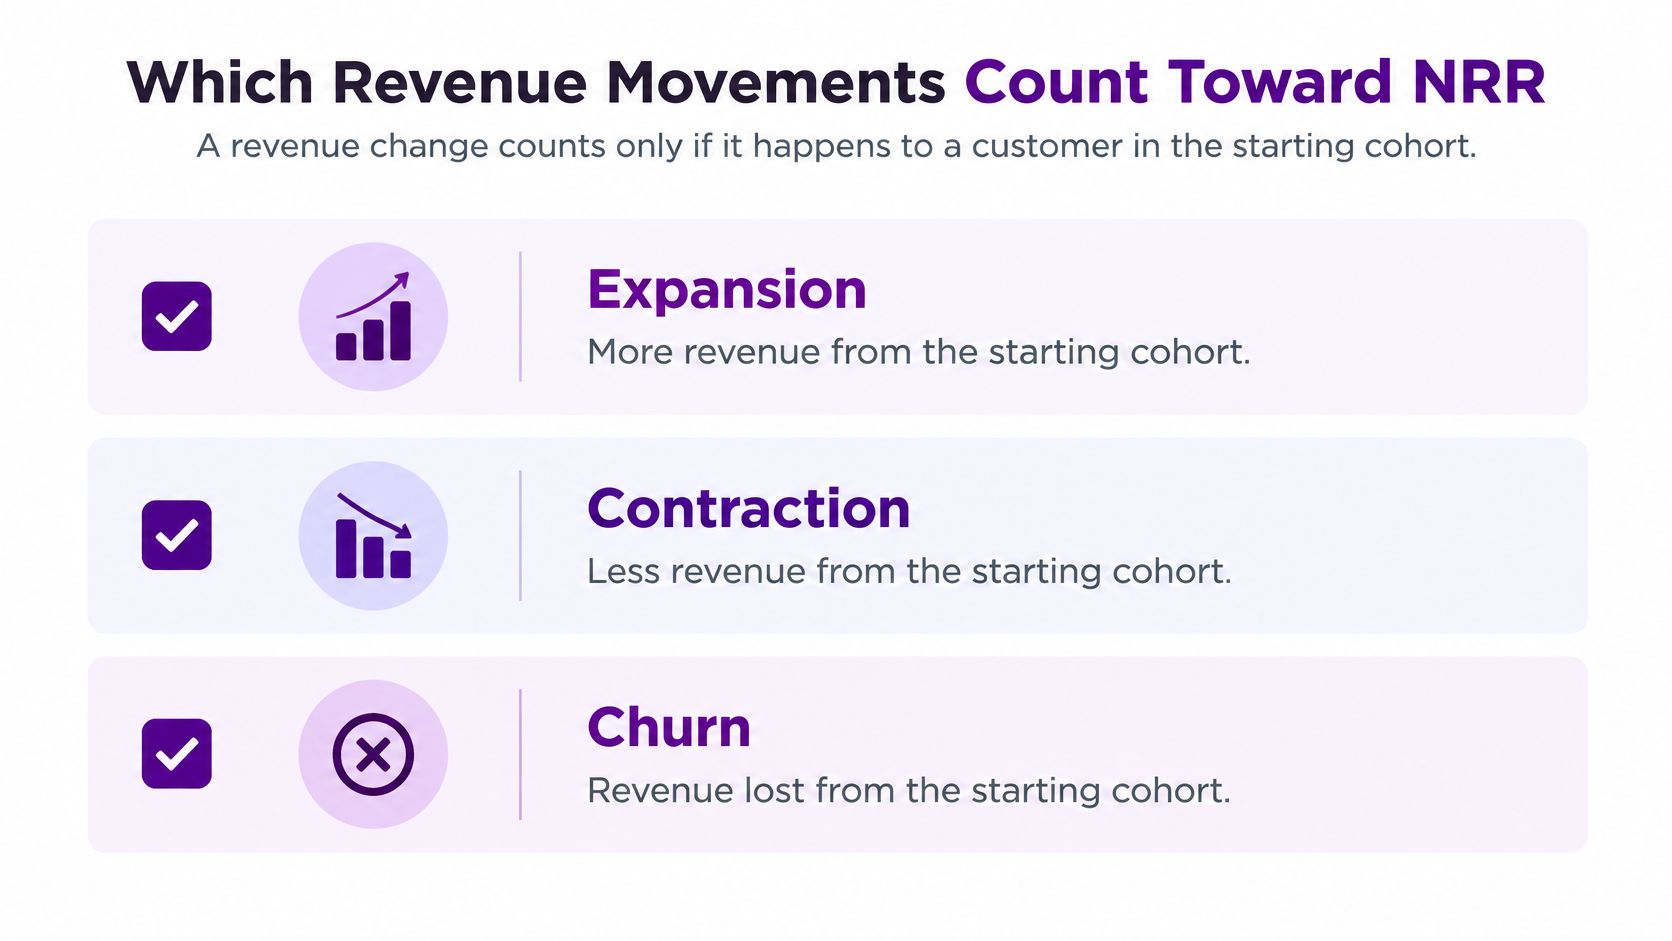
A revenue change counts only if it happens to a customer in the starting cohort, and then it falls into expansion, contraction, or churn.
Check each event against one list
| Revenue event | Category | Counts toward NRR | Example |
|---|---|---|---|
| First payment from a customer who signed up in the period | New | No | Signs up in week two of the quarter |
| Upgrade to a higher plan | Expansion | Yes | Plan moves from $50 to $80 a month |
| Added seats or an add-on | Expansion | Yes | Five extra seats at $10 each |
| Price increase on existing customers | Expansion | Yes | 10% rise at renewal |
| Downgrade to a lower plan | Contraction | Yes | Plan moves from $80 to $50 a month |
| Reduced usage on a usage-based plan | Contraction | Yes | Monthly usage bill falls from $600 to $450 |
| Cancellation or non-renewal | Churn | Yes | $50 monthly plan cancelled at renewal |
| Partial refund to a cohort customer | Adjustment | Yes, if you net it against that customer's recurring revenue | Recurring revenue net of refund |
Apply the table in this order.
- Take the opening list. Freeze customers as of the first day. Do not refresh it when someone signs up on day 12.
- Match the invoice to a name. For each subscription change, check whether that customer was on the list. If they were not, the amount is new revenue and it does not enter NRR.
- Compare before and after. An upgrade, extra seats, an add-on, or a renewal price rise is expansion. How those increases behave over time is covered in more detail in this note on expansion revenue. A lower plan or a smaller usage bill is contraction. A cancellation or a missed renewal is churn.
- Net adjustments on the same customer. Partial refunds and failed payments should be applied against that customer's recurring revenue, using the definition you publish. A refund that you leave unassigned will either inflate expansion or hide contraction.
- Total the three buckets. Those totals are the inputs to the formula. Do not net them into one "change" line before you store them. You will need the split later.
The same event can be read differently under different definitions. A 10% renewal increase is expansion if you include price, and it is invisible if you strip price out. A usage drop from $600 to $450 is contraction if you count consumption, and it never appears if you only track the subscription fee. Write the choice down once and keep it.
If a movement cannot be tied to a single customer, resolve it before you calculate. Unassigned revenue changes the percentage without leaving a trail you can explain to a board.
Reading NRR Above, At and Below 100%
Read a single figure against the band it falls in, then check whether the last two periods moved toward that band or away from it. Direction often changes the decision more than the band itself.
A result of 100% is the hinge. Expansion exactly offsets contraction and churn, so the cohort's recurring revenue is unchanged. That can be a quiet book, or it can be large gains cancelling large losses. The next section shows why those are not the same risk. Below that line, the opening cohort is worth less than it was. Above it, expansion more than covers the leaks, and you still have to ask what kind of expansion.
| NRR range | What it means | What to check next |
|---|---|---|
| Below 90% | Cohort loses a tenth or more of its starting revenue | Churn reasons and contraction by plan |
| 100% | Expansion exactly offsets contraction and churn | Whether large offsetting movements sit underneath |
| 101% to 110% | Expansion exceeds losses; the cohort grows on its own | Whether growth depends on one plan or a few accounts |
| Above 110% | Strong expansion from existing customers | Price increases or one-time seat spikes inflating the figure |
What changes from one band to the next
Below 90% is a shrinking cohort, not a slow one. Each period the opening book loses a tenth or more of its starting revenue. Start with cancellation reasons and with contraction by plan. A single cheap plan that downgrades every month will drag the company figure even when enterprise accounts look steady.
The gap between 90% and 99% is slower. Losses still exceed expansion, so the base is contracting, but you have time to see whether any expansion path exists beyond a single upgrade. If the only upsell is one higher tier that almost nobody takes, the band will not move on its own.
From 101% to 110%, the cohort grows without new logos. The first check is concentration. If one plan, or a handful of accounts, produces nearly all of the expansion, the band is fragile. Pull those accounts out and recalculate. If the figure falls under 100%, the "growing cohort" was a few customers, not a pattern.
Above 110%, expansion is strong, and that is exactly when price increases and one-time seat spikes deserve a second pass. A renewal uplift booked entirely in one month can push a trailing figure into this band and then disappear. Split price-driven expansion from seats, add-ons, and usage before you treat the band as a run rate.
Place your own figure in a band, note the trend from the previous two periods, and write down the one movement category that would change your reading. If removing price increases drops you a band, you do not have an expansion engine yet. You have a pricing event.
Why Companies With the Same NRR Carry Different Risk
A 100% result does not mean nothing moved. Three companies can post the same percentage on a $50,000 starting cohort and carry completely different risk.
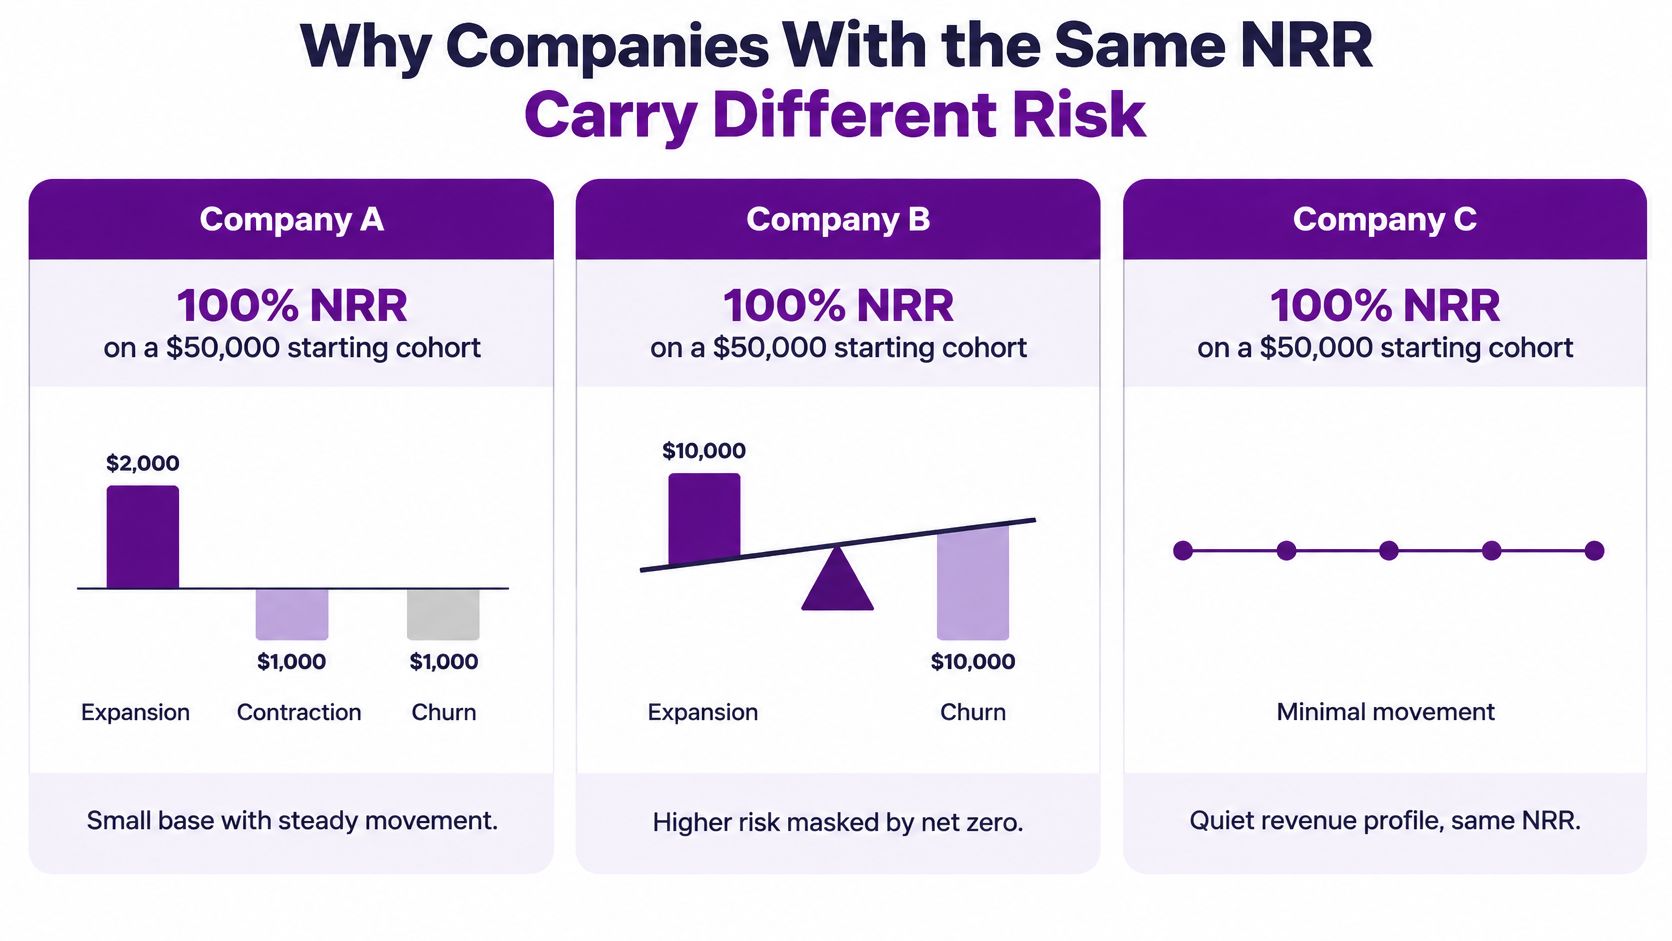
| Company | Expansion | Contraction | Churn | Ending math | What is actually happening |
|---|---|---|---|---|---|
| A | $2,000 | $1,000 | $1,000 | $50,000, so 100% | Small movements, steady upgrades, few losses |
| B | $9,000 | $2,000 | $7,000 | $50,000, so 100% | Heavy usage growth sitting on top of heavy losses |
| C | $7,000 from a price increase | $1,000 | $6,000 | $50,000, so 100% | Stayers pay more after a price move, and a large share left |
Company A is a small, steady book. Two thousand dollars of upgrades cover two thousand dollars of losses. Company B's expansion is masking turnover. Nine thousand dollars came in, mostly from usage, while seven thousand dollars walked out the door. Company C's seven thousand dollars of expansion is a price increase. Customers who stayed may pay more, and a large share left after the increase.
Planhat's note on retention reporting makes the same distinction in plain categories. Expansion raises recurring revenue from existing customers. Contraction reduces it without a full cancellation. Churn removes a customer's recurring revenue. New revenue comes from customers acquired during the period and stays out of NRR. Because of that exclusion, strong total MRR growth can sit next to a shrinking base, and NRR above 100% can show the installed base expanding before any new sale is counted.
Company B's expansion can fall back. Usage that spiked for a project, a season, or a budget flush is not the same as a seat the customer added because the product is doing more work. Company C's result may not repeat. You cannot raise price by the same amount every period, and the customers who left after this increase are gone.
Three checks separate the score from the story.
- The movement split. Put expansion, contraction, and churn next to the percentage. If either side is large relative to the $50,000 start, 100% is a coincidence of totals.
- Price versus added value. Ask what share of expansion came from a price change rather than seats, add-ons, or durable usage. Price-only expansion should be labeled, not blended.
- Where churn clusters. If losses sit in one plan, one country, or one acquisition channel, the company figure is an average of a healthy segment and a weak one. Concentration of that kind is the subject of revenue concentration risk.
Report the components beside the headline percentage every month. Read the number as a story, not a score. Company A, Company B, and Company C would all print "100%" on a slide. Only one of them is quiet.
NRR Benchmarks by Company Segment
Treat published benchmarks as reference points. A median is the midpoint of a surveyed group, and the useful question is which survey boundary resembles your book: contract size, funding type, window, and revenue basis.
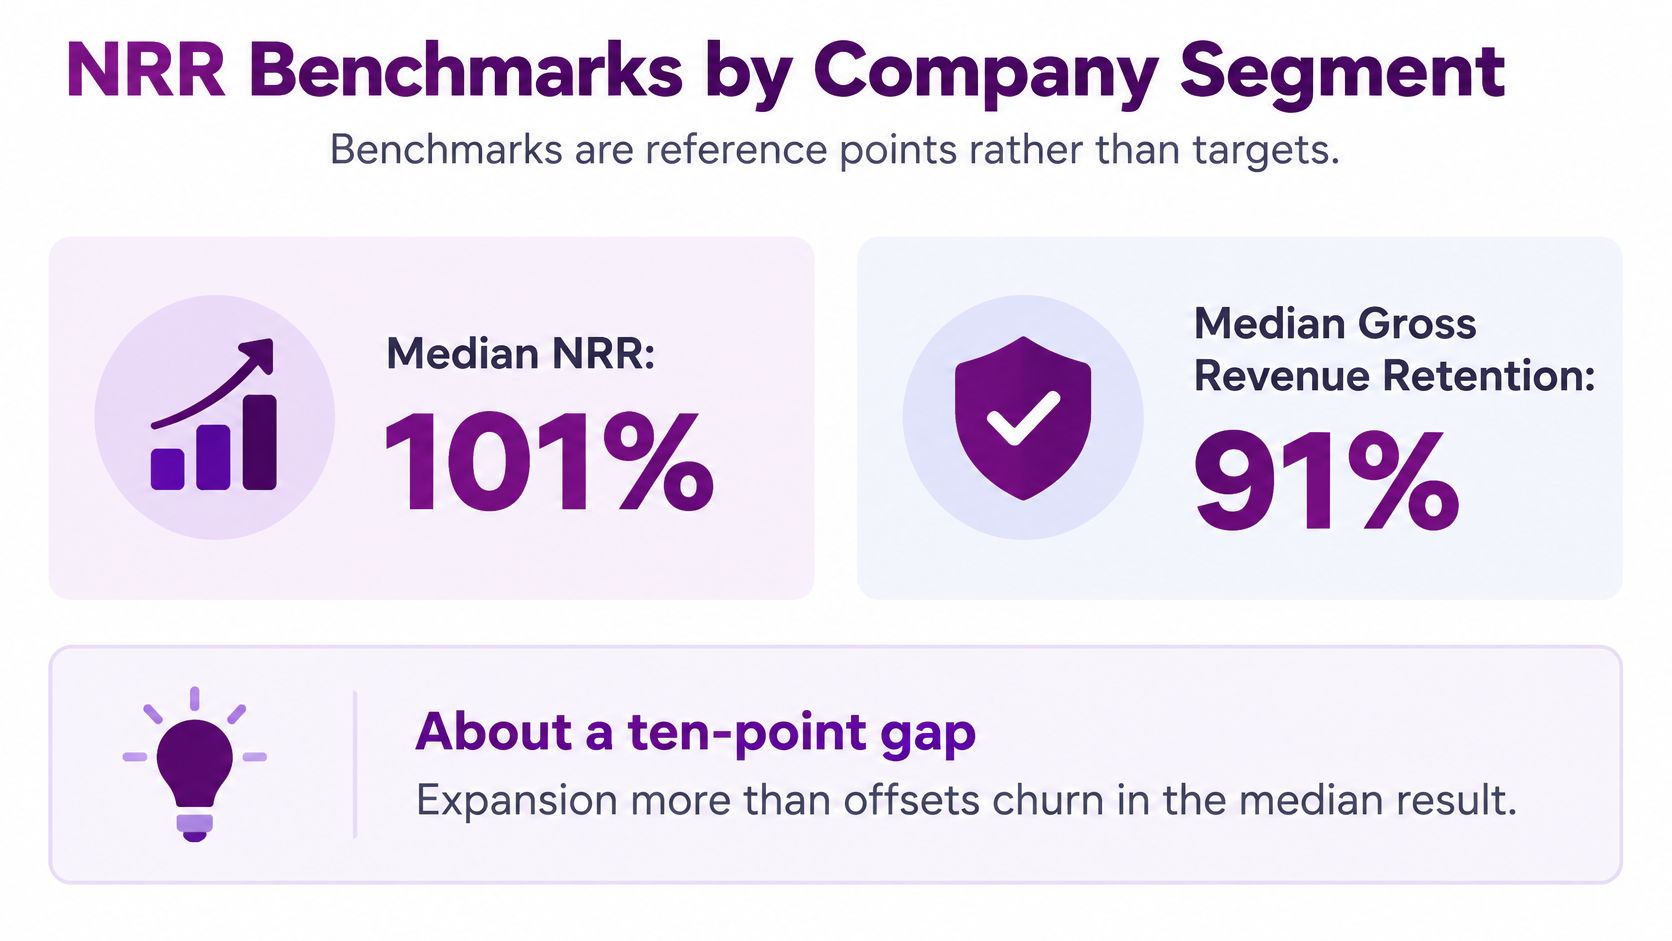
A summary of the SaaS Capital survey puts median net revenue retention at 101% among more than 1,000 private B2B SaaS companies, measured for December 2024. The 2025 SaaS Capital benchmark report places median gross revenue retention at 91% for that same survey. The ten-point gap is expansion: gross retention stops before upgrades and increases, while NRR includes them. In that report, median NRR was 98% where average contract value sat below $12,000 and 106% where it sat above $250,000. Bootstrapped companies reported a 104% median, against 101% for equity-backed companies.
Public filings sit in a different population, with different windows. Clearwater Analytics reported 110% as of March 31, 2024. In a later filing, Clearwater Analytics reported 116% as of December 31, 2024, up from 107% a year earlier. A separate SEC exhibit reported a dollar-based net revenue retention rate of 105% as of September 30, 2024. Those filings do not share one cohort rule with the private survey, so they show a rough public range rather than a pass mark.
| Source or group | Segment or measure | Reported value | Period or context |
|---|---|---|---|
| SaaS Capital survey | Median NRR, private B2B SaaS | 101% | December 2024 |
| SaaS Capital survey | Median gross revenue retention | 91% | December 2024 |
| SaaS Capital survey | Average contract value below $12,000 | 98% median NRR | December 2024 |
| SaaS Capital survey | Average contract value above $250,000 | 106% median NRR | December 2024 |
| SaaS Capital survey | Bootstrapped companies | 104% median NRR | December 2024 |
| SaaS Capital survey | Equity-backed companies | 101% median NRR | December 2024 |
| Clearwater Analytics, public filing | Net revenue retention | 110% | March 31, 2024 |
| Clearwater Analytics, public filing | Net revenue retention | 116% | December 31, 2024 |
| Public company filing, unnamed in source | Dollar-based net revenue retention | 105% | September 30, 2024 |
Use the row that matches you
Find the row closest to your contract size and funding type. Then check the boundary behind it: which customers counted, which movements counted, whether price increases sat inside expansion, and whether dollars or logos carried the weight. A wider set of SaaS retention benchmarks helps you see which comparisons are even fair.
Rows above the private median imply an expansion engine, meaning seat growth, plan upgrades, add-ons, or usage growth rather than only low logo churn. If your figure reaches a row because one increase landed inside the window, label that movement before you compare. The segment median matters less than whether your expansion repeats after the cohort boundary resets.
Mistakes That Make NRR Comparisons Misleading
Two net revenue retention figures can disagree while the businesses underneath look nearly identical. The usual cause is the definition, not the customers. DualEntry's benchmark notes put a 75th-percentile NRR of 108% on companies with about $5 million to $20 million in ARR, a level that generally takes real expansion rather than low churn alone. The same notes warn against treating the figures as universal targets, because the result moves with the window, the weighting, and whether price increases count.
Five mismatches account for most bad comparisons.
The time window comes first. A monthly NRR and an annual NRR for the same company are different numbers. Set a monthly 98% next to an annual 106% and you will invent a trend that exists only in the reporting. Recalculate both on one window before you compare them.
Weighting comes second. A customer-weighted average gives a $200-a-month account the same vote as a $20,000-a-month account. A revenue-weighted figure tracks dollars. State which one you use. Switching methods can move the result without a single customer changing plans.
Price increases come third. A cohort that absorbs a list-price rise reports expansion even if nobody bought another seat. Report the percentage with the increase and without it. If the two readings sit in different bands, the increase is doing the retaining.
Usage-based revenue comes fourth. Consumption can spike one quarter and fall the next. Separate the subscription base from usage movements so a seasonal bill does not read as a permanent upgrade.
A single average comes fifth. One company-wide figure can hide two segments moving in opposite directions: a small channel expanding fast and a large plan contracting can net to the same number as a flat book. The split into expansion, contraction, and churn is where the comparison lives. Segment before you compare.
Write the definition once, keep it fixed, and apply it to every comparison, including any benchmark you cite.
For each mismatch, recalculate the same window under your fixed definition and watch how far the figure moves. If it crosses a band, you were comparing methods, not cohorts.
Start Tracking NRR by Segment Each Month
You can run this from issued invoices. The point is that the same invoices, and the same rules, show up every month.
- Write the definition in one short paragraph. Name the cohort start date, the revenue basis as recurring revenue from billed invoices, and the window as monthly plus a trailing twelve months. Say how you treat prorations, partial refunds, failed payments, and mid-cycle plan changes.
- Calculate the last three months. Use starting cohort MRR, expansion, contraction, and churn, then divide by the start. Three months is enough to see a direction without waiting on a full year.
- Split each result. Keep expansion, contraction, and churn as separate lines, and label price-driven expansion on its own. A blended "net change" throws away the story.
- Break the figure down. Do it by plan and by acquisition channel. A single average can hide a weak segment that is already large enough to matter next quarter.
- Set the next review date. Compare next month under the same paragraph you wrote in step 1. If you edit the definition, start a new series. Do not overwrite the old one.
Chartsy's metrics include MRR, ARR, churn rate, LTV, net revenue retention, expansion MRR, trial-to-paid rate, and active subscriptions. The maths runs from the account's invoice data rather than from subscription estimates, and it handles proration, partial refunds, failed payments, and mid-cycle plan changes from the issued invoices. A spreadsheet is fine for the same routine if it reads those invoices the same way each month and the definition does not drift. For a wider view of which numbers a revenue team should review together, Revenue Nomad's piece on measuring revenue operations performance is a useful companion, not a replacement for the cohort split.
This week, calculate NRR for the most recent full month and write down which movement drove the result. If you cannot name expansion, contraction, or churn as the driver, you do not have the metric yet. You have a percentage.
Chartsy calculates net revenue retention from your issued invoices and lays expansion, contraction, and churn next to the headline figure, by plan and over time. That is the split this metric needs before a board number turns into a decision. See how your own cohort reads in Chartsy.

Written by
Chartsy TeamAnalytics team at Chartsy
The Chartsy Team writes guides, product updates, and resources to help SaaS and eCommerce founders make sense of their metrics, without SQL or spreadsheets.
Chartsy