
Your traffic dashboard looks healthy. Signups are coming in, trial accounts are appearing in the product, and every campaign report has a number to celebrate. Then someone asks the question that matters: which sources are bringing paying customers, and which sources are creating recurring revenue that stays?
If the answer requires exporting website data, CRM records, and billing events into a spreadsheet, your growth decisions are based on incomplete evidence. You may increase spend on a channel that produces many signups but weak retention, or cut a source that brings fewer customers who expand over time.
That's the problem SaaS revenue attribution is designed to solve. It connects the original acquisition source to subscription activity, including new MRR, upgrades, downgrades, renewals, and churn. The result isn't perfect proof that one channel caused a purchase. It's a more useful view of how acquisition sources relate to the revenue your SaaS business keeps.
Table of Contents
- Introduction Why SaaS Revenue Attribution Matters Now
- What SaaS Revenue Attribution Really Means
- Comparing Attribution Models for SaaS Buying Cycles
- Key Metrics That Make Attribution Useful for Subscriptions
- How to Implement SaaS Revenue Attribution Without a Data Team
- Practical Examples and Reporting Templates You Can Use
- Common Pitfalls and Your Next Step With Chartsy
Introduction Why SaaS Revenue Attribution Matters Now
A founder might see organic search producing fewer signups than paid social and assume paid social is the stronger channel. But signup volume is only the beginning of a subscription relationship. If organic customers pay longer, upgrade more often, or churn less frequently, the initial comparison hides the business outcome that matters.
A 2026 benchmark summary reported that the median B2B SaaS workspace attributed 71% of revenue, while the top quartile reached 85% or more. The same dataset reported that organic and direct customers produced a 2.0x lifetime value multiplier compared with paid social, with $684 versus $347, and had less than half the six-month churn, 18% versus 39%. These figures are a historical signal that attribution quality and channel mix can materially affect recurring-revenue analysis, not a promise that every SaaS business will see the same relationship. (2026 SaaS marketing attribution benchmarks)
The practical question is simple: what happens after acquisition? A source should be evaluated by the customers it brings, the subscription revenue those customers generate, and the way that revenue changes over time. That means connecting website visits and signup records to billing data rather than stopping at a form submission or trial start.
Practical rule: Treat attribution as a decision aid, not a courtroom verdict. It can show which sources are associated with paying customers and retained revenue, but it can't prove that a single touchpoint caused a purchase.
This guide stays focused on SaaS subscriptions. It explains the basic concept, compares models for longer buying cycles, defines the metrics that make attribution useful, and lays out an implementation path for founders and small teams. Chartsy provides one context for this workflow by connecting website and signup activity with Stripe and Paddle subscription data, then making the results easier to explore without a dedicated analyst.
What SaaS Revenue Attribution Really Means
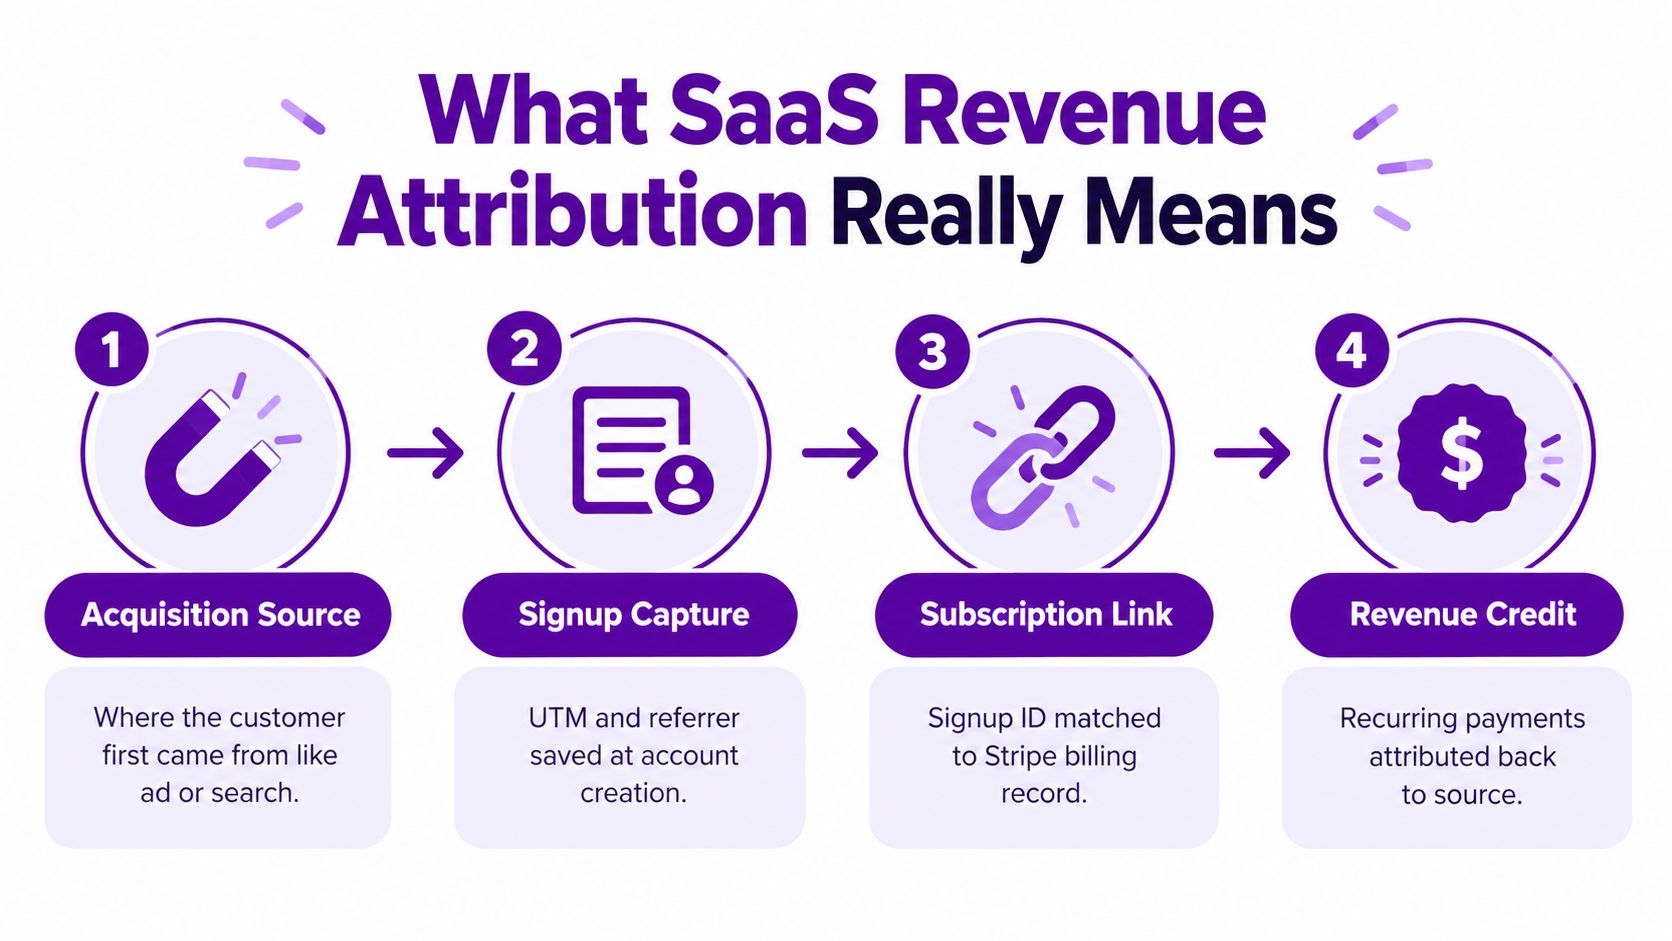
Think of acquisition data as a label attached to a customer account. A visitor arrives through an organic search result, a referral, or a campaign link. The signup system saves that source, and the billing system later records whether the account subscribes, renews, upgrades, downgrades, or churns.
Revenue attribution follows the label through that journey. It doesn't stop at “this campaign generated a signup.” It asks whether the signup became a paying customer and how the resulting subscription contributed to recurring revenue over time.
A practical SaaS revenue-attribution model captures UTM parameters, referrer, and channel information at signup, matches that information to the billing subscription server-side, and attributes later renewals, upgrades, and churn back to the original source. That approach analyzes recurring revenue by channel instead of treating traffic or first-touch conversion as the final outcome. (SaaS revenue tracking guidance)
From traffic attribution to revenue attribution
Traffic attribution answers, “Where did this visitor come from?” Signup attribution answers, “Which source brought this account into the product?” Revenue attribution goes further: “What subscription value is associated with that account, and how has it changed?”
That distinction matters because SaaS businesses earn revenue repeatedly. A customer who signs up through a campaign but cancels quickly may be less valuable than a customer who arrives through a smaller channel and remains active through several billing periods. The data still needs careful interpretation, because a source connected to retained MRR is associated with that outcome, not automatically responsible for it.
Teams without analysts also need a way to interrogate the data without learning SQL. Plain-English analysis can help a founder ask questions such as:
- Source quality: Which acquisition sources bring paying customers?
- Revenue movement: Which sources are linked to new, expansion, contraction, and churned MRR?
- Customer mix: How do plans, countries, or segments differ by source?
- Retention: Which sources have stronger retained MRR after the chosen maturation window?
The core definition is:
SaaS revenue attribution connects an acquisition source to a customer's subscription events and recurring revenue, so a team can evaluate channel quality beyond signups or the first payment.
For a concise explanation of the underlying concept, see Chartsy's attribution documentation.
Comparing Attribution Models for SaaS Buying Cycles
No attribution model describes the customer journey perfectly. Each one answers a different question, so the right choice depends on your sales cycle, tracking quality, and decision.
First-touch attribution gives all credit to the first known source. It's useful when you want to understand discovery, but it ignores the education, evaluation, and sales activity that follows. Last-click attribution gives all credit to the final recorded interaction. It's easy to explain, but it often rewards bottom-funnel channels that capture demand created elsewhere.
Multi-touch models distribute credit across several interactions. In B2B SaaS, guidance reports an average of 8.3 touchpoints and a 45–90 day sales cycle, and recommends position-based 40/20/40 or time-decay models for longer cycles. (Cross-channel marketing analytics guidance)
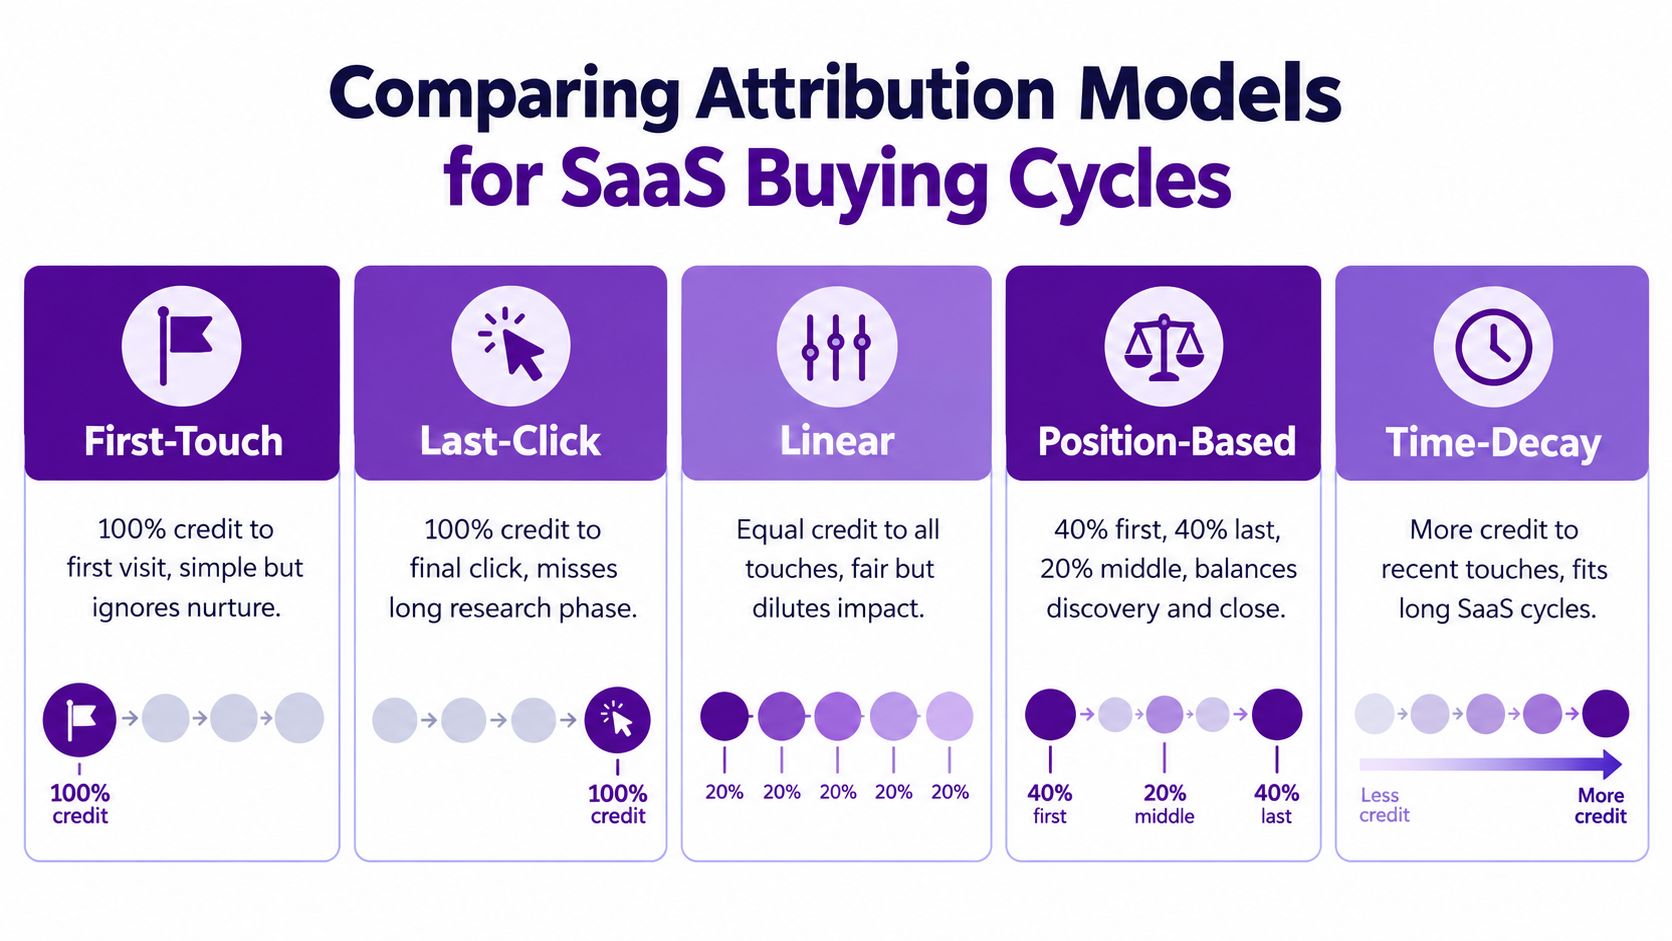
| Model | How Credit Is Assigned | Best Fit | Watch Out For |
|---|---|---|---|
| First-touch | All credit goes to the first known interaction | Understanding discovery and initial reach | It ignores later nurturing and conversion activity |
| Last-click | All credit goes to the final known interaction | Short, direct journeys with a clear conversion event | It can over-credit bottom-funnel sources |
| Linear | Credit is divided evenly across tracked touches | A simple multi-touch baseline | Equal credit may not reflect different roles |
| Position-based | 40% goes to the first touch, 40% to the last, and 20% to middle touches | Journeys with meaningful discovery and close stages | The fixed weights may not fit every buying process |
| Time-decay | More credit goes to interactions closer to conversion | Longer cycles where recent activity may signal intent | Earlier awareness can be undervalued |
For a SaaS product with a short self-serve path, last-click can be a practical starting point if the team understands its limits. For a product that requires education, evaluation, and sales involvement, position-based or time-decay attribution gives earlier interactions a place in the analysis.
Model coverage is another important check. If the top five customer journey paths explain materially less than about 55–65% of conversions, the source data or attribution window may be too fragmented for simple rule-based crediting. That situation calls for better tracking, custom weighting, or path-based logic rather than false precision.
The model should match the question. Use first-touch to study discovery, multi-touch to inspect the journey, and revenue-based reporting to judge subscription quality. None of these models proves causation. They allocate analytical credit under defined rules.
Key Metrics That Make Attribution Useful for Subscriptions
A signup count tells you that an account entered the funnel. It doesn't tell you whether the account became profitable, remained active, or expanded. Subscription attribution becomes useful when each source is connected to MRR and its movements.
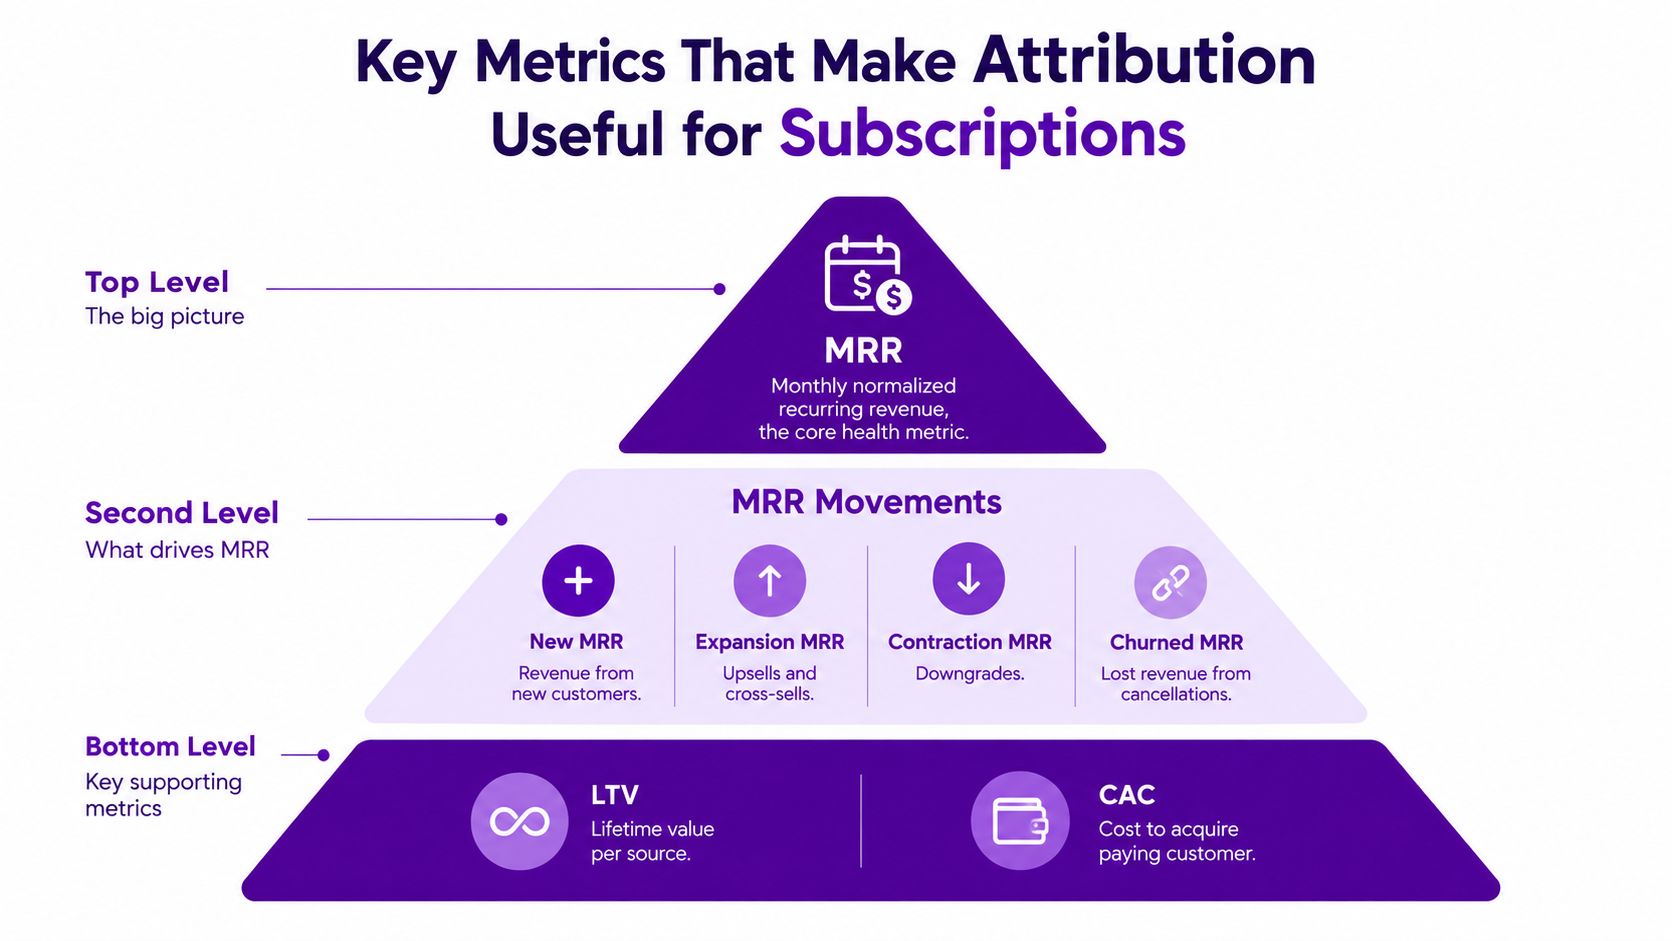
Stripe defines MRR as the monthly-normalized value of active and past_due subscriptions, excluding taxes, free plans, and metered usage-based products. Stripe also defines a subscriber as churned when the subscription is canceled or marked unpaid. (Stripe Billing Analytics documentation)
Read MRR as a set of movements
A total MRR number can rise while some customer groups weaken. Break the change into the events that explain the movement:
- New MRR: Recurring revenue from newly paying customers.
- Expansion MRR: Additional recurring revenue from upgrades, cross-sells, or other increases.
- Contraction MRR: Recurring revenue lost through downgrades.
- Churned MRR: Recurring revenue lost when customers cancel or become unpaid.
This breakdown lets you ask a more useful question than “Did MRR grow?” You can ask whether a channel is associated with strong new revenue but weak retention, or whether an existing customer segment is creating expansion that offsets contraction and churn.
Pair acquisition with retained MRR
For subscription businesses, the strongest attribution signal isn't only first-payment conversion. Guidance for Stripe-linked attribution recommends calculating New MRR at acquisition and Retained MRR after a maturation window such as 30, 60, or 90 days. (Stripe MRR attribution guidance)
A source that generates many signups may produce weak retained MRR if those customers refund, churn, or fail to expand. A lower-volume source may deserve closer attention if its customers remain active and create stronger recurring value. This comparison still describes an observed relationship. It doesn't establish why customers behaved differently.
Handle billing definitions carefully
Trials can appear in subscriber reporting even when they contribute nothing to MRR. Paused accounts, unpaid subscriptions, multiple trial periods, and multi-currency coupons can also affect how billing analytics counts subscribers and revenue. Before comparing channels, document which events your report includes and use the same definitions across every source.
A practical channel view includes paying customers, New MRR, Retained MRR, expansion, contraction, and churned MRR. Add LTV and CAC only when the underlying cost and customer identity data are consistent enough to support the comparison.
How to Implement SaaS Revenue Attribution Without a Data Team
You don't need to begin with a complex warehouse. You need a reliable identity chain from visitor to account to subscription.
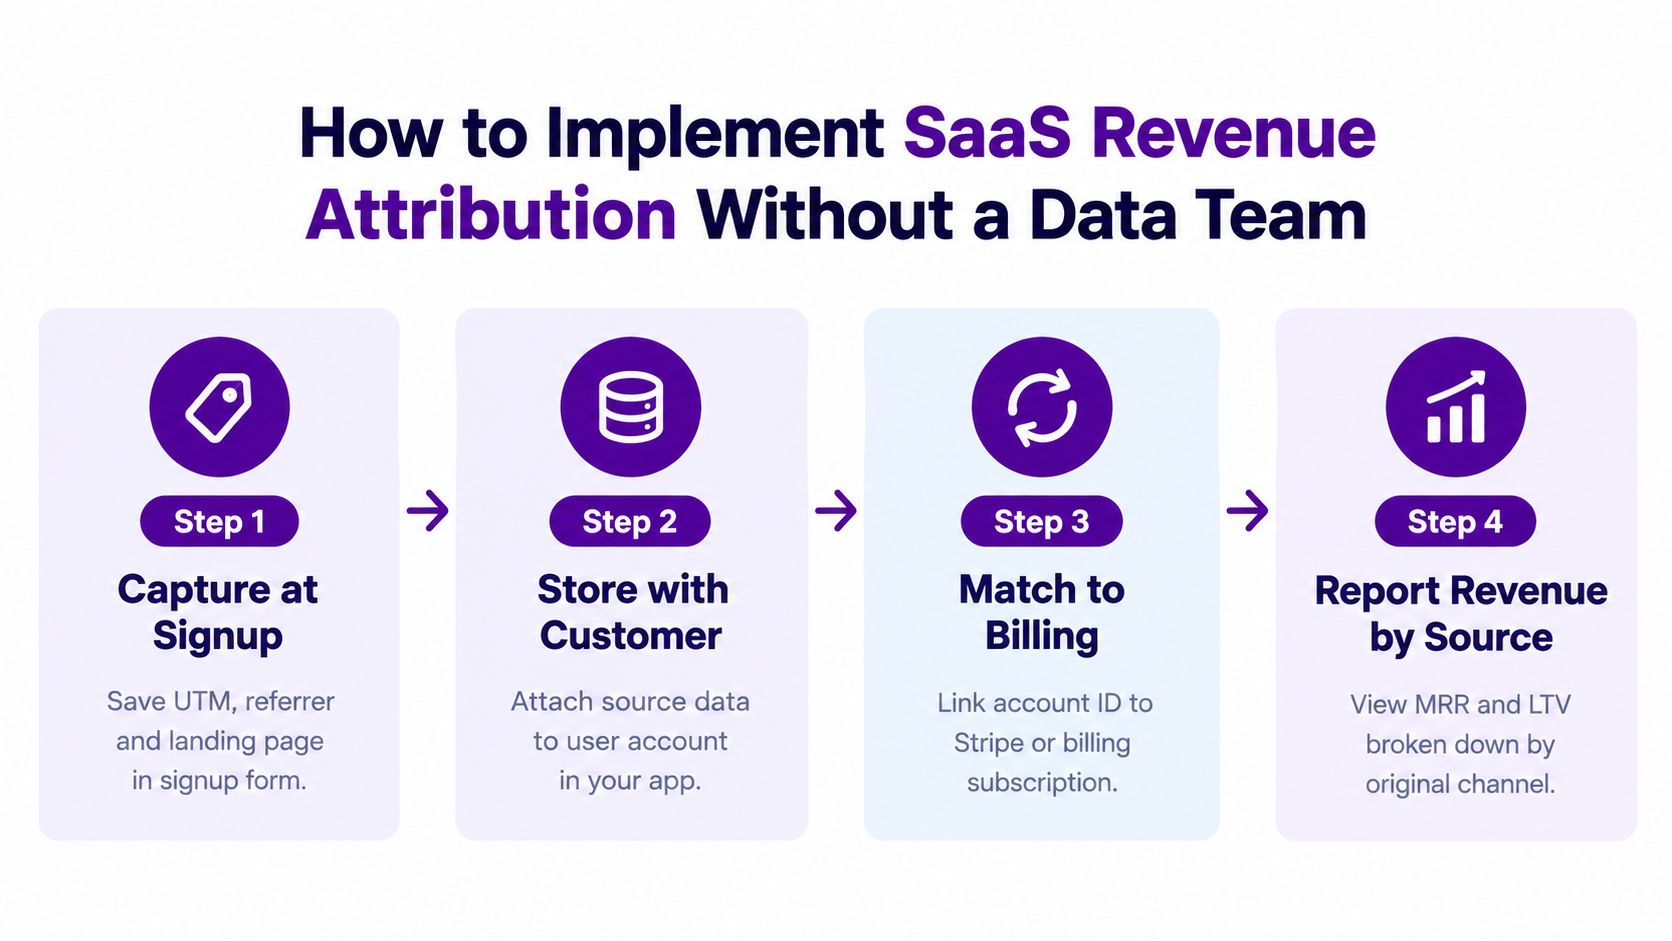
Capture the source at signup
Store the UTM parameters, referrer, landing page, and campaign details when the visitor creates an account. Keep the source with the customer record rather than leaving it only in a browser analytics tool, where the connection can disappear before payment.
The account should also have a stable identifier. Email can help, but an internal account or customer ID is safer for matching application records to billing records. Decide whether you're preserving the first known source, the latest source, or a separate history of touches.
Match the account to billing
Connect the application account ID to the corresponding subscription record in Stripe, Paddle Billing, or Paddle Classic. This matching step is what turns “campaign signup” into “subscription revenue associated with a campaign.”
Chartsy's read-only billing connections are designed for this kind of analysis. It brings website and signup activity together with supported Stripe and Paddle subscription data, including MRR, customer growth, churn, and subscription movements. Its plain-English interface lets a small team explore questions and save charts without writing SQL.
Attribute movements back to acquisition
Once the records match, report subscription events by original source. A customer acquired through content can contribute new MRR at signup, expansion MRR after an upgrade, contraction MRR after a downgrade, and churned MRR after cancellation. The source remains the acquisition dimension, while billing events explain what happened to the subscription.
This guide to connecting UTM tracking to revenue is useful when reviewing the capture and matching workflow.
Reconcile before trusting the dashboard
Add the attributed channel totals together and compare them with the CRM or billing total. Best practice recommends keeping the variance within about ±10% to catch tracking loss, unmatched accounts, or duplicate credits. A mismatch isn't automatically a failure, but it is a reason to investigate before reallocating budget.
Check a small set of accounts manually. Confirm the source, signup identity, billing customer, plan, and movement history. A simple, auditable model is more valuable than a complex model that nobody can verify.
Practical Examples and Reporting Templates You Can Use
The following examples are hypothetical illustrations, not customer results. Their purpose is to show how a small SaaS team can turn attribution into a repeatable operating report.
Suppose a project-management SaaS has three acquisition sources: organic search, a partner referral, and paid social. Paid social produces the most trial accounts, while organic search produces fewer accounts but a larger share of paying customers. The team should not conclude that organic search caused stronger retention, but it should investigate whether the associated customer mix, plan selection, onboarding behavior, or source quality differs.
A useful acquisition-to-revenue table might include:
| Source | Signups | Paying Customers | New MRR | Retained MRR | Churned MRR |
|---|---|---|---|---|---|
| Organic search | Tracked count | Matched count | Billing value | Maturation-window value | Billing movement |
| Partner referral | Tracked count | Matched count | Billing value | Maturation-window value | Billing movement |
| Paid social | Tracked count | Matched count | Billing value | Maturation-window value | Billing movement |
Use actual values from your systems. Don't fill gaps with estimates and then present them as measured revenue.
Three reports that answer operating questions
- Acquisition quality report: Group paying customers and New MRR by source, plan, country, and supported segment. This shows who each channel brings into the business.
- MRR movement report: Separate new, expansion, contraction, and churned MRR by original source. This reveals whether growth comes from new acquisition or existing-customer changes.
- Churn review: List churned customers by source, plan, signup period, and subscription status. Treat the source as context, not an explanation for cancellation.
A founder could ask a plain-English analytics assistant, “Which sources brought paying customers with retained MRR?” Another useful question is, “Which plans have the most expansion and contraction by acquisition source?” Save the resulting charts to a dashboard and review them on a consistent schedule.
Multi-touch measurement is becoming more common in B2B SaaS benchmark reporting. One independent report said 76% of marketing teams used some form of multi-touch attribution in 2024, up from 61% in 2023. The same benchmarks reported a median marketing-sourced revenue share of 29% for B2B SaaS, with ABM-led motions at 41% and demand-gen-led motions at 24%. (B2B marketing attribution benchmarks)
The right dashboard isn't the one with the most charts. It's the one that helps your team decide which sources to investigate, which customer movements require attention, and where the billing data doesn't reconcile.
Common Pitfalls and Your Next Step With Chartsy
Last-click attribution can make a final campaign look like the entire reason a customer subscribed. A short attribution window can also miss earlier research, sales conversations, and return visits in a longer SaaS journey. Use a model and window that fit the buying process, then compare the output with billing behavior.
Billing definitions create another set of traps. Stripe notes that paused subscriptions at trial end may be counted as paused rather than churned in a newer pipeline, trials can be counted even when they contribute nothing to MRR, and corrections involving multiple trial periods or multi-currency coupons can change MRR and active-subscriber counts. (Stripe billing analytics edge cases)
Keep these checks in your reporting routine:
- Separate trials from MRR: A trial account isn't recurring revenue.
- Define churn consistently: Document whether canceled, unpaid, and paused subscriptions are treated differently.
- Check movement types: New, expansion, contraction, and churned MRR shouldn't be collapsed into one total.
- Reconcile totals: Compare attributed revenue with billing records before acting on a channel comparison.
- Avoid causal language: Say that a source is associated with retained MRR, not that it made customers stay.
Chartsy is a practical fit when your website and signup data are disconnected from Stripe, Paddle Billing, or Paddle Classic, and your team needs source-level views of paying customers, MRR, lifetime revenue, subscription status, and churn without maintaining a BI stack. Its growth attribution feature supports the workflow of connecting acquisition activity to subscription outcomes, while plain-English questions and saved dashboards make recurring reporting manageable for a small team.
Chartsy connects website traffic and signup tracking with Stripe and Paddle subscription data, so you can examine which sources bring paying customers and how MRR changes through new revenue, upgrades, downgrades, and churn. Visit Chartsy to connect your data, ask plain-English questions, and build a practical revenue attribution dashboard for your SaaS.
Made with Outrank app

Written by
Chartsy TeamAnalytics team at Chartsy
The Chartsy Team writes guides, product updates, and resources to help SaaS and eCommerce founders make sense of their metrics, without SQL or spreadsheets.
Chartsy
