
A high signup rate can hide a weak SaaS business. Visitors may create accounts because a message is attractive, a trial is easy to start, or a competitor comparison sends curious researchers your way. None of those events proves that your acquisition is producing paying customers or durable subscription revenue.
Signup to paid conversion tracking works only when it follows the complete path from visitor to account, from account to activation, and from activation to a verified billing event. The ratio of signups to payments is useful, but it isn't enough to explain which sources create MRR, which users become active, or why reported churn differs between billing systems.
Table of Contents
- Understanding the Signup to Paid Conversion Funnel
- Instrumenting Signup and Payment Events
- Stitching User Identity to Billing Records
- Attributing Marketing Sources to Revenue
- Building Funnels and Cohort Dashboards
- Troubleshooting Common Tracking Gaps
Understanding the Signup to Paid Conversion Funnel
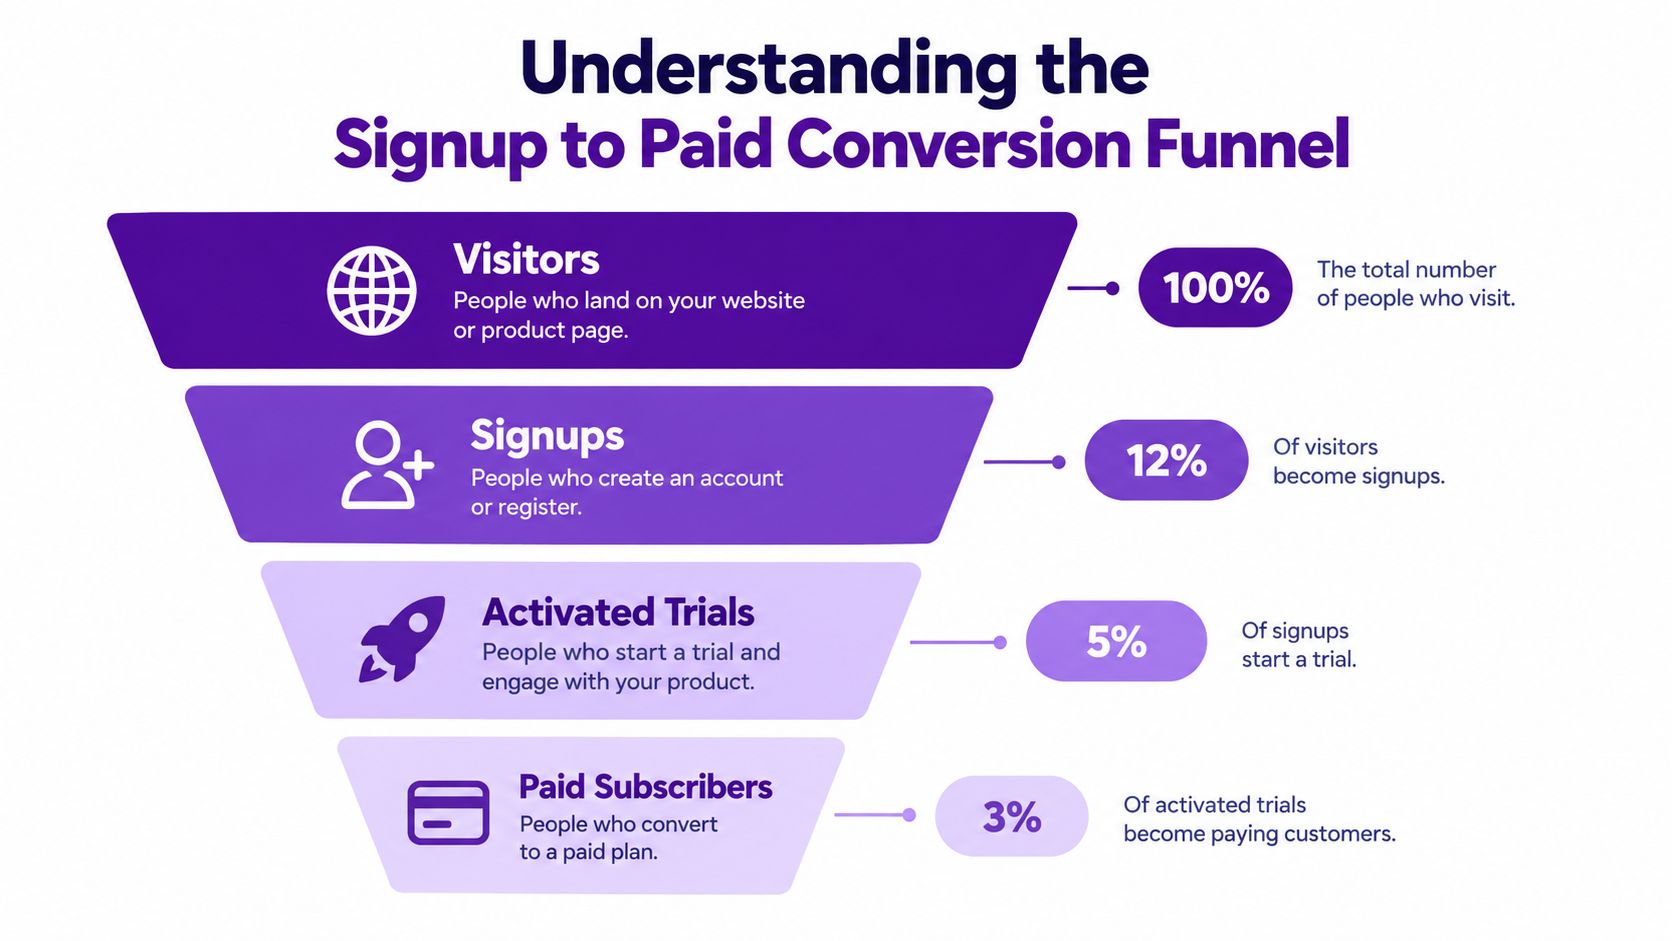
The common assumption is simple: divide paid customers by signups and call the result your conversion rate. That calculation can be directionally useful, but it hides three separate joins that behave differently.
The first join connects an anonymous visitor to the source that brought them to the site. The second connects that visitor to a known user when they create an account. The third connects the user to activation behavior and, later, to a confirmed subscription or invoice. If you skip any of these links, your dashboard may still show a percentage, but it won't reliably explain revenue.
Signup is an input, not an outcome
A signup tells you that someone took an initial step. Activation tells you that they reached a meaningful product experience, such as connecting a data source, publishing a report, or completing the core workflow. Paid conversion tells you that the billing system received and confirmed money. These events belong in the same funnel, but they shouldn't be collapsed into one event.
Activation is the strongest leading indicator in the middle of the journey because it separates casual exploration from product engagement. A source can produce many signups and few activated users, while another source produces fewer accounts that progress further. The second source may be more valuable even if its top-of-funnel conversion looks weaker.
A useful reporting model is:
- Acquisition: Which first-touch source brought the visitor?
- Signup: Which visitor became a known account?
- Activation: Which account completed the product's meaningful first action?
- Paid conversion: Which activated account generated a verified subscription event?
- Revenue quality: Which source contributed new MRR, expansion, or retained revenue?
This guide to SaaS funnel analytics covers the connection between visits, signups, and MRR in more detail.
Benchmarks depend on the motion
There isn't one useful SaaS signup-to-paid benchmark. A widely cited benchmark defines free-to-paid conversion within a six-month window and reports a median rate of 8% across products. It also reports 30% for free trials requiring a credit card, more than 5× the rate for trials without a card. Its ranges for products leading with a free trial are 4–6% for “good” and 10–15% for “great”, as documented in the SaaS conversion benchmark report.
Historical benchmark summaries show the same pattern from another angle. Opt-in trials with a required card are reported at 40–60%, opt-out trials without a card at 10–20%, freemium at 2–5%, and end-to-end conversion across pricing models at 0.2–1.5%. Another benchmark in that research stream reports a median trial-to-paid rate of 18.5% across more than 10,000 SaaS companies and 2.5 million trial users, with top performers reaching 35–45% or higher, according to this SaaS benchmark summary.
Treat these figures as context, not a target. A lower rate can reflect broader traffic or a low-friction trial, while a higher rate can reflect a credit-card gate that filters users before they enter the funnel.
Instrumenting Signup and Payment Events
Attribution breaks when teams treat signup and payment as two browser events. The signup often happens on one device, while checkout happens later on another. A user may also leave the product, return through a different campaign, or complete payment in a hosted billing flow that your marketing scripts can't observe reliably.
Capture the first pageview
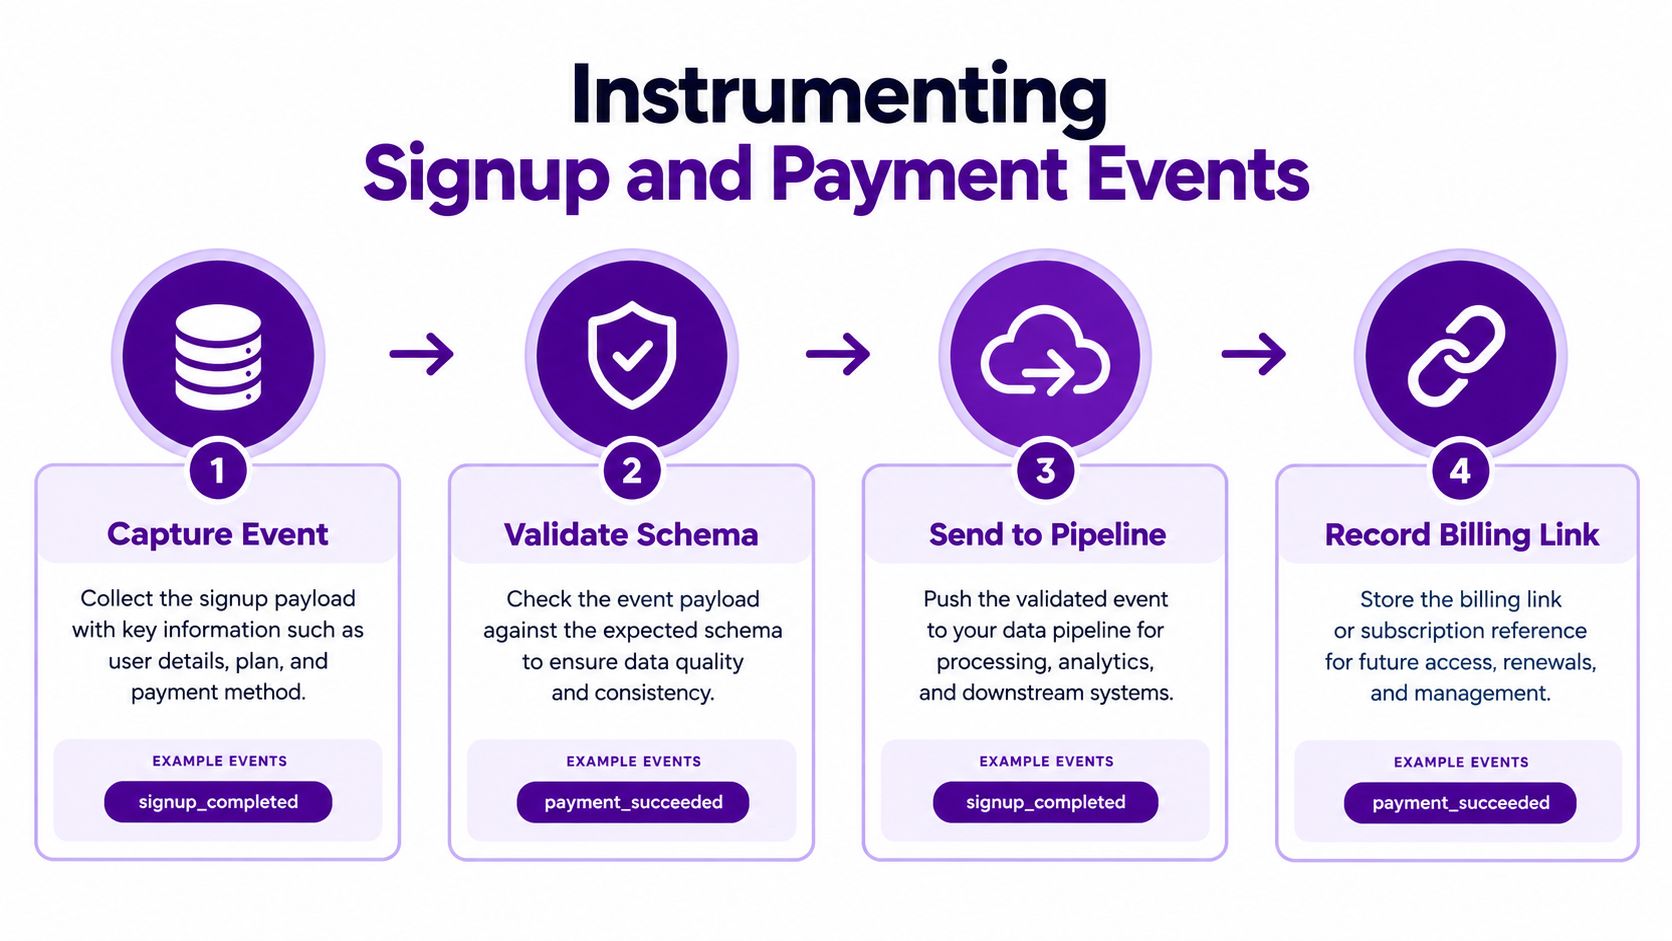
Store acquisition details as soon as the visitor arrives, not when they create an account. At minimum, preserve the original UTM parameters, referrer, landing page, and a durable visitor or session identifier. If the visitor moves through several pages before signup, the first-touch record should remain available rather than being overwritten by every later pageview.
A practical signup payload can include:
- Visitor identity: The first-party visitor or session ID.
- Acquisition context: Original UTM source, medium, campaign, term, and content where available.
- Referrer context: Referrer and landing page, with direct traffic represented explicitly rather than discarded without record.
- Account context: User ID, email hash or internal identity key, plan selection, and signup timestamp.
- Consent state: The product's applicable consent and tracking choices.
Use a stable internal schema. signup_completed should mean the account exists and passed your validation rules, not that someone merely clicked a button. Record the event once, make it idempotent, and retain the original acquisition values on the user record.
Confirm payment on the server
The payment event should come from the billing system after it confirms the charge, invoice, or successful subscription state. A client-side “upgrade complete” page can be useful for user experience, but it isn't a reliable revenue source. The user may close the page, payment may remain pending, or the browser may block the tracking request.
The implementation pattern documented in Clycyo's tracking documentation is straightforward:
- Save UTM and referrer data on the first pageview.
- Persist the visitor ID when the account is created.
- Identify the user once the email or internal account identity is known.
- Receive the billing confirmation through a server-side event.
- Join the payment or invoice event to the stored visitor ID.
Send a separate event such as payment_succeeded only after the billing provider confirms success. Keep payment status, currency, plan, customer ID, subscription ID, and event timestamp in the billing record. This gives you an auditable path from marketing source to signup to paid revenue, instead of a number that depends on whether a browser tab stayed open.
For the browser-side portion of the setup, see the signup tracking JavaScript documentation. The browser can capture the original context, but your server should remain the authority for revenue.
Stitching User Identity to Billing Records
The difficult part of SaaS attribution isn't collecting a UTM parameter. It's preserving identity while a person moves from anonymous browsing to an authenticated product account and then into a billing system.
Start with a first-party visitor identifier. Store it in a cookie or equivalent browser storage, then copy it to the internal user record at account creation. Once the user provides an email, identify the known account and retain the relationship between the anonymous visitor, user ID, workspace, and billing identity.

Use a durable identity graph
The identity graph should support more than one identifier because SaaS accounts rarely follow a single-person path.
- Application user ID: The primary identity inside your product.
- Workspace or organization ID: The commercial unit when several users share one subscription.
- Billing customer ID: The Stripe customer or Paddle customer record.
- Subscription ID: The specific recurring contract, especially when an account changes plans.
- Visitor ID: The original anonymous acquisition identity.
- Email identity: A useful bridge, but not always a safe primary key because addresses can change or be shared.
For Stripe, map the internal account to the Stripe customer ID and then to subscription and invoice events. For Paddle, map the account to the customer and subscription identifiers available in the relevant Paddle product. Keep the internal account ID in your own database even if the billing provider supports custom metadata. Provider IDs identify billing objects, but your account model should define which users and workspaces receive the revenue attribution.
Account for context switches
A mobile signup followed by desktop checkout should still resolve to one account. The same applies when a user signs in through SSO, joins an existing workspace, or invites a colleague who later becomes the person managing billing.
Don't create a new commercial identity every time a browser presents a new cookie. When authentication succeeds, associate the new device identity with the known user or workspace. When several users belong to one account, decide whether attribution belongs to the individual who first signed up, the workspace, or the billing owner. Document that rule before comparing channels.
Team accounts create another common error. If one person starts a trial and another person upgrades the workspace, a user-level join can appear to lose the original source. The workspace or organization ID should provide the shared key, while the originating user remains available for acquisition analysis.
Practical rule: Resolve identity at account creation, not at checkout. Payment is the final revenue event, not the moment to reconstruct the user's history.
The join should also tolerate delayed payment. A signup can remain unpaid while the user activates, returns later, and subscribes through a hosted billing page. Keep the original visitor and signup records immutable, then attach the confirmed billing event when it arrives.
Attributing Marketing Sources to Revenue
Last-touch attribution is tempting because it appears simple. A user visits from a retargeting ad, upgrades, and the ad receives credit. That may describe the final session, but it doesn't prove the ad created the demand or explain which source first brought the account into your product.
Store first-touch acquisition data on the visitor and preserve it through signup. You can still report last-touch or assistive touches separately, but don't overwrite the original source when the user returns through email, direct traffic, organic search, or a campaign reminder.
Keep the source record stable
Use a consistent UTM structure across paid, partner, content, and lifecycle campaigns. A campaign name should identify the initiative, while medium and content distinguish the channel and creative. Avoid changing naming conventions halfway through a reporting period because inconsistent labels create artificial source fragmentation.
Organic and direct traffic need explicit treatment. A return visit without a referrer shouldn't automatically replace a known original source with “direct.” If the first visit was organic and the user later types the URL into the browser, the original acquisition source can remain organic while the direct return is recorded as a later touch.
Separate the conversion states in your reports:
- Signup rate: Whether a source produces account creation.
- Activation rate: Whether those accounts reach a meaningful product event.
- Signup-to-paid rate: Whether the signup cohort later pays.
- Paid customer count: The number of customers attributed to the source.
- Revenue and MRR: The subscription value attached to those customers.
- Expansion and churn: Whether the source continues contributing value after the initial conversion.
UTM tracking for SaaS provides a practical reference for structuring campaign parameters and preserving source context.
Don't confuse attribution with causation
A source-to-payment join tells you that a customer who originated from a source later paid. It doesn't prove that the source alone caused the purchase. A founder may read an article, speak with sales, return through direct traffic, and then upgrade after a product session. The first-touch report and the last-touch report answer different questions.
For small teams, the useful question is often comparative: which sources produce activated accounts and recurring revenue at a quality that justifies more attention? That answer is stronger when the dashboard shows source, signup cohort, activation state, paid customer, and subscription revenue together.
Chartsy's Growth feature is one example of this approach. It connects website traffic and signup data with Stripe or Paddle billing records, and its source detail view can show visits, signups, paid customers, revenue, days to paid, and signup-to-paid conversion. It also supports analysis across Stripe, Paddle Billing, and Paddle Classic, giving teams a single place to inspect acquisition and subscription outcomes without maintaining a manual spreadsheet.
Building Funnels and Cohort Dashboards
A tracking pipeline becomes useful when it answers operating questions. Founders need to know whether MRR changed because new customers arrived, existing customers upgraded, customers downgraded, or subscriptions churned. Marketers need to know which sources produce paid accounts. Operations teams need to reconcile those views without rebuilding the same report every month.
Start with a dashboard that separates the funnel from the revenue bridge. The funnel should show visitor source, signup, activation, and paid conversion. The revenue view should show customer growth, MRR, subscription movements, and churn. Combining both into one headline number makes it harder to identify whether the issue is acquisition quality, activation, pricing, or retention.
Build cohorts around decisions
A useful cohort starts with a clear date and identity. Group accounts by signup month or week, then segment by original source, plan, country, or product motion. Follow each cohort from signup through activation, payment, expansion, contraction, and churn.
A source that produces immediate subscriptions may not produce the strongest retained revenue. Conversely, a source with a slower path to paid may attract accounts that expand after adoption. Keep those outcomes visible instead of judging every channel by its first conversion event.
A practical dashboard can include:
- Acquisition table: Source, campaign, visits, signups, activated accounts, and paid customers.
- Conversion view: Signup-to-paid conversion by signup cohort, not just by payment date.
- MRR bridge: New revenue, upgrades, downgrades, and churn as distinct movements.
- Customer view: Plan, billing provider, workspace, signup source, and current subscription state.
- Cohort table: Revenue and customer status by signup period and acquisition source.
- Exception list: Paid events without a matched signup, duplicate billing IDs, and accounts with missing source data.
Plain-English AI analysis can reduce the time needed to interrogate those views. A founder might ask, “Which blog post brought the most paid customers?” A more useful question is, “Which blog post brought activated customers that later contributed expansion MRR?” The answer should be treated as an analytical finding to investigate, not proof that the post alone caused the expansion.
The same principle applies to churn. A dashboard can show that customers from a source churned more often, but it can't know why they canceled unless the product captures a reliable cancellation reason or customer feedback. Separate the observed movement from the explanation.
Chartsy lets small teams connect website acquisition with subscription data, analyze MRR and customer growth, save charts to dashboards, and ask questions in plain English without writing SQL. It fits teams that need source-to-revenue reporting across supported billing systems but don't want to maintain a full BI pipeline.
For a visual walkthrough of the dashboard approach, use the following product video.
Troubleshooting Common Tracking Gaps
A dashboard can be technically consistent and still disagree with your billing provider. The reason is often a definition mismatch, not a broken query. Stripe and Paddle make different decisions about what counts as MRR and when a cancellation becomes churn, so teams must document provider-specific rules before comparing reports.
Stripe Billing defines MRR as the monthly-normalized value of active and past_due subscriptions. It excludes taxes, free plans, and metered products, and treats a canceled or unpaid subscription as churn that no longer counts toward MRR, according to Stripe's subscription analytics documentation.
Paddle also describes MRR as monthly revenue from active subscriptions, but its churn timing differs. Paddle counts a customer as churned when the paid period ends, rather than when the customer clicks cancel, as explained in Paddle's subscription metrics documentation.
| Scenario | Stripe Billing Behavior | Paddle Behavior |
|---|---|---|
| Customer clicks cancel before the paid period ends | The subscription can stop counting as churn under Stripe's stated treatment when it is canceled or unpaid. | The customer is counted as churned when the paid period ends, not at the cancellation click. |
| Subscription is unpaid | It is treated as churn and no longer counts toward MRR. | Use Paddle's subscription state and paid-period timing when determining the reporting month. |
| Taxes | Excluded from MRR. | Apply the billing system's documented revenue definition rather than assuming tax-inclusive MRR. |
| Free plans | Excluded from Stripe MRR. | Keep free plans separate from paid subscription MRR. |
| Metered products | Excluded from Stripe MRR. | Don't force usage-based revenue into a normalized subscription metric without a defined rule. |
| Customer signs up and churns in the same calendar month | Check your cohort and churn rules explicitly. | Paddle's ProfitWell Metrics documentation says the customer is ignored from metrics entirely in this situation. |
Fix the join before fixing the chart
When signup-to-paid conversion looks wrong, inspect the raw relationships first. Look for paid customers without a stored visitor ID, billing events attached to the wrong workspace, multiple subscriptions mapped to one account, and payment events that were recorded from a browser success page instead of a verified provider event.
Then check time zones and cohort dates. A signup may occur late in one reporting period while the invoice arrives in the next. A Paddle cancellation may appear in a later churn month than the cancellation action, while Stripe's treatment can remove the subscription from MRR earlier. If your dashboard uses a single universal churn date, it will disagree with at least one provider.
Paddle's ProfitWell Metrics documentation adds another important edge case: when a customer signs up and churns in the same calendar month, the customer is ignored from metrics entirely, so new revenue and churn aren't inflated. This rule appears in Paddle's comparison of ProfitWell and Stripe metrics.
Use this troubleshooting checklist before changing campaign decisions:
- Match identifiers: Confirm that every paid event maps to the intended user or workspace.
- Verify event authority: Accept revenue only from confirmed billing events.
- Document MRR rules: Record how each provider handles taxes, free plans, metered products, cancellations, and unpaid accounts.
- Separate dates: Store signup date, activation date, payment date, cancellation date, and paid-period end date independently.
- Audit unmatched records: Review missing visitor IDs and duplicate customer or subscription IDs.
- Compare like with like: Don't compare Stripe MRR to Paddle MRR until their definitions and timing rules are normalized.
Chartsy connects website visits and signups with Stripe, Paddle Billing, and Paddle Classic data so small SaaS teams can trace acquisition through paid customers, MRR, and churn in one workflow. Visit Chartsy to examine your signup-to-paid joins and build a revenue dashboard around the billing events your business receives.

Written by
Chartsy TeamAnalytics team at Chartsy
The Chartsy Team writes guides, product updates, and resources to help SaaS and eCommerce founders make sense of their metrics, without SQL or spreadsheets.
Chartsy
