
You open your billing dashboard and see that MRR is up. That should be good news, but it doesn't answer the questions that shape your next decision. Did new customers drive the increase, did existing accounts upgrade, or did one annual plan distort the picture? Which marketing source brought those customers in?
Freemius analytics can answer many product and billing questions, especially for WordPress software businesses using Freemius's native SDK. But SaaS founders eventually face a separate problem. A billing dashboard can show what happened after payment, while growth decisions depend on knowing where paying customers and recurring revenue came from.
Table of Contents
- The Core SaaS Metrics You Actually Need to Track
- What Freemius Analytics Actually Measures
- The Opt-In Telemetry Gap in Audience Data
- Billing Metrics vs True Revenue Attribution
- Building a Modern SaaS Analytics Stack
- Choosing the Right Analytics Approach for Your Stage
The Core SaaS Metrics You Actually Need to Track
A founder checks the billing total on Monday and sees a higher number than last month. The natural reaction is to call it growth. A more useful reaction is to decompose the movement before changing the marketing budget, pricing page, or product roadmap.
Monthly Recurring Revenue, or MRR, represents the recurring subscription revenue associated with active customers, normalized to a monthly view. The exact definition can vary by platform. For example, Stripe's documented MRR calculation includes active and past-due subscriptions, while excluding taxes, free plans, and metered products, as described in this Stripe analytics overview. The important operational point is consistency. If the definition changes between reports, the trend becomes difficult to trust.
Read the movement, not just the total
A useful MRR bridge separates four movements:
- New revenue: Subscription revenue from customers who started paying during the period.
- Expansion: Additional recurring revenue from upgrades, added seats, or higher usage.
- Contraction: Recurring revenue lost when customers downgrade or reduce usage.
- Churn: Recurring revenue lost when customers cancel.
This view tells a very different story from a single top-line number. Suppose new revenue is healthy but churn and contraction are also rising. Acquisition may be working, yet the product or pricing model may be failing to retain the customers being acquired. Conversely, modest new sales combined with strong expansion can indicate that the existing customer base is finding more value.
Practical rule: Never ask only whether MRR increased. Ask which movements produced the change and whether those movements are repeatable.
Churn rate describes the portion of customers or recurring revenue lost during a period. Customer churn and revenue churn aren't interchangeable. Losing a small account and losing a large account may produce the same customer count movement but very different financial outcomes.
Lifetime Value, or LTV, estimates the value a customer contributes over the relationship. Treat it as a decision aid, not a precise promise. LTV becomes useful when you compare customer value across plans, acquisition sources, or cohorts using the same calculation method.
Cohorts expose retention quality
A cohort groups customers by a shared starting point, such as signup month, first payment month, plan, or acquisition source. Instead of asking whether the entire customer base is retaining, you can ask whether customers who arrived through a particular campaign continue paying after the initial purchase.
That distinction separates actionable analytics from vanity metrics. Page views, total signups, and trial starts can indicate attention, but they don't show whether a channel creates durable subscription revenue. A founder choosing between two campaigns needs the connection between source, first payment, expansion, and churn. The SaaS metrics guide provides a useful reference for organizing that measurement model.
What Freemius Analytics Actually Measures
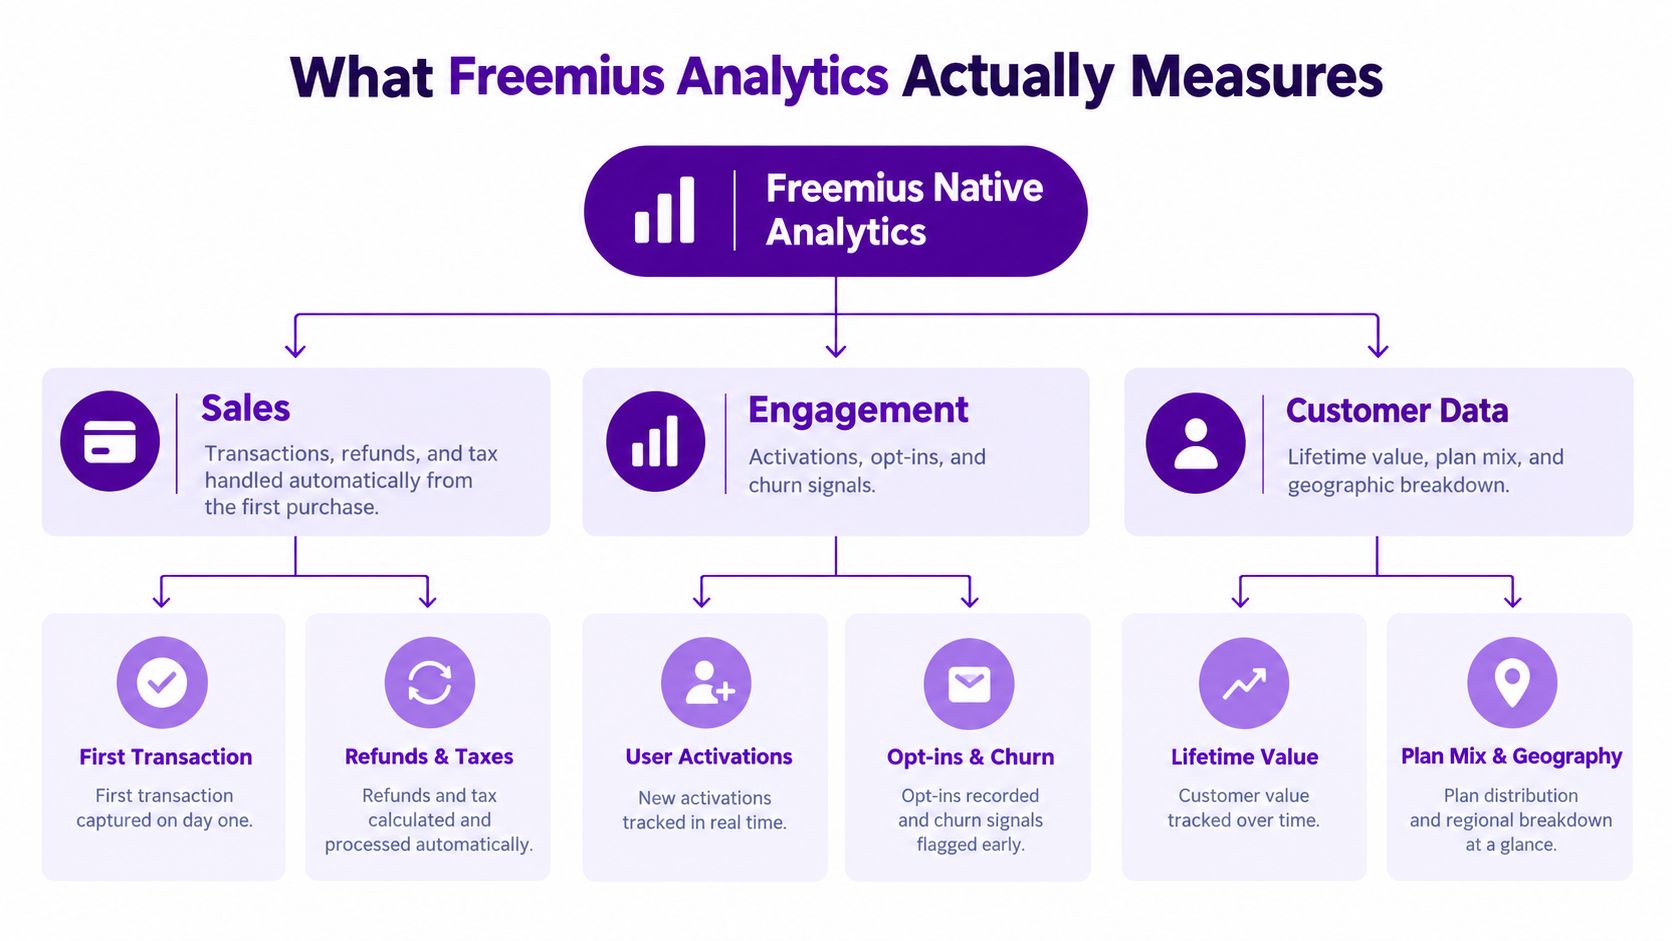
Freemius is strongest when the question concerns a product sold through its own monetization and SDK environment. Its analytics is built into the platform, and payment data starts collecting from the first transaction rather than requiring a separate analytics setup. That gives a developer an immediate view of subscription activity and product-level behavior in one system.
The sales dashboard includes Net Revenue, Monthly Recurring Revenue, Lifetime Value, conversion rate, upgrades, subscriptions, cancellations, refunds, chargebacks, and trials. It also provides country-level payment distribution and filters for dates, plans, billing cycles, license counts, currencies, and foreign-exchange conversion. These filters matter because a total revenue line can conceal a plan-mix change or a market-specific shift.
Sales reporting is the convenient part
Freemius also exposes metrics such as average order value, gross volume, renewals, trial conversions, refunds, and chargebacks. A small software team can use these views to investigate whether a billing change affected upgrades, whether trials convert, or whether refunds are concentrated in a particular plan or country.
The platform automatically captures data from opted-in users or active installations after the SDK is integrated. Its user and website views can include email address, verified-email status, name, payment history, registration date, website details, licenses, triggered events, and webhooks. That level of customer detail can help a product owner connect a support issue or license event with a specific account.
For WordPress products, the product telemetry is unusually specific. Freemius tracks active sites, opted-in sites, opted-in users, users who skipped opt-in, sites that uninstalled, WordPress and PHP version distributions, and locale-language segmentation. A plugin developer can therefore compare product adoption with technical environments, rather than treating every installation as an anonymous row in a spreadsheet.
Product usage is where Freemius stands out
The audience view adds time-series measures such as effective growth, new activations, deactivations, new users, and total installations. Freemius's documentation also records a notable behavior pattern: 20% of users who install a WordPress product abandon it in under 15 minutes, while 82% of uninstallers share a reason for leaving. Those figures are documented in the Freemius user data documentation, and they illustrate the practical value of early product feedback.
This information works well for questions such as:
- Onboarding: Which users activate and then disappear quickly?
- Compatibility: Are uninstallers concentrated around particular WordPress or PHP versions?
- Product positioning: Do users on a free plan engage with the product before upgrading?
- Support: Do deactivation and uninstall events coincide with specific product issues?
The trade-off is scope. Freemius can give a WordPress product team a rich view of what happens inside the product and after payment. It doesn't, from the documented analytics surface, establish which article, ad campaign, or website source produced the customer before the transaction. The Freemius data source documentation is useful when evaluating how Freemius data can participate in a wider reporting workflow.
The Opt-In Telemetry Gap in Audience Data
Opt-in telemetry is valuable, but it isn't the same as a census of every user or installation. Freemius states that its WordPress audience and user data comes from active and opted-in installations, and that the insights dashboard is built from users who opt in. That distinction should sit next to every audience chart.
The dashboard separates opted-in users from users who skipped opt-in. It also tracks active sites, deactivations, and uninstalls. Those categories make the missing portion visible, but visibility of the gap doesn't automatically tell you how large its analytical effect is.
What the data can reveal
Opt-in telemetry can show patterns that are otherwise difficult to observe. It can identify rapid abandonment, provide uninstall reasons, and expose differences between technical environments or language segments. The documented figures are particularly useful for prioritizing investigation, since 20% of users who install a WordPress product abandon it in under 15 minutes, and 82% of uninstallers share a reason according to Freemius's audience data documentation.
Those observations can guide onboarding experiments. If users leave soon after installation, a team can inspect setup friction, documentation, activation prompts, or compatibility. If users provide uninstall reasons, the team has qualitative evidence for deciding which problems deserve attention first.
They still don't prove what all users experience. Users who skip opt-in remain outside the corresponding telemetry view, so an observed pattern among opted-in users may not represent the entire install base. The available documentation doesn't clearly explain how to estimate bias, missingness, or conversion lift caused by the users who remain unobserved.
What Freemius can show: Behavior among active and opted-in installations.
What it can't establish on its own: The complete funnel from every installation to engagement, payment, and retention.
Why this matters for SaaS reporting
A SaaS operator may compare installations with paid conversions and assume the difference represents a product conversion rate. That calculation becomes fragile if the installation denominator is based on opt-in telemetry while payment data covers transactions captured through the billing system.
The issue isn't that opt-in tracking is useless. It is that teams need to label the population correctly. Use it to analyze opted-in product behavior, early abandonment, technical distributions, and feedback. Don't treat it as a complete measure of total acquisition or as proof that a product change increased overall conversion.
For total-funnel reporting, billing data and website events need their own consistent definitions. The team should know which users are represented, which events are missing, and whether a change in opt-in behavior could look like a change in product performance.
Billing Metrics vs True Revenue Attribution
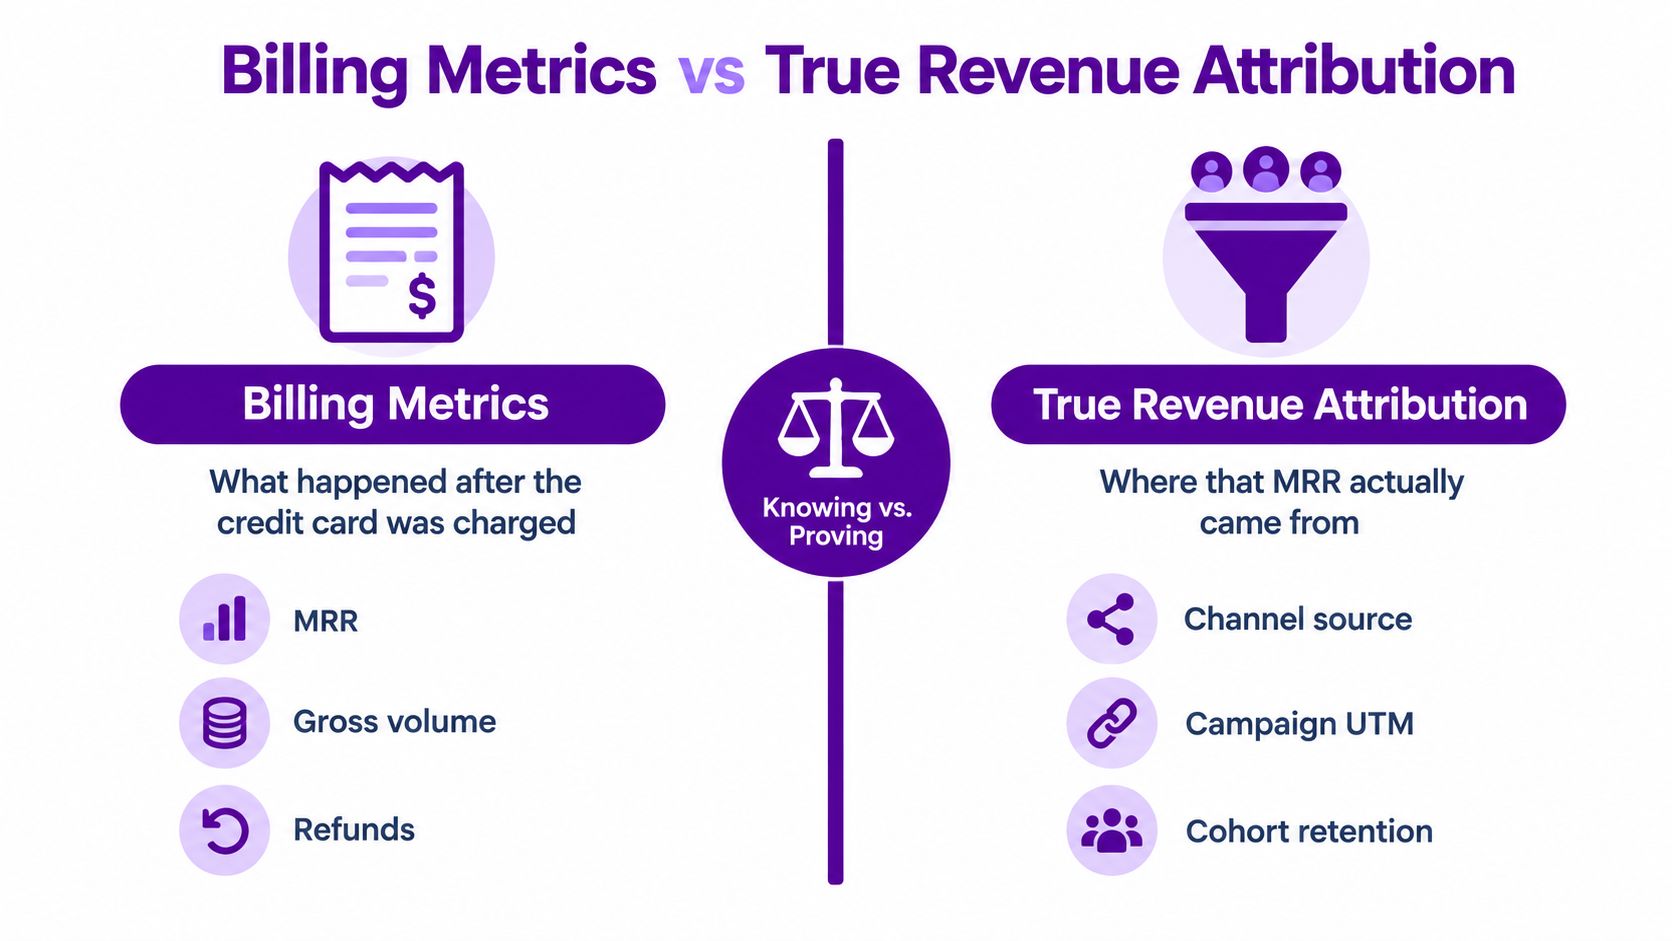
Billing analytics answers a concrete question: what happened after a customer entered the payment system? It can show MRR, refunds, renewals, chargebacks, plan mix, and trial conversion. Those metrics are essential for operating subscriptions, but they don't identify the marketing activity that created the customer unless the billing record is connected to pre-sale acquisition data.
Revenue attribution starts earlier. It links a website visit or signup with a source, campaign, landing page, and eventual payment. The objective isn't to claim that one page caused a purchase with certainty. The objective is to make the customer's path visible enough to compare channels and investigate which sources are associated with paying customers and recurring revenue.
Two dashboards can still leave one unanswered question
Consider a SaaS founder who sees MRR growth in a billing dashboard and traffic growth in a web analytics tool. The first system knows the customer paid. The second knows that visitors arrived from search, paid campaigns, referrals, or direct traffic. If those systems don't share an identifier or event history, the founder can't reliably compare source-level recurring revenue.
This is the practical divide:
| Billing analytics | Revenue attribution |
|---|---|
| Shows MRR and transaction activity | Connects sources with signups and paying customers |
| Explains refunds, renewals, and chargebacks | Shows which channels are associated with recurring revenue |
| Filters by plans, billing cycles, or geography | Filters by campaign, landing page, source, and cohort |
| Starts with the commercial event | Follows the path into the commercial event |
Freemius's built-in analytics is useful for the left side of that table. Its documented sales views combine billing and product reporting without requiring a separate business intelligence setup. The gap appears when a team wants to allocate marketing effort based on the source of subscription revenue rather than the amount of traffic or the number of signups.
Attribution still requires judgment
A source-to-revenue report isn't proof of causation. A customer may visit through search, return directly, read an email, and then pay after speaking with sales. Tracking can help teams compare observed paths, but it can't turn every multi-step decision into a certain explanation.
That limitation doesn't make attribution unhelpful. It makes disciplined interpretation necessary. Compare sources using the same date range and customer definition. Review MRR movement alongside the acquisition source. Check whether a channel brings customers who expand, contract, or churn rather than judging it only by first payment.
A platform that only records billing events won't answer those acquisition questions by itself. Teams may need to join website, signup, and payment data manually, build a warehouse, or use a SaaS analytics product designed around that connection.
The practical comparison is covered in more detail in this guide to SaaS revenue attribution. The right tool depends on whether the business primarily needs product telemetry, subscription operations, or a combined view of acquisition and recurring revenue.
Building a Modern SaaS Analytics Stack
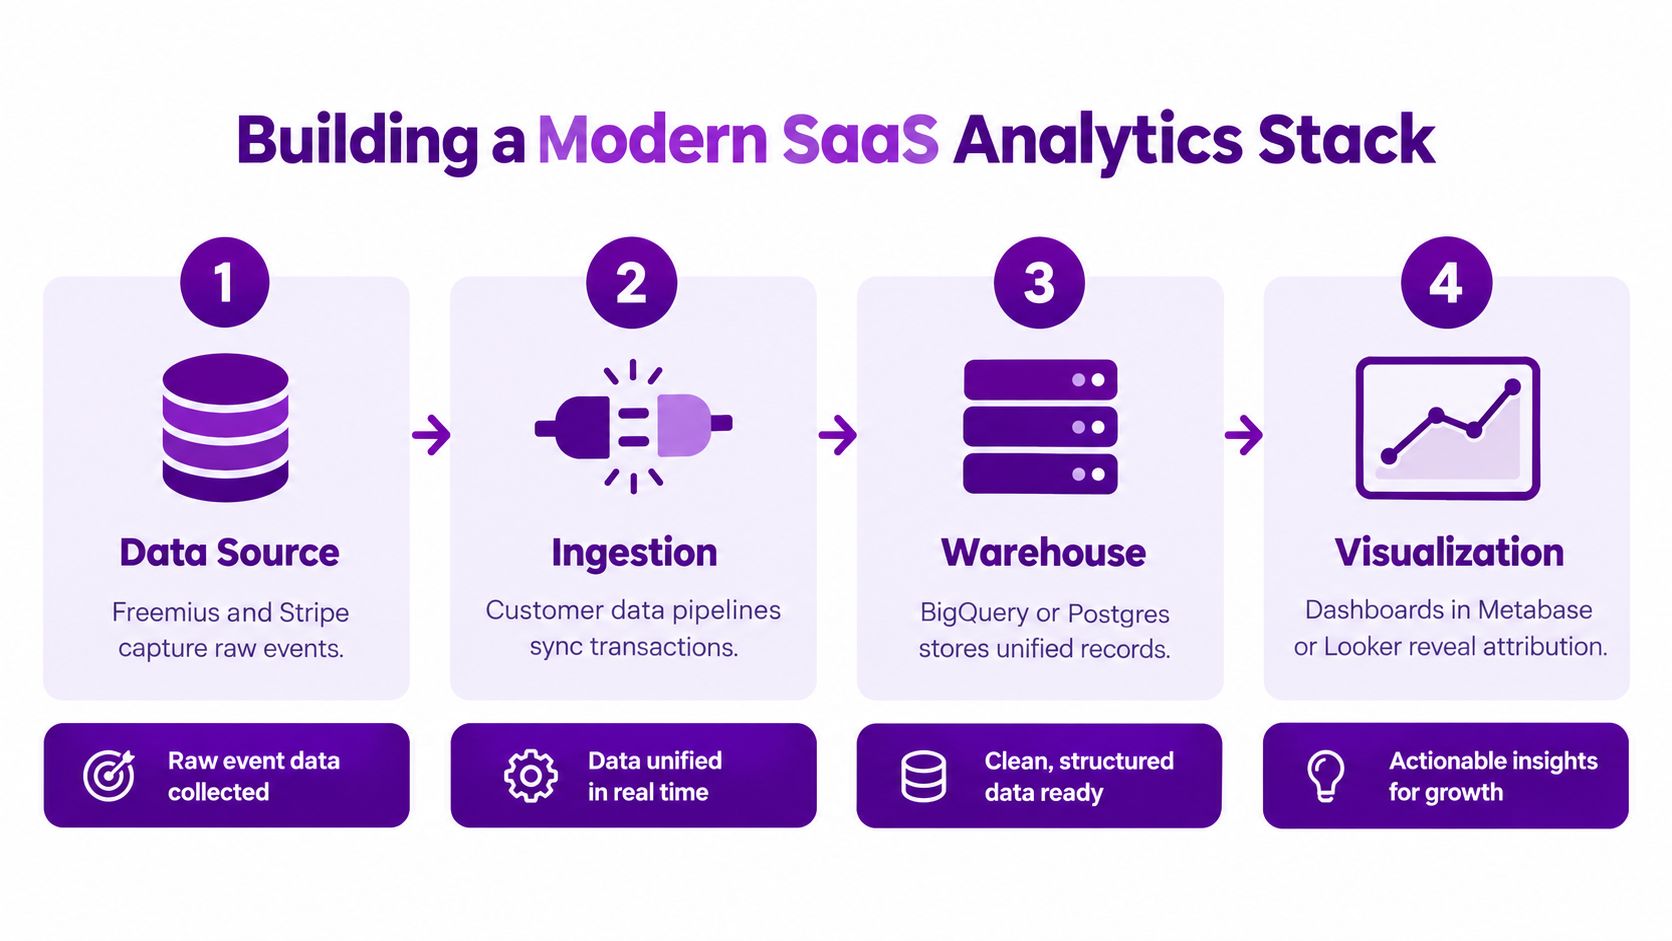
A small SaaS team doesn't need to build a large data department before it can answer basic growth questions. It does need clear ownership for each data layer and a reporting process that distinguishes source records from interpretation.
Start with billing as the financial record
Use Stripe or Paddle as the source of truth for subscription transactions, depending on the payment architecture your SaaS already uses. Paddle's Metrics product is included with Paddle Billing and provides subscription analytics, benchmarks, and churn reports, according to this Paddle Metrics reference. Paddle also positions its platform for SaaS and software businesses selling globally.
For teams using Freemius, Freemius can remain the operational source for its own billing and product events. The key is to define which system owns each metric and avoid adding the same revenue movement together twice.
Connect acquisition events
The next layer captures website visits, signups, campaign parameters, and the transition to a paying account. Keep the event vocabulary small enough that a solo founder can maintain it. A consistent signup event is more valuable than a large tracking plan that nobody audits.
A read-only connection to billing data reduces operational risk. The analytics layer should inspect transactions and subscriptions without changing products, prices, customers, or billing state. This arrangement also makes it easier to investigate reports without turning every analysis into an engineering task.
Use a revenue bridge for weekly review
Break each MRR change into new revenue, expansion, contraction, and churn. Then segment the bridge by plan, country, customer cohort, or acquisition source where the data supports it. This shows whether growth came from more customers, larger accounts, retained customers, or a temporary billing effect.
The SaaS quick ratio provides one compact way to compare positive and negative recurring movements. Stripe's documented formula is:
(New MRR + Expansion MRR) ÷ (Churn MRR + Contraction MRR)
The component definitions matter. New MRR comes from first-time paying customers, Expansion MRR from upgrades or added usage, Churn MRR from cancellations, and Contraction MRR from downgrades or reduced usage, as explained in this SaaS financial metrics guide. Use the ratio as a directional health measure, not as a replacement for examining the underlying customer movements.
Give non-analysts a usable interface
A dashboard should answer recurring operating questions without requiring a SQL query each time:
- Acquisition: Which sources brought paying customers during the selected period?
- Revenue: What caused the change in MRR, new sales, upgrades, downgrades, or cancellations?
- Retention: How do cohorts behave after signup or first payment?
- Operations: Which plans, countries, and customer groups need investigation?
- Reporting: Can the team save the view and return to it next week?
Plain-English analysis can help founders explore these questions, especially when the result can be turned into a chart or table and saved to a shared dashboard. It doesn't remove the need to define metrics carefully. It lowers the effort required to ask follow-up questions and inspect a result.
Choosing the Right Analytics Approach for Your Stage
Freemius native analytics is a reasonable fit when the business is primarily a WordPress product business and the main questions concern installations, opt-ins, upgrades, cancellations, technical environments, and product feedback. Its built-in sales and usage views reduce setup work and give a small team meaningful product telemetry quickly.
The case for a separate SaaS analytics and attribution layer becomes stronger when marketing decisions depend on source-level recurring revenue. If the team needs to connect website traffic and signups with Stripe, Paddle Billing, or Paddle Classic subscriptions, a billing-only dashboard leaves too much of the customer journey outside the report.
Use this decision test:
- Choose native reporting first when product usage and billing operations are the immediate priorities.
- Add attribution reporting when traffic and signup data are disconnected from paying customers.
- Add cohort and MRR movement analysis when the top-line total no longer explains growth quality.
- Prefer read-only billing connections when the analytics tool should inspect data without changing billing records.
- Choose plain-English reporting when founders and operators need answers without maintaining SQL or a large BI stack.
The important distinction is not whether Freemius analytics is useful. It is whether its scope matches the decision you need to make. Product telemetry explains behavior inside the product, billing metrics explain commercial events, and cross-domain attribution helps connect those events to acquisition.
Chartsy connects website visits and signups with Stripe, Paddle Billing, and Paddle Classic subscription data, helping small SaaS teams analyze paying customers, MRR movements, churn, and source-level revenue in one workspace. Visit Chartsy to explore a read-only analytics workflow with plain-English questions, saved charts, and dashboards built for teams without a dedicated analyst.

Written by
Chartsy TeamAnalytics team at Chartsy
The Chartsy Team writes guides, product updates, and resources to help SaaS and eCommerce founders make sense of their metrics, without SQL or spreadsheets.
Chartsy
