
You've got a billing database, a spreadsheet export, or a set of invoices that tells you how much money came in. But when MRR falls, that data often won't tell you whether customers canceled, downgraded, failed to renew, or were just billed on a different schedule. New signups may be increasing while recurring revenue weakens, and a total-revenue report can hide the reason.
That gap is the central challenge in subscription analytics for custom billing. The difficult part isn't drawing another dashboard. It's defining what each billing event means, keeping customer identities stable, and separating recurring revenue from one-time charges. Once those foundations are reliable, founders and small teams can connect marketing sources to paying customers, explain MRR movements, and investigate churn without rebuilding a report by hand every month.
Table of Contents
- The Problem with Manual Revenue Reporting
- Understanding Custom Sources in Chartsy
- Structuring Your Billing Data for Accurate Metrics
- The API Workflow for Direct Invoicing
- Questions You Can Answer Once Connected
The Problem with Manual Revenue Reporting
A founder at a software business that invoices customers directly might start each month with a spreadsheet of paid invoices. The sheet contains customer names, invoice dates, payment amounts, and perhaps a plan description. It can answer a basic question, such as how much cash the business collected, but it struggles with a more useful one: why did recurring revenue change?
Suppose a customer paid an annual contract in January. Another customer upgraded in February, while a third canceled halfway through a billing period. If the report assigns revenue to payment dates, January looks unusually strong and later months look weaker than the underlying subscription base. If the report treats every invoice as recurring, setup fees and implementation charges inflate MRR. If customer names differ between the CRM and billing system, marketing attribution breaks before it reaches the revenue report.
Cash collected, invoiced revenue, and recurring revenue are different measures. Stripe's definition of MRR illustrates the distinction by using the monthly-normalized value of active and past-due subscriptions, while excluding taxes, free plans, and metered or usage-based products. Its rules also treat a subscription as churned when it's canceled or marked unpaid. Stripe's subscription analytics documentation provides a useful reference point for deciding which billing records belong in an MRR calculation.
Why totals conceal the movement
A healthy subscription report needs to explain the bridge between two periods. That means distinguishing:
- New MRR, created by newly paying customers.
- Expansion MRR, created when existing customers upgrade or add quantity.
- Contraction MRR, caused by downgrades or reduced quantity.
- Churned MRR, lost when a subscription ends or becomes unpaid.
- Reactivated MRR, returned when a former customer starts paying again.
A single “revenue this month” column can't provide that explanation. It also won't show whether a marketing source produces customers who stay subscribed or merely generates signups.
Subscription businesses have grown faster than traditional product-based businesses in Zuora's Subscription Economy Index. The index reports 17.5% compound annual revenue growth from 2012 through 2021 for subscription companies, compared with 3.8% for the S&P 500, a difference described as a 4.6-times faster rate. The reported Subscription Economy Index figures help explain why recurring-revenue measurement deserves its own operating discipline rather than a monthly spreadsheet exercise.
For broader context on designing recurring-revenue reports, Suby's guide to unifying revenue data is a useful companion. The practical conclusion is simple: if your data model doesn't identify lifecycle movements consistently, no visualization tool can reconstruct them reliably. A more detailed overview of the metrics is available in Chartsy's subscription analytics guide.
Understanding Custom Sources in Chartsy
A Custom Source is a data connection for billing information that doesn't arrive through one of the platform's native integrations. Instead of granting read-only access to a supported billing provider, your system prepares billing records and sends them to the Custom API using the required data model.
That distinction matters. Stripe, Paddle Billing, Paddle Classic, and Freemius have native integrations, so businesses using those systems don't need to build this custom route. A company with its own invoicing ledger, a niche payment gateway, or an unsupported provider does need to implement the pipeline. The API doesn't automatically discover every billing system or translate arbitrary invoice fields into subscription events.
When the custom route makes sense
A Custom Source is usually worth considering when:
- Your billing system is authoritative. Your internal ledger already records subscriptions, renewals, upgrades, and cancellations, and replacing it would create more operational risk than maintaining an export.
- Your provider isn't natively supported. You need to preserve the current payment workflow while making its data available for acquisition and revenue analysis.
- You invoice customers directly. Enterprise contracts, purchase orders, and manually issued invoices may not produce the same event records as a self-serve checkout.
- You need a stable analytical layer. A normalized feed can make different billing records comparable without forcing the billing system to change.
The trade-off is implementation effort. Someone must map the source fields, define event semantics, generate payloads, handle retries, and reconcile what was sent against the original ledger. That work is worthwhile when the billing system is likely to remain in place. If the business is still choosing its payment provider and a native integration meets its needs, switching to a supported provider may be simpler than maintaining a custom connector.
The Custom Source documentation is the right place to check the implementation model before committing engineering time. For teams working across several disconnected systems, this practical guide to disparate data sources also offers useful context on why field consistency matters before analysis begins.
The key decision isn't whether an API can accept data. It's whether your team can define the commercial events behind that data clearly enough to maintain trustworthy MRR and churn reporting.
Structuring Your Billing Data for Accurate Metrics
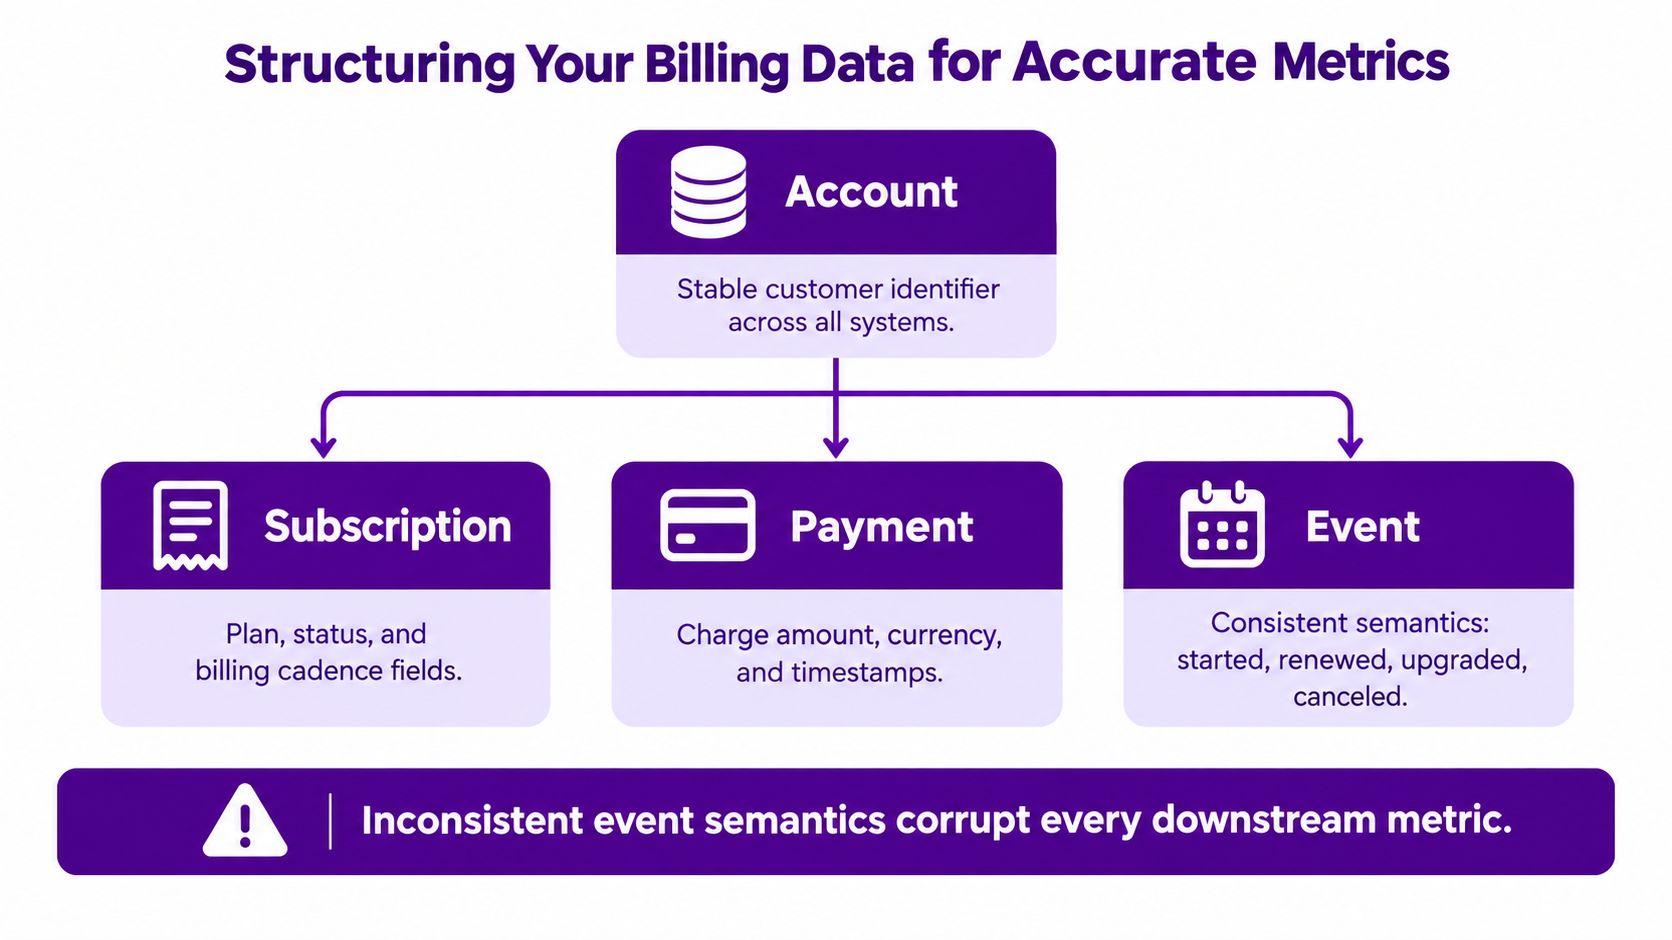
Better charts can't repair inconsistent event semantics. If one system labels a downgrade as a cancellation and replacement, while another labels it as a subscription update, the dashboard may report churn followed by new MRR even though the customer just changed plans.
Start with two stable identifiers: a canonical customer ID and a canonical subscription ID. The customer ID should remain consistent across the website, CRM, internal ledger, and analytics system. The subscription ID should identify the recurring contract or subscription lifecycle, not an individual invoice or payment attempt. A retry must not create a new customer, and a replacement invoice must not create a second subscription unless the commercial relationship changed.
Build a provider-neutral event ledger
For custom billing, implement a cohort-first data model rather than calculating retention from blended monthly totals. The common ledger should contain at least:
- Identity: customer ID and subscription ID.
- Commercial terms: plan, quantity, currency, billing interval, and recurring amount.
- Timing: event timestamp, service period, cancellation-request date, and effective service-end date.
- State: subscription status and event type.
- Revenue treatment: recurring versus one-time classification, plus discounts, tax, refunds, and credits where applicable.
- Reliability fields: an immutable event timestamp and a deduplication key.
This model follows the practical approach described in Lago's subscription analytics guidance. Assign a cohort from the first subscription start date, not the first successful payment. Retries, migrations, and delayed collections can otherwise place a customer in the wrong acquisition month.
Annual plans need normalization too. If a customer signs an annual contract, divide the contracted recurring value by twelve when calculating monthly recurring value. The payment may arrive as a single cash event, but the service represents a recurring commitment over the contract period. Without normalization, the report confuses billing cadence with business growth.
Define what each event changes
A plan update might increase recurring amount, reduce it, or leave it unchanged. A cancellation request might take effect immediately or at the end of the paid service period. A failed payment might begin a recovery process rather than represent final churn. A pause may stop billing temporarily without representing a permanent customer loss.
Write these rules down before sending data. For each event, specify the effective date, the subscription status after the event, and whether the event changes MRR, logo retention, revenue retention, or only payment status.
Practical rule: Use the effective service-end date for customer loss, not automatically the timestamp of a failed payment or cancellation request.
A cohort matrix should be left-justified by month of customer age. Month-three retention should compare customers who have reached the same lifecycle age, rather than mixing a new calendar month with mature subscriptions. Track both logo retention and revenue retention. Logo retention measures active customers from the cohort, while gross revenue retention excludes expansion and net revenue retention includes expansion, contraction, and reactivation.
For a useful custom export, preserve at least 12 to 18 months of customer-level MRR history, as recommended in the cohort modeling guidance from Lago. That history gives the retention view enough context to distinguish a recent cohort problem from a temporary monthly fluctuation.
The API Workflow for Direct Invoicing
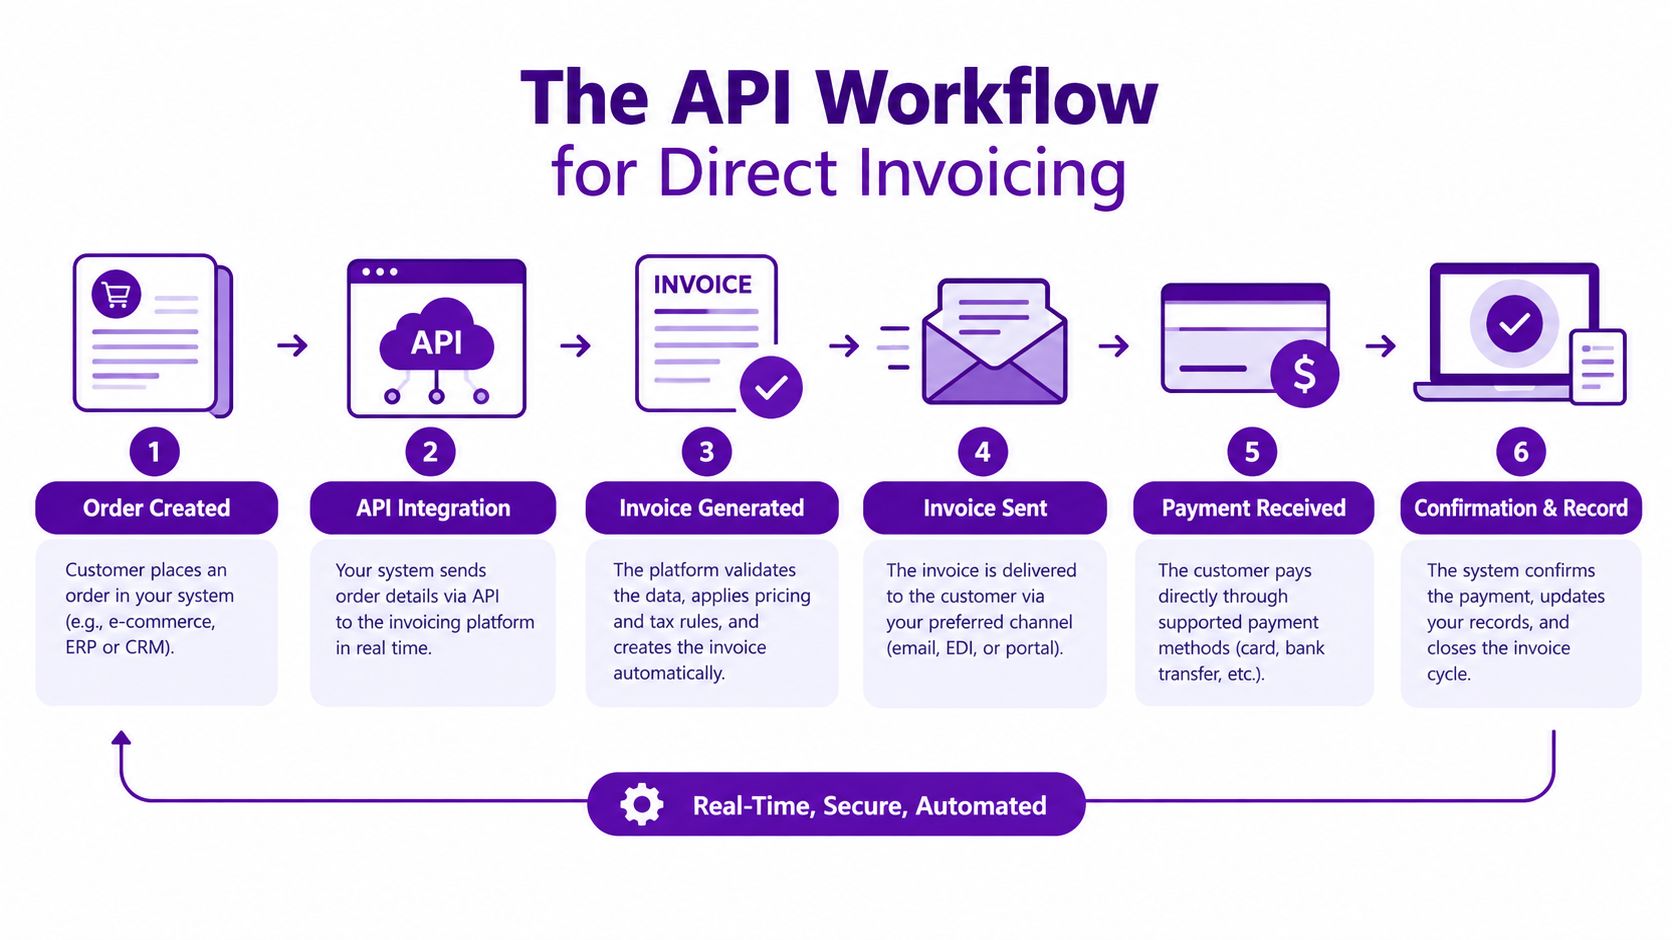
Consider a hypothetical software business that sells workflow software to enterprise customers and invoices them directly. Its internal system stores contracts, invoice records, payment status, plan changes, and cancellation requests. The company doesn't need to replace that billing system. It needs to create a dependable analytical feed from it.
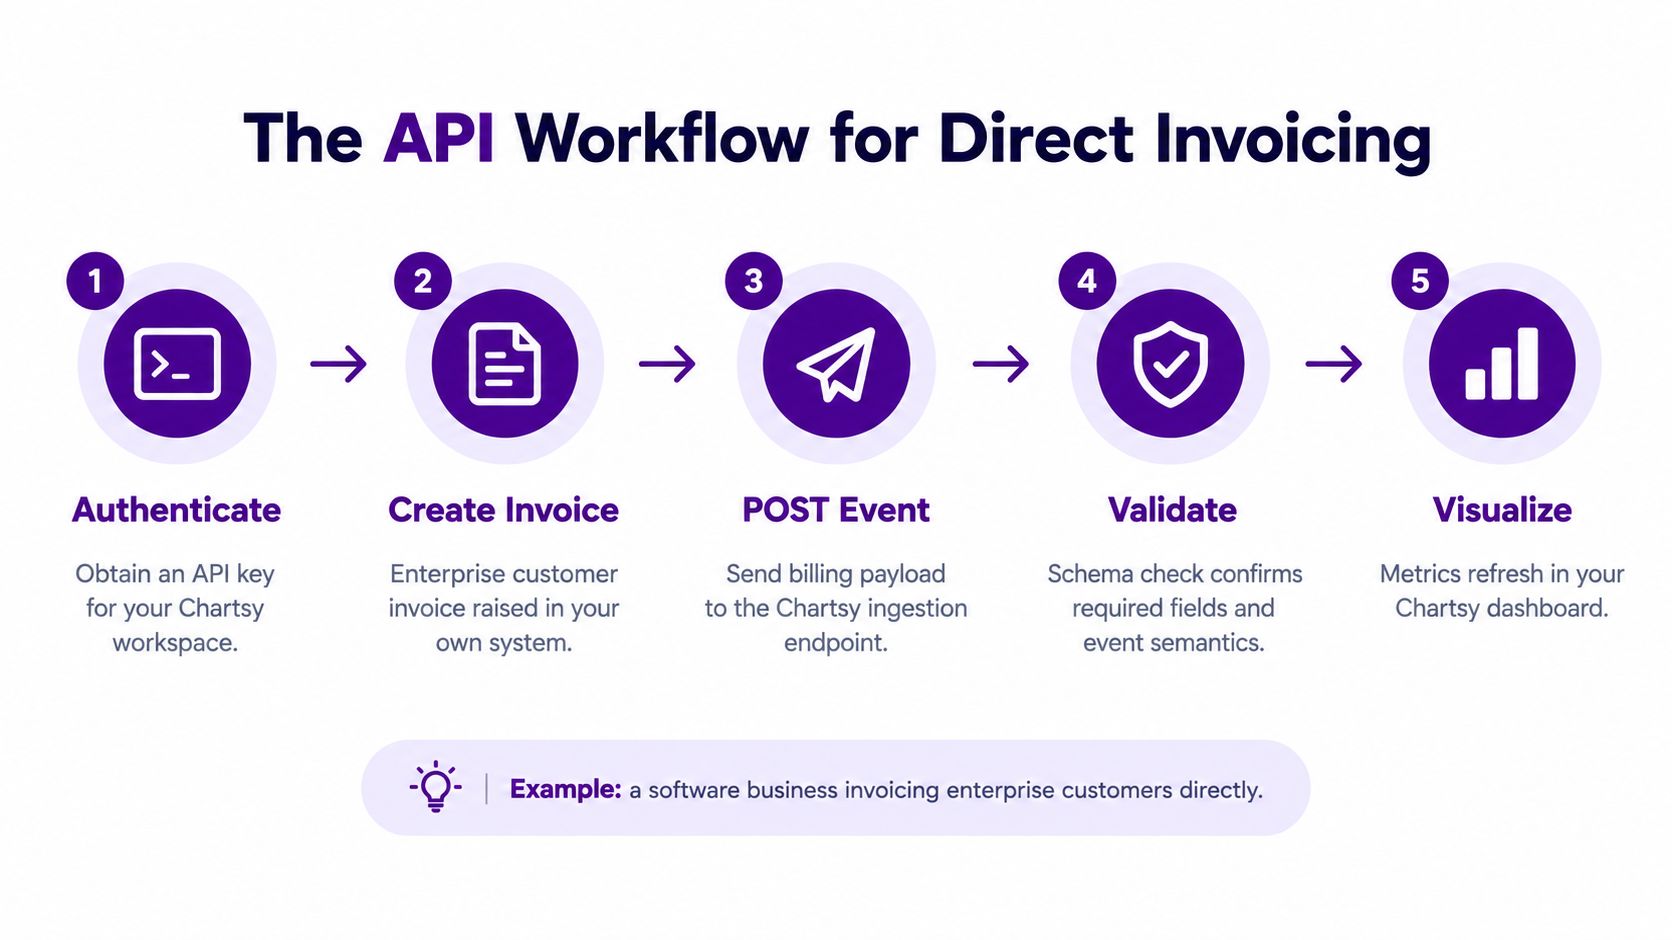
The first step is to identify the source of truth. The engineering team should extract subscription and billing events from the internal ledger, not derive them from a spreadsheet edited by the finance team after the fact. The export should preserve the original event timestamp and the period during which the customer was entitled to service.
Prepare the payload
The business then maps its internal fields to the Custom Source data model. A practical mapping might look like this:
- Customer record: Convert the internal account key into a stable customer identifier used consistently in every event.
- Subscription record: Send the subscription ID, plan, quantity, currency, interval, status, and recurring amount.
- Lifecycle event: Represent started, renewed, upgraded, downgraded, paused, canceled, reactivated, and payment-related changes with consistent meanings.
- Service period: Include the start and end dates that determine when the recurring amount applies.
- Revenue classification: Mark implementation fees, professional services, credits, refunds, and other non-recurring items separately from subscription charges.
The exact payload should follow the Custom Source data models, rather than relying on assumptions based on your internal database structure. Your database may have a field called status, but the API still needs a clear rule for what each status means for active service and recurring revenue.
Send, retry, and reconcile
The integration should use a deduplication key for every event. If the request times out and the system retries, the same event must remain the same event. Immutable timestamps are equally important. Rewriting an old cancellation with the current date can move historical churn into the wrong reporting period.
A sensible operating process has three checks:
- Payload validation: Confirm required fields, allowed statuses, currency treatment, and event semantics before transmission.
- Delivery monitoring: Record which events were accepted, rejected, or retried, including the error response for failed payloads.
- Reconciliation: Compare imported recurring MRR with the internal ledger by customer, subscription, service period, and reporting month.
Reconciliation catches problems that schema validation can't. A payload can be structurally valid and still double-count an upgrade, omit a cancellation, or classify an annual contract as a one-time payment. Keep a report that explains differences between the source ledger and the analytics feed.
This is implementation work, not a simple switch. The team must maintain the field mapping when plans change, preserve historical records during migrations, and test edge cases such as partial refunds, replacement contracts, and payment recovery. The focus should remain on exporting billing facts for analysis, not turning the analytics layer into a second billing system. Businesses ready to map that feed can review the Custom API workflow.
Questions You Can Answer Once Connected
Once the billing feed is normalized, the founder's questions become more useful because they combine acquisition data with subscription outcomes. The dashboard isn't proving that a marketing source caused a customer to stay or leave. It's showing an observed relationship between the source, the customer record, and subsequent billing activity that deserves investigation.
A founder can ask:
- Which marketing sources bring paying customers rather than only signups? Compare source-level signups with customers who have positive recurring revenue.
- Which sources contribute the most MRR? Look at recurring revenue associated with paying customers, not total traffic or one-time invoice volume.
- What changed MRR this month? Break the movement into new MRR, expansion, contraction, churn, and reactivation.
- Are upgrades offsetting contraction? Separate plan increases from downgrades so a stable total doesn't hide pressure in the existing customer base.
- Which acquisition cohorts retain the most revenue? Compare cohorts by month of subscription start and examine logo and revenue retention at the same age.
- Does one plan produce more churn than another? Segment by plan and inspect whether the difference comes from voluntary cancellations, payment problems, or service-period timing.
- Are customers from one country or acquisition source more likely to downgrade? Use consistent customer and subscription identifiers to connect billing events with those segments.
- Which cancellations took effect immediately, and which remained active until the paid period ended? Use the effective service-end date instead of treating every cancellation request as immediate revenue loss.
- Are failed renewals recovering? Preserve payment status, grace periods, and reactivation events so temporary collection problems aren't counted as permanent churn.
- Does the recurring revenue report reconcile with the internal ledger? Investigate differences before using the dashboard for planning or marketing decisions.
That last question is operationally important. A trustworthy report isn't one that always matches expectations. It's one where the team can trace a number back to a customer, subscription, event, and service period.
The implementation path is straightforward in principle: document the canonical IDs, map the ledger fields, define recurring and one-time treatment, send a small representative payload, and reconcile the result before automating the full feed. Founders without a dedicated analyst can then use plain-English questions and saved dashboards to monitor marketing performance, customer growth, MRR movements, and churn without maintaining a fragile spreadsheet.
Chartsy connects website traffic and signups with paying customers and subscription revenue, including billing data sent through a Custom API from an internal system or unsupported provider. Review the Chartsy documentation, map your first customer and subscription payload, and use the resulting dashboards to investigate where recurring revenue is coming from and what is changing it.

Written by
Chartsy TeamAnalytics team at Chartsy
The Chartsy Team writes guides, product updates, and resources to help SaaS and eCommerce founders make sense of their metrics, without SQL or spreadsheets.
Chartsy
