
A strong NRR can let a SaaS company grow before it wins another customer. But the formula only helps when you define the customer cohort and revenue movements correctly. Here are 10 useful ways to think about the net revenue retention formula, including the full cohort view, renewal-based NRR, benchmarks, and reporting tools.
Table of Contents
- 1. Chartsy, Our Top Pick: Analyze NRR from Stripe and Paddle data
- 2. Net Revenue Retention, The Cohort-Based Formula for Existing Customers
- 3. Worked NRR Example, Calculate Expansion, Contraction, and Churn
- 4. Renewal-Based Net Revenue Retention, Measure Revenue at Contract Renewal
- 5. Monthly NRR, Track Short-Term Movement in Subscription Revenue
- 6. Annual NRR, Evaluate Customer Value Across a Full Contract Year
- 7. Automated NRR Reporting, Connect Billing and CRM Data Correctly
- 8. Cohort-Weighted NRR, Handle Reactivations and Mid-Term Changes
- 9. NRR Benchmarks, Interpret Results by SaaS Size and ACV
- 10. NRR, GRR, and Net Dollar Retention, Choose the Right Retention Metric
- FAQ
- Conclusion
1. Chartsy, Our Top Pick: Analyze NRR from Stripe and Paddle data
Chartsy is an AI-powered subscription analytics platform for SaaS teams that need answers from Stripe and Paddle data. It turns billing data into charts, dashboards, and reports through plain-English questions.
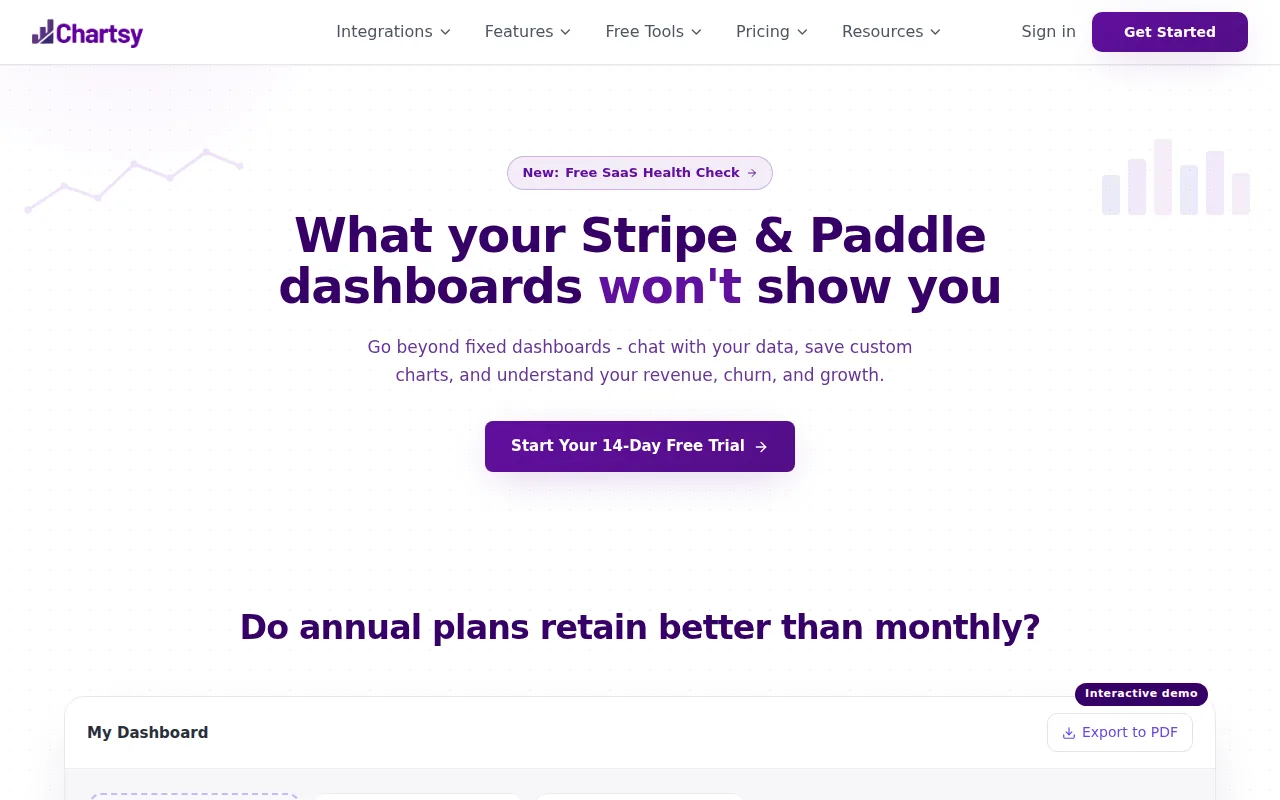
For NRR work, the main value is speed. A founder can ask for MRR movement by plan, compare existing-customer revenue with new revenue, or inspect churn and expansion without building each view from scratch. Teams can also save reports for weekly reviews or board updates.
That matters because NRR is rarely one clean field in a billing system. You need a starting customer set. Then you need to classify upgrades, downgrades, cancellations, reactivations, and price changes. Chartsy can help teams examine those movements across their connected revenue data, while the team still owns the definitions.
Chartsy is best for founders and small SaaS teams that want fast analysis without writing SQL or maintaining a large reporting stack. It may be less suitable when your company needs a custom data warehouse model with complex contract rules.
Use it as a fast analysis layer, then confirm the formula behind any number you send to investors. The result is only as good as the billing history and event labels underneath it.
Subscription systems often track status changes as events rather than as one permanent customer value.
2. Net Revenue Retention, The Cohort-Based Formula for Existing Customers
The standard net revenue retention formula measures revenue change inside an existing customer cohort. It excludes new customers, so the result shows whether your current base grew or shrank.
Use this formula:
NRR = (Starting MRR + Expansion MRR - Contraction MRR - Churned MRR) ÷ Starting MRR × 100
You can use ARR instead of MRR. The key rule is consistency. Don't mix starting MRR with annual expansion data. If the period is monthly, keep every input monthly. If the period is annual, use annualized recurring revenue for every input.
Each part answers a different question:
- Starting MRR: How much recurring revenue came from the cohort at the start?
- Expansion MRR: How much did those customers add through upgrades, extra seats, usage, or another product?
- Contraction MRR: How much recurring revenue did existing customers reduce?
- Churned MRR: How much recurring revenue disappeared after cancellation?
A result above 100% means expansion beat contraction and churn. A result below 100% means the cohort lost revenue. New sales don't change the result, even if total MRR went up during the same period.
That separation is the point. Total MRR can rise while the old customer base weakens. NRR exposes that gap. Teams that need a fuller primer can review Chartsy’s explanation of Net Revenue Retention alongside their own billing definitions.
One major limitation remains: the cohort must be fixed. If you add new customers to the starting group, the result becomes a blend of retention and acquisition. That makes the number look better without proving that existing customers expanded.
3. Worked NRR Example, Calculate Expansion, Contraction, and Churn
A worked example makes the net revenue retention formula easier to check. Imagine a SaaS company starts the month with a baseline of MRR from existing customers.
During the month, that same group produces these movements:
- Expansion MRR
- Contraction MRR
- Churned MRR
Put the values into the formula:
NRR = (Starting MRR + Expansion MRR - Contraction MRR - Churned MRR) ÷ Starting MRR × 100
The ending revenue from the original cohort matches its starting revenue. Expansion exactly offset the revenue lost through downgrades and cancellations.
That result needs context. The company may feel healthy because it kept the same revenue base. But it still lost recurring revenue from existing accounts. The team had to replace that loss through expansion.
Now consider a scenario with greater expansion:
NRR = (Starting MRR + Expansion MRR - Contraction MRR - Churned MRR) ÷ Starting MRR × 100
The cohort grew without new customers. A useful follow-up is to split expansion into upgrades, added seats, price changes, and cross-sells. Each source points to a different action.
Check the event dates before you trust the result. An upgrade that starts after the measurement period belongs in the next period. A failed payment isn't always churn. A customer may be past due while the subscription remains active.
Also watch for refunds, credits, taxes, and one-time charges. NRR should reflect recurring revenue, not every dollar that moved through a payment processor. Write down your inclusion rules before comparing one month with another.
4. Renewal-Based Net Revenue Retention, Measure Revenue at Contract Renewal
Renewal-based NRR compares renewed ARR with the ARR that came up for renewal. Its formula is simple:
Renewal NRR = Renewed ARR ÷ ARR Up for Renewal × 100
Say ARR is due for renewal. Customers renew part of it. Renewal-based NRR is the percentage of ARR renewed.
This view fits contract businesses that manage clear renewal dates. It helps a revenue team inspect the renewal book without building a full monthly cohort model. A renewal manager can see how much contract value survived the renewal event.
The tradeoff is easy to miss. This version can ignore mid-term expansion and contraction. If a customer doubles its plan six months before renewal, that change may not appear in the renewal ratio. The same is true for a mid-term cancellation if the renewal dataset only includes contracts that reached the renewal stage.
It also depends on clean stage labels. A closed-lost renewal should produce zero renewed ARR for that contract. A closed-won renewal should use the renewed annualized value, not the total contract value across several years.
Use renewal-based NRR as a contract-renewal view. Pair it with cohort NRR when you need the full story of customer revenue between renewal dates.
5. Monthly NRR, Track Short-Term Movement in Subscription Revenue
Monthly NRR applies the net revenue retention formula over a short period, usually one month. It helps teams spot a new churn pattern or pricing change before the issue grows.
Monthly reporting works well when your product has monthly plans, frequent upgrades, or high transaction volume. It gives the customer success team a quick signal. If NRR drops after a plan change, the team can inspect the affected plans while the event is still fresh.
But monthly NRR can jump around. One large customer can change the result. A billing retry can shift revenue into the next month. A seasonal business may look weak during a normal low-use period.
Use a rolling view beside the monthly number. A three-month or twelve-month window can reduce noise without hiding a sustained decline. Keep the same cohort rule in every report.
Monthly NRR is also useful for diagnosing net negative churn. That happens when expansion and reactivation revenue exceed contraction and churn. It doesn't mean every customer stayed. It means the revenue movement from the remaining base outweighed the losses.
Don't use a single weak month as proof that product value has fallen. First check failed payments, refunds, plan migrations, and the size of the starting cohort.
6. Annual NRR, Evaluate Customer Value Across a Full Contract Year
Annual NRR compares the recurring revenue from an existing customer cohort across a twelve-month period. It is often the clearest view for annual contracts and board reporting.
The longer window gives customers time to renew, expand, downgrade, or leave. It also reduces the effect of short billing delays. For an enterprise SaaS company, annual NRR may tell a more useful story than a monthly figure because the buying cycle is long.
Annual NRR still needs a fixed start point. Take the customers active twelve months ago. Measure their current recurring revenue. Exclude customers acquired after the start date.
Annual reporting can hide a recent problem. A customer that churned last month may sit inside a strong annual result because the first eleven months were stable. That is why teams often review monthly movement alongside the rolling annual metric.
Annual contracts also create a data trap. Don't divide total multi-year contract value by starting ARR. Convert each contract to an annual recurring amount first. Then compare like with like.
When the period is annual, use ARR. When it is monthly, use MRR. The label matters less than matching the time unit across every input.
7. Automated NRR Reporting, Connect Billing and CRM Data Correctly
Automated NRR reporting is only useful when billing and CRM records agree. The system needs to know which contract came before the current contract and what changed between them.
A workable data model usually includes:
- A customer or parent-account ID.
- A contract ID with start and end dates.
- Starting MRR or annualized contract value.
- Renewal status and close stage.
- Expansion, contraction, churn, and reactivation fields.
- A link between the old contract and its renewal or replacement.
The link between contracts matters most. Without it, the report may treat a renewal as a new customer. That would remove the renewal from the retention calculation and inflate new business.
Build formula logic that checks the event type and date. A closed-lost renewal should not leave its old ARR in the numerator. A downgrade should reduce the retained amount. A mid-term upsell should appear in the cohort view even if it never reaches a renewal stage.
Chartsy is useful here for teams that want to query Stripe and Paddle data without building every chart by hand. It can help a team inspect revenue movement, plan segments, customer groups, and retention trends. Still, the team must decide how to treat refunds, pauses, reactivations, and failed payments.
Set up a reconciliation check each month. Compare the report's ending recurring revenue with the billing system's active subscription total. If they differ, find the missing event before publishing the NRR result.
Automation removes repeat work. It doesn't remove judgment. A clean dashboard can still show a wrong number if the underlying customer IDs or event labels are wrong.
8. Cohort-Weighted NRR, Handle Reactivations and Mid-Term Changes
Cohort-weighted NRR calculates retention for defined groups, then weights the result by starting revenue. This avoids giving a tiny customer group the same influence as a large revenue cohort.
Imagine two cohorts with different starting revenue. One grows modestly while the other contracts. A simple average of their rates can give each cohort equal influence, even when one represents far more revenue. The combined result may show a different retention rate.
The weighted result better reflects the revenue at risk. Use total ending cohort revenue divided by total starting cohort revenue when the cohorts share the same measurement period:
Weighted NRR = Total Current Cohort Revenue ÷ Total Starting Cohort Revenue × 100
Reactivations need a written rule. Some companies count a returning customer as expansion within the original cohort. Others treat the customer as new after a defined inactive period. Either approach can work, but switching rules will break trend comparisons.
Mid-term changes need event-level data. A customer may upgrade, pause, reactivate, then downgrade in the same year. A snapshot at the start and end can miss that path. An event ledger shows what happened and when.
Use cohort tables when you need to explain the number to a finance team. Use a single headline NRR for routine reporting. Keep the detailed movement view available when a result changes sharply.
9. NRR Benchmarks, Interpret Results by SaaS Size and ACV
NRR benchmarks are useful as a starting point, not a pass-fail test. A company with enterprise contracts may have a different retention pattern from a self-serve product.
Common rules of thumb from SaaS metric discussions put NRR below 100% in the warning zone because the existing base is shrinking. A result between 100% and 120% means the base is holding or growing. Results above 120% are often treated as very strong.
These ranges need care. A high NRR may come from a few large upgrades. It may also hide high logo churn among smaller customers. A lower NRR may reflect a young self-serve product with many small accounts and limited expansion paths.
Annual contract value changes the comparison too. Larger contracts can have more room for expansion, while lower-value plans may have less revenue to add after the first sale. Compare your result with businesses that share your sales motion, contract size, and pricing model.
One widely discussed SaaS benchmark set places median NRR near 102%, with higher ACV groups showing stronger retention than lower ACV groups. Treat those figures as context rather than a target for every company. The source material also describes higher ACV groups near 110% and lower ACV groups near 100%.
The next action depends on the cause:
- Below 100%: inspect churn and downgrades before spending more on acquisition.
- Near 100%: find expansion paths and improve onboarding.
- Above 100%: protect the customers and plans driving the gain.
- High NRR with high logo churn: check if large accounts hide weak smaller segments.
A benchmark tells you where to ask questions. It doesn't tell you which customer event caused the answer.
10. NRR, GRR, and Net Dollar Retention, Choose the Right Retention Metric
NRR and net dollar retention usually describe the same revenue-based measure. GRR is different because it excludes expansion.
| Metric | Includes | Can exceed 100%? | Best use |
|---|---|---|---|
| NRR | Starting revenue, expansion, contraction, and churn | Yes | Measure total revenue growth inside the existing base |
| Net Dollar Retention | The same components as NRR | Yes | Use when your finance or investor group prefers the NDR name |
| GRR | Starting revenue minus contraction and churn | No | Measure how well the base holds before expansion |
| Renewal-based NRR | Renewed ARR divided by ARR up for renewal | Yes | Review contract renewal performance |
GRR answers, “How much revenue did we keep before upsells?” It is useful for spotting product or service problems. A strong NRR can hide weak GRR if expansion from a few accounts covers large losses elsewhere.
NRR answers a broader question: did the existing customer base become more valuable? That makes it useful for growth planning. NDR is usually a naming choice, so define the term in your dashboard.
Renewal-based NRR answers a narrower contract question. It can be easier to report, but it may miss mid-term events. Put the metric name and formula beside the chart so nobody mistakes renewal retention for cohort retention.
For most SaaS teams, keep both NRR and GRR. Read them together. If GRR falls while NRR rises, expansion is doing heavy repair work.
FAQ
What is the net revenue retention formula?
The net revenue retention formula is (Starting MRR + Expansion MRR - Contraction MRR - Churned MRR) divided by Starting MRR, multiplied by 100. It measures revenue change from existing customers only. New customer revenue stays out of the calculation, so the result shows whether the current base grew or shrank.
What is a good NRR rate for SaaS?
An NRR above 100% is generally a healthy sign because existing-customer expansion exceeds contraction and churn. Many SaaS teams view 100% to 120% as a solid range and 120% or more as very strong. The right comparison depends on contract size, sales motion, customer segment, and how much expansion your pricing model allows.
What is the difference between NRR and GRR?
NRR includes expansion, contraction, and churn, while GRR includes only the revenue retained after contraction and churn. NRR can rise above 100%, but GRR cannot. Use NRR to measure growth inside the customer base. Use GRR to see whether the base holds before upgrades and cross-sells help.
Can NRR include new customers?
No, standard NRR excludes new customers from the starting cohort. Adding new customers would mix acquisition with retention and make the result harder to interpret. Define the cohort at the start of the measurement period, then track only those customers. Write a separate rule for reactivations, since companies classify them in different ways.
Should SaaS companies track monthly or annual NRR?
SaaS companies should track monthly NRR for fast feedback and annual NRR for a steadier view. Monthly results can move sharply after one large churn event or billing delay. Annual results reduce short-term noise but may hide a recent decline. Use both when your data supports it, with the same cohort rules across periods.
Conclusion
Start with the cohort-based formula, then add renewal-based NRR if contract timing matters to your team. Your next move is to document the cohort, time unit, and treatment of churn, reactivation, and failed payments before building the dashboard. Chartsy can help you inspect those movements from Stripe or Paddle data, while its SaaS metrics cheat sheet gives your team a shared reference for the related measures.

Written by
Chartsy TeamAnalytics team at Chartsy
The Chartsy Team writes guides, product updates, and resources to help SaaS and eCommerce founders make sense of their metrics, without SQL or spreadsheets.
Chartsy
