
You export Stripe transactions, open a second dashboard for Freemius, check invoices from your direct customers, and start a spreadsheet that will be out of date before the month is over. The totals don't line up because each system uses different names for subscriptions, payments, refunds, currencies, and churn.
That makes growth harder to understand than it should be. You need to know which marketing sources bring paying SaaS customers, what changed your MRR, and whether a revenue decline reflects cancellations, downgrades, failed collections, or a reporting mismatch. The practical answer isn't to force every payment record into one unexplained number. It's to create a consistent analytical view while preserving the source systems and their original events.
Table of Contents
- The Hidden Complexity of Mixed Payment Providers
- Reconciling Different Definitions of Revenue
- Native Integrations Versus the Custom API
- Essential Features for Multi-Source Analytics
- A Hypothetical Scenario Across Three Systems
- Next Steps for Selecting and Implementing a Solution
The Hidden Complexity of Mixed Payment Providers
Month-end reporting usually begins with good intentions. A founder exports a CSV from Stripe for the main application, checks Freemius for a plugin product, downloads invoices from a custom billing system, and adds signup data from website analytics. A few hours later, the spreadsheet contains several totals that look plausible but can't be reconciled.
One provider may show successful charges, another may show payouts, and a third may show active subscriptions. Those figures answer different questions. Adding them together creates a total, but not necessarily a useful measure of recurring business performance.

Why one dashboard stops being enough
A SaaS business might use Stripe for its core product, Paddle for a separate application, Freemius for a WordPress plugin, and direct invoicing for larger contracts. Each system can be perfectly adequate on its own. The difficulty appears when you ask a business question that crosses them:
- Which acquisition sources produced paying customers across all products?
- Did MRR rise because of new subscriptions or upgrades?
- Which product contributed most to churn?
- Are direct invoices recurring revenue or one-time professional services?
- Did a country underperform, or did one provider collect payments differently?
Visa's analysis placed the global subscription economy at approximately US$650 billion by the end of 2021 and projected growth to US$1.5 trillion by 2025. The same analysis found year-over-year growth in recurring card transactions through 2021, followed by a decline in consumer recurring payments across all regions in 2022, particularly in Asia-Pacific and Europe (Visa's subscription economy analysis). For a SaaS founder, the lesson is straightforward: recurring revenue needs to be monitored over time, not inferred from customer counts or website conversions.
Aggregation isn't the same as reconciliation
Connecting several sources can give you a broader view. It doesn't automatically make their records comparable, and it doesn't prove that the same customer has been recognized consistently across systems.
A provider-level dimension is useful because it lets you investigate the total rather than hide the differences. If overall MRR falls, you should be able to ask whether Stripe declined, Freemius cancellations increased, or direct invoices expired. Mastercard's research found that recurring payment consolidation differs by market, with consolidation highest in Australia at 72% and the United Kingdom at 70%, followed by Italy at 63% and the United States at 59% (Mastercard's subscription economy report). Those differences reinforce the need to examine provider and country dimensions instead of treating payment behavior as uniform.
Practical rule: Use the overall view to spot movement, then use the source view to explain what moved. Don't let a combined total erase the evidence you need for diagnosis.
Reconciling Different Definitions of Revenue
The first reconciliation task isn't adding numbers. It's deciding what each number means.
A Stripe payout, a Freemius transaction, and a direct invoice may all relate to the same SaaS business while representing different financial events. A payout is cash transferred after fees and other adjustments. A transaction may include tax, discounts, or a refund. An invoice records an amount billed, which may not have been collected. None of these automatically equals monthly recurring revenue.
Separate the measures before comparing them
A useful cross-provider model keeps at least these measures distinct:
| Measure | What it answers | Common mistake |
|---|---|---|
| MRR | What active recurring subscriptions are worth on a monthly-normalized basis | Counting an annual invoice at its full value in one month |
| Gross billings | What customers were billed before selected deductions | Treating billed amounts as collected cash |
| Net collections | What the business collected after defined adjustments | Comparing net payouts with gross transactions |
| Recognized revenue | What accounting rules assign to the service period | Treating payment date as the revenue date |
| One-time sales | What came from non-recurring charges | Including setup fees or licenses in MRR |
Stripe defines MRR as the sum of the monthly-normalized value of active and past-due subscriptions. Its documented calculation excludes taxes, free plans, and metered products, and treats canceled or unpaid subscriptions as churn (Stripe's MRR documentation). An annual subscription worth $1,200 therefore contributes $100 to monthly MRR, not the full invoice amount. Usage-based charges should be reported separately.
That definition is operationally useful, but you still need to document whether it applies unchanged to Freemius, Paddle, and direct invoices. A provider-neutral model should retain the original record and apply an explicit transformation rather than assuming equivalence on its own. Chartsy's explanation of its own MRR methodology is a useful reference point for documenting those rules (how Chartsy calculates MRR).
Treat subscriptions as events
A monthly snapshot tells you that a subscription exists. An event stream tells you what happened to it. New subscriptions, plan changes, quantity changes, pauses, renewals, failed payments, recoveries, and cancellations all affect the interpretation of a revenue movement.
Stripe recommends processing subscription events and using subscription identifiers to determine which customer and subscription changed (Stripe's subscription webhook guidance). A durable canonical record should preserve:
- Provider and event identity, including the provider name, event type, event ID, and event timestamp.
- Subscription identity, including customer ID, subscription ID, invoice or transaction ID, and product or plan.
- Money fields, including currency, gross amount, discounts, taxes, processor fees, refunds, and payment status.
- Service dates, including the effective start and end of the covered period.
- Raw payload references, so a transformed record can be audited later.
Deduplicate using a compound key such as provider plus event ID, and make ingestion idempotent because payment systems can retry delivery. Events may also arrive out of order. When the provider supports it, fetch the current object to resolve a late or contradictory event, while retaining the original payload for investigation.
This level of care may sound excessive for a small SaaS company. It becomes worthwhile as soon as a founder has to explain why ending MRR doesn't match invoice totals, or why a failed renewal was counted as immediate voluntary churn.
Keep cash and accounting separate
IFRS 15 treats consideration received before service transfer as a contract liability (IFRS 15 standard). That matters when a customer prepays an annual plan. The cash arrived, but the service obligation extends across a future period.
Your analytics layer should therefore preserve the covered service interval and the original currency, alongside gross charges, taxes, fees, refunds, credits, and chargebacks. Choose and document an exchange-rate policy, including the exchange-rate date used for reporting. Don't allow one provider's net payout to sit beside another provider's gross transaction and call the result consolidated revenue.
If you're also evaluating conversion tracking or server-side data collection, a practical pricing for conversion API tracking tools comparison can help separate acquisition instrumentation from subscription revenue reconciliation. They solve related parts of the measurement problem, but they aren't substitutes for a consistent billing model.
Native Integrations Versus the Custom API
The right integration path depends on how much of the billing model already fits a supported connector.
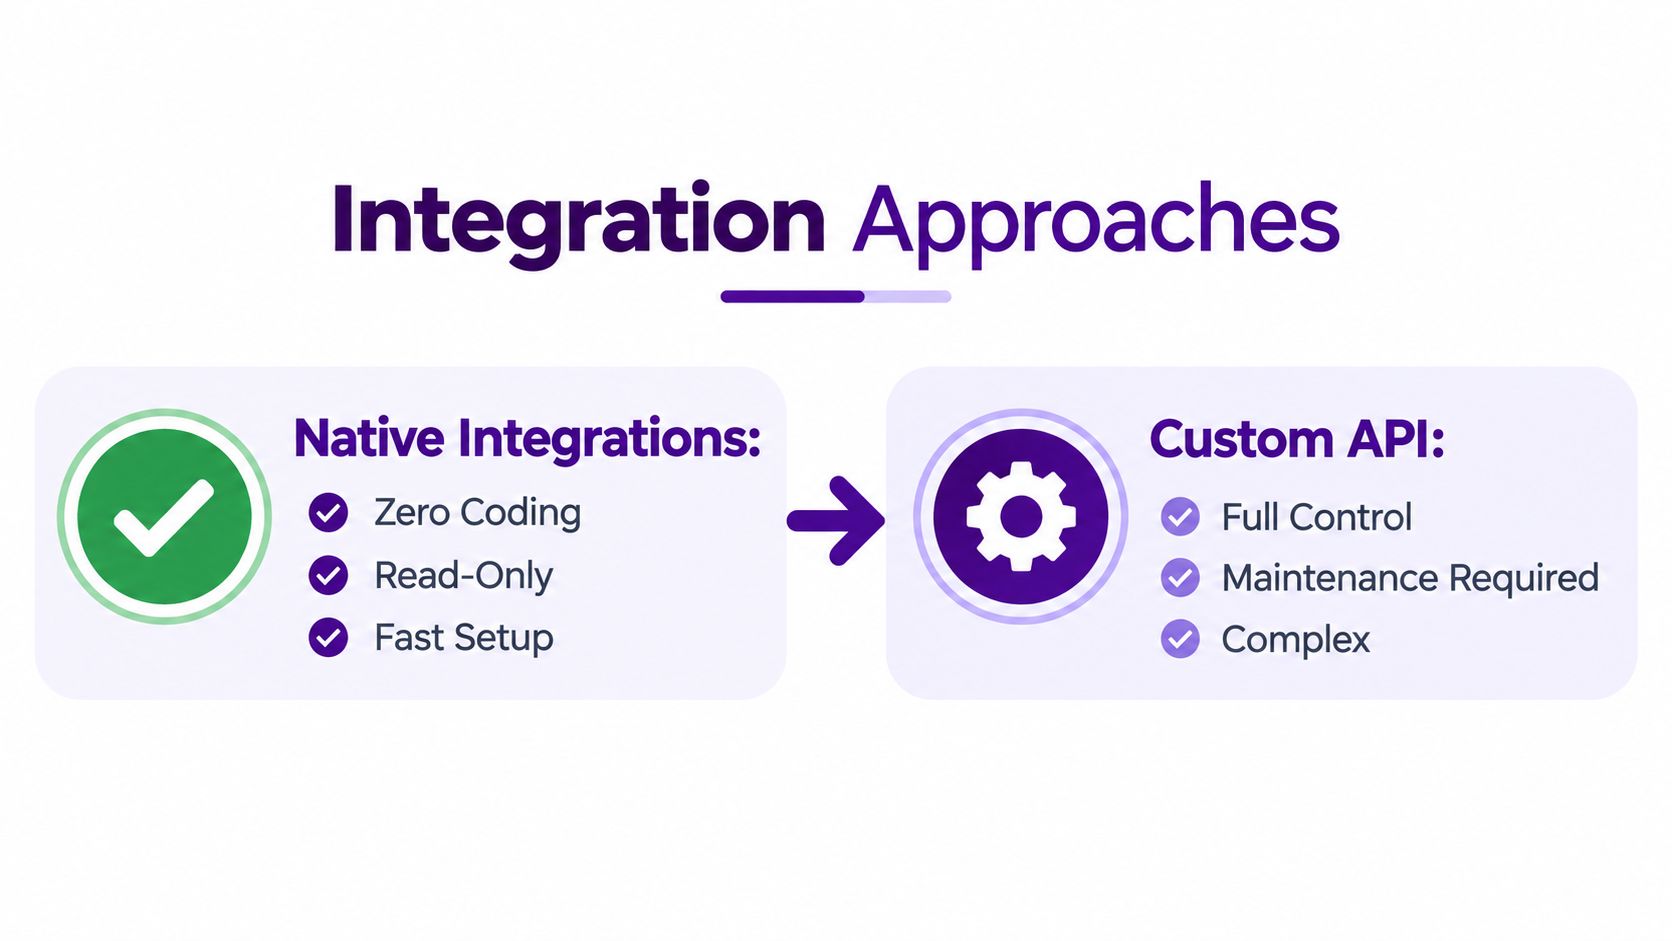
Chartsy provides native, read-only connections for Stripe, Paddle Billing, Paddle Classic, and Freemius. Those connections are appropriate when your provider records already contain the subscription and lifecycle information you need, and you want to analyze billing alongside website visits, signups, and marketing sources without changing the source data.
Native connections favor speed and lower maintenance
A native connection is usually the sensible starting point for a supported provider. You authorize a read-only connection, select the account or source, and use the available subscription data for dashboards and analysis. This reduces the amount of transformation code your team has to own.
Paddle requires particular care because Paddle Billing and Paddle Classic are separate products with different implementations, APIs, and lifecycle mechanisms. Paddle's documentation distinguishes Notifications in Paddle Billing from Events in Paddle Classic (Paddle seller alerts documentation). A workflow built for one shouldn't be assumed to work for the other.
Native connectors are a good fit when:
- Your billing provider is supported directly.
- You want read-only analysis rather than write access.
- The provider's customer, subscription, and transaction fields are sufficient.
- You prefer a faster setup over full control of every transformation.
- Your team doesn't want to maintain webhook ingestion and schema mapping.
They still don't remove the need to define what counts as MRR, how one-time revenue is handled, or how customer identities are interpreted across sources.
Custom API favors flexibility and ownership
The Custom API is useful when a provider lacks a native connector, when you issue invoices from your own system, or when your billing model contains fields that need explicit mapping. In the hypothetical setup used throughout this article, direct invoiced subscriptions can be sent into Chartsy through the Custom API while Stripe and Freemius use their native connections.
That route isn't an automatic connection to every payment provider. Your team must send the records, map them to a stable schema, preserve provider-specific fields, handle retries, and maintain the pipeline as the billing system changes.
Choose flexibility deliberately. A Custom API gives you control over the data model, not freedom from data maintenance.
A practical implementation maps customer, subscription, invoice, payment, refund, discount, tax, currency, event date, service dates, and marketing-source identifiers. It should also distinguish recurring subscription records from one-time invoices. Teams managing a broader accounting workflow can use an accounting software integration guide to clarify which records belong in analytics and which belong in the accounting system.
Chartsy can connect several supported sources for analysis. That doesn't mean it automatically deduplicates customers or converts every currency into a common reporting currency. Treat connected sources as identifiable inputs, and verify the aggregation behavior for your account and data model before presenting a combined total as authoritative. For custom billing details and implementation considerations, see subscription analytics for custom billing.
Essential Features for Multi-Source Analytics
A multi-provider dashboard is only useful if it answers operating questions without forcing you back into spreadsheets. Evaluate the platform against the work your team needs to do each month.
Start with source-to-revenue attribution
Traffic and signup reports tell you where attention came from. SaaS teams need to connect that activity to paying customers and recurring revenue.
Look for dimensions that let you compare:
- Marketing source, so you can identify which channels produced paying customers rather than only leads.
- Product and plan, so a signup for a low-priced plugin isn't confused with a core application account.
- Customer and subscription, so one subscriber with multiple subscriptions isn't counted as one undifferentiated record.
- Country and provider, so collection behavior and source-specific performance remain visible.
- Revenue movement, so new MRR, expansion, contraction, and churn can be investigated separately.
Attribution is evidence of an observed relationship between a source and a customer or subscription. It isn't proof that the source caused the purchase. Keep that distinction in your dashboards and your decisions.
Demand movement reporting, not just a total
Stripe's analytics model separates net MRR change into new, reactivation, expansion, contraction, churn, and foreign-exchange adjustment (Stripe's supported metrics). This is more actionable than a single line that says MRR declined.
For example, a month can contain new subscriptions and upgrades while still ending lower because downgrades and churn were larger. A movement view lets the founder ask a narrower question: did acquisition weaken, did existing customers reduce their plans, or did subscriptions end?
Also check whether the platform distinguishes voluntary churn from involuntary churn, pauses, recoveries, reactivations, downgrades, and failed initial payments. Recent subscription reporting indicates that nearly half of subscriber churn can stem from failed or declined payments (Recurly's subscription data). Treat that as a reason to investigate payment recovery, not as proof that every canceled account disliked the product.
Keep the interface usable for a small team
A solo founder shouldn't need SQL to answer, “Which source brought the customers who expanded this month?” Plain-English querying and chart creation can reduce the distance between a question and an investigation.
Useful capabilities include:
- Natural-language analysis, so non-technical operators can ask questions and create charts.
- Custom dashboards, so the same MRR, churn, source, and provider views are available at review time.
- Read-only billing connections, so analytics can't alter subscriptions or payments.
- Saved filters and segments, so products, countries, plans, and providers can be compared consistently.
- Clear source labels, so connected accounts aren't mistaken for one merged data source.
Chartsy fits this use case by connecting website visits and signups with supported billing data, tracking subscription movements, and allowing plain-English questions and charts. Its value depends on the quality and consistency of the connected data. It doesn't replace an accounting ledger, prove causation, or remove the need to define customer identity and currency policies.
A Hypothetical Scenario Across Three Systems
Consider a small software company with three revenue paths. Its main SaaS application runs on Stripe. A companion WordPress plugin runs on Freemius. Enterprise customers receive direct invoices from an internal billing system, and those recurring records are sent to Chartsy's Custom API.
The founder wants one monthly answer: “How did subscription performance change, and which marketing sources contributed?” The answer can't come from adding three dashboard totals. The products have different customer identifiers, plan structures, billing events, and collection processes.

Begin with the combined operating view
The first pass uses an overall dashboard to review:
- Ending MRR and its change from the previous period.
- New subscriptions and reactivations.
- Expansion and contraction from existing customers.
- Churn and payment-related losses.
- Paying customers by marketing source.
- Recurring revenue by product and provider.
This view answers whether the business moved in the right direction. It doesn't explain every movement, and it shouldn't pretend to. A combined view is a starting signal, not a complete diagnosis.
The founder might see stable total MRR but weaker cash collection. That could reflect annual renewal timing, refunds, taxes, fees, or failed payments rather than a decline in active recurring entitlement. Conversely, a lower MRR should be tied to identifiable subscription movements before anyone blames a marketing channel.
Then inspect each source
The Stripe review focuses on the main application's plan changes, failed renewals, upgrades, and acquisition sources. The Freemius review asks whether the plugin's recurring customers are renewing, downgrading, or canceling under a different product model. The Custom API review checks whether direct invoices were sent, paid, renewed, expired, or mapped correctly.
The source-level checks might include:
- Stripe: Are new paid accounts expanding after signup, or are they entering and quickly contracting?
- Freemius: Are plugin subscriptions being treated separately from one-time licenses or other non-recurring sales?
- Direct invoices: Do service dates and payment status support recurring MRR, or are some invoices implementation work?
- Identity mapping: Does the same company appear under different email addresses or customer IDs?
- Currency treatment: Are source totals being compared in original currency or under an explicitly documented conversion policy?
A source can contribute to a total without being comparable at the record level. Chartsy's guide to unifying Stripe and Paddle data in one dashboard illustrates the broader reporting principle, but the same discipline applies when one source is Freemius and another arrives through a custom pipeline.
Finish with an action list
The monthly review should end with owners and questions, not another exported spreadsheet. The founder might assign one task to investigate failed Stripe renewals, another to validate Freemius cancellation states, and another to reconcile direct invoices whose service dates don't match their payment dates.
The marketing review should use the same source dimensions. If organic search brings many signups but few paying customers, that is an observation worth investigating. If a partner source brings fewer customers with stronger expansion, that may affect prioritization. Neither conclusion should be presented as causal without supporting evidence from the product, sales, and billing records.
Next Steps for Selecting and Implementing a Solution
Use a small implementation checklist rather than trying to rebuild every finance workflow at once.
- Audit the sources. List every provider, product, billing system, currency, recurring plan, one-time charge, and customer identifier.
- Define the metrics. Write down how your team calculates MRR, new revenue, expansion, contraction, churn, collections, and recognized revenue.
- Test native connections. Confirm whether Stripe, Paddle Billing, Paddle Classic, and Freemius cover the records you need, and verify the distinction between connected sources and merged identities.
- Map custom records. If direct invoices or another billing system require the Custom API, design the schema before sending production data. Include event IDs, service dates, payment status, and source identifiers.
- Protect the billing systems. Use read-only connections where available, and retain raw records so transformations can be audited.
- Run a monthly review. Start with overall MRR and source-to-revenue attribution, then investigate each provider's contribution and unresolved variances.
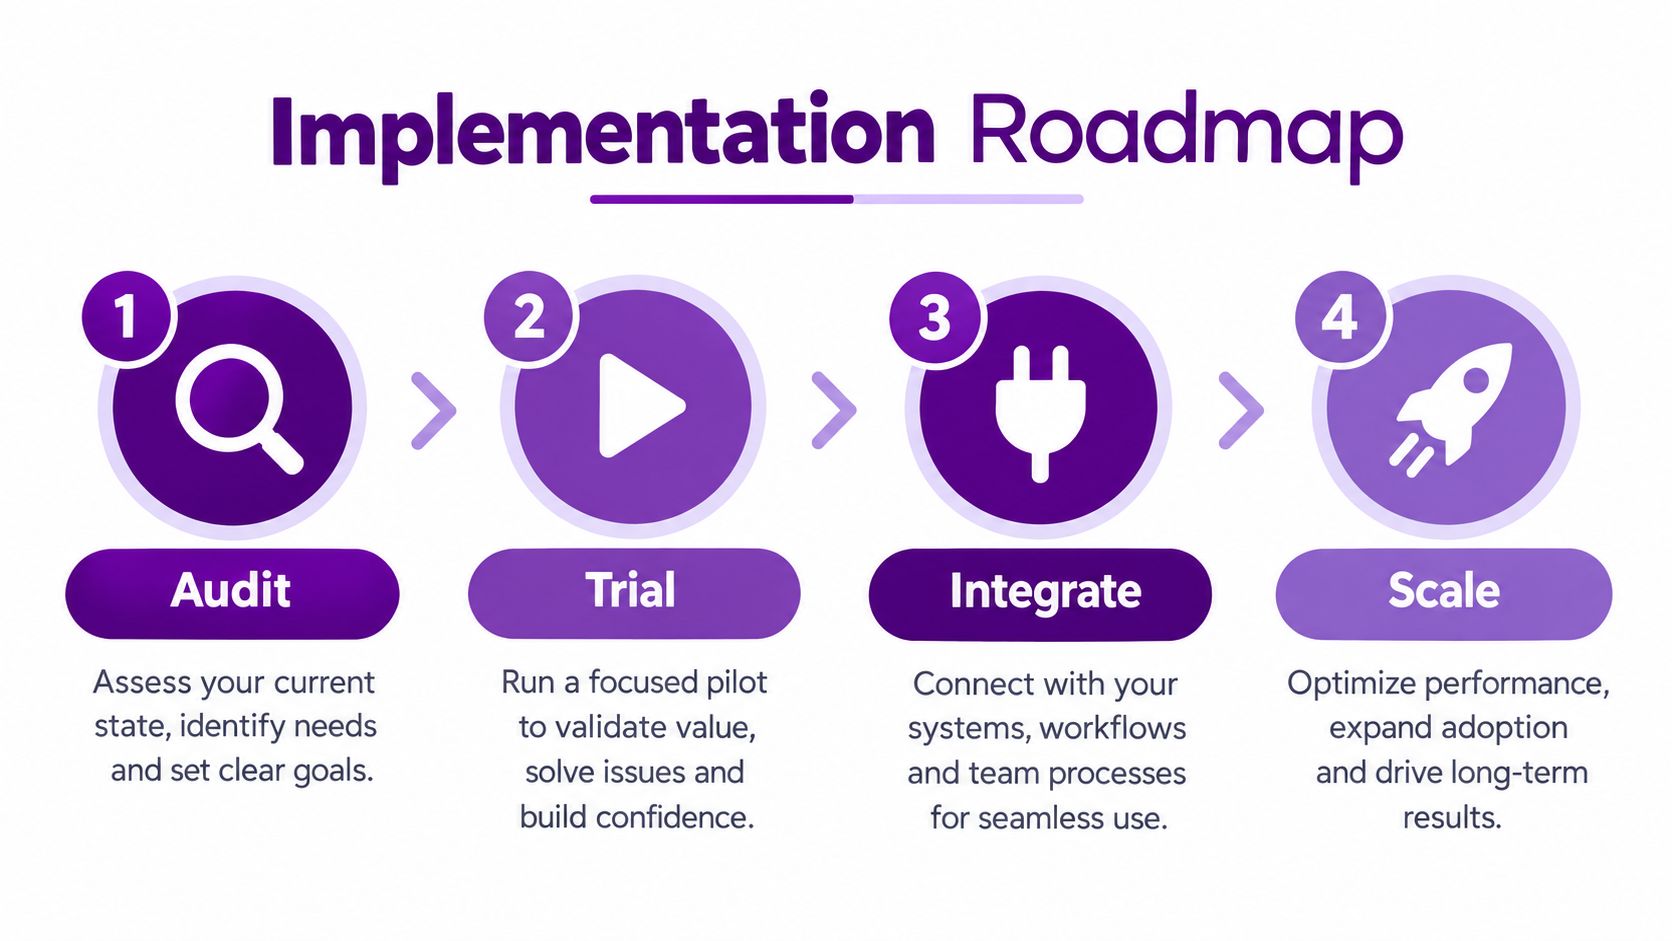
A trial or demo should test your real reporting questions, not just whether a chart loads. Connect the sources you actually use, inspect how products and plans are labeled, confirm how currencies and customer identities are handled, and compare movement totals with the underlying provider records.
Chartsy connects website traffic and signup tracking with subscription data from Stripe, Paddle Billing, Paddle Classic, and Freemius, while its Custom API supports direct invoicing and other billing systems that need a mapped data flow. Visit Chartsy to test a source-to-paying-customer workflow, review MRR movements by provider and marketing source, and replace the month-end spreadsheet with a repeatable dashboard review.

Written by
Chartsy TeamAnalytics team at Chartsy
The Chartsy Team writes guides, product updates, and resources to help SaaS and eCommerce founders make sense of their metrics, without SQL or spreadsheets.
Chartsy
