
Your billing dashboard can show revenue. It may not explain why revenue moved or which marketing source brought those customers. This roundup goes beyond a general "best analytics tools" list to cover the fuller subscription analytics stack — including forecasting tools like StripeReport and deep-cohort platforms like ChartMogul — with Chartsy first for founders who want the easiest way to understand their MRR, whether they bill through Stripe, Paddle, Polar.sh, Freemius, Creem.io or Lemon Squeezy.
The right choice depends on your billing stack, reporting needs, and tolerance for manual work. A solo founder may need a clear dashboard in a couple of minutes, while a finance team may need cohorts, forecasts, or audit-ready data.
Table of Contents
- Chartsy, the easiest way to understand your MRR
- ProfitWell Metrics, retention analysis, segmentation, and churn signals
- StripeReport, forecasting and scenario planning for Stripe data
- Baremetrics, straightforward standard metrics for Stripe-only SaaS
- ChartMogul, deep cohorts and customer journey analysis
- Subscription analytics comparison: Which tool fits your SaaS?
- What to look for in subscription analytics software
- FAQ
- Conclusion
1. Chartsy, the easiest way to understand your MRR
Chartsy is the subscription analytics dashboard built for SaaS founders. Connect Stripe, Paddle, Polar.sh, Freemius, Creem.io or Lemon Squeezy in a couple of minutes and see your MRR laid out plainly: what it is, what moved it, and where it came from. Add one script to your website and Chartsy follows every customer from first visit to signup to paying subscription, so you can see which channels actually grow your MRR. No spreadsheets, no setup project. When you want more, build custom dashboards around the numbers you care about.
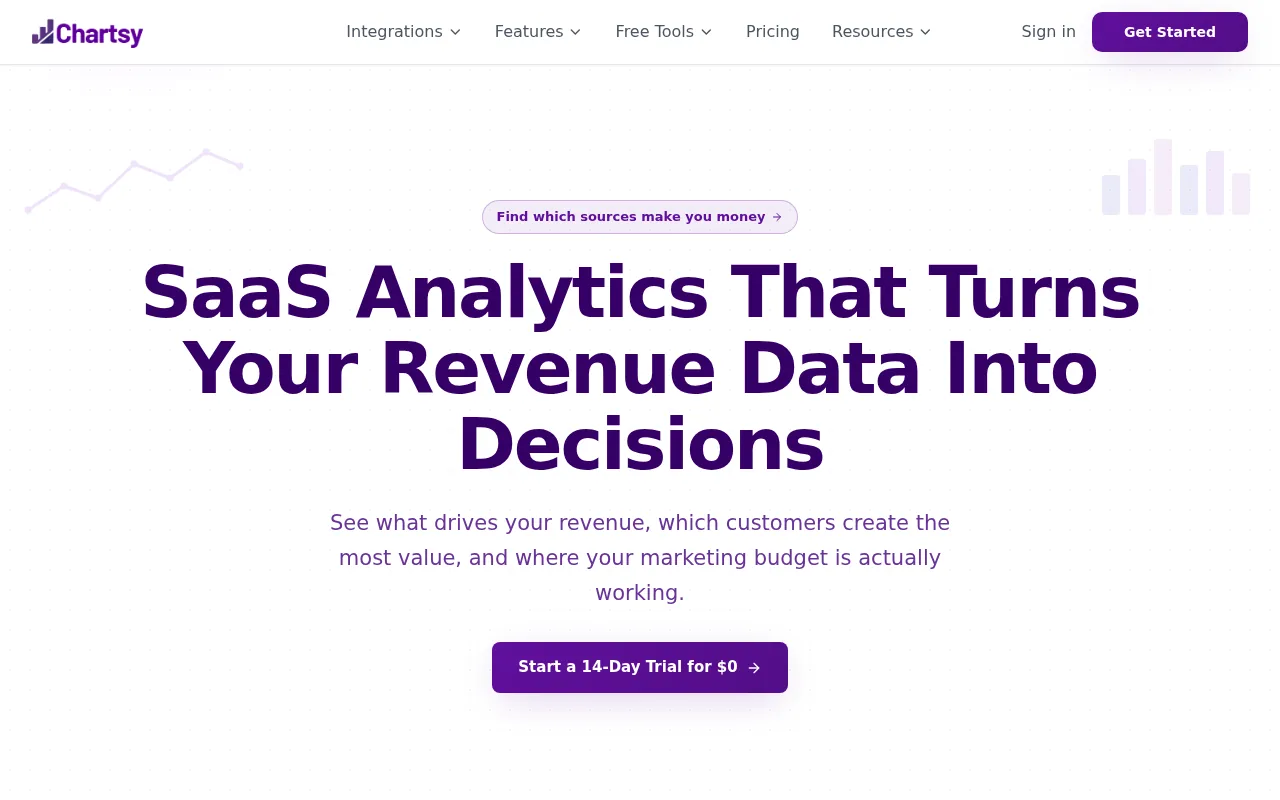
Chartsy is best for small SaaS teams, solo founders, and anyone who wants the numbers that matter without building a report first. Once you connect a billing account, your history syncs automatically and the dashboard fills in: MRR, ARR, churn, LTV, cohorts and refunds, calculated from your invoice and subscription data. The MRR view is the centre of it - you see what your MRR is and exactly what moved it, split into new, expansion, contraction, churn and reactivation.
The useful difference is the link between revenue and acquisition. Chartsy tracks visits and signups with UTM data, then connects those sources to customers and MRR. That lets you compare a newsletter, launch, SEO page, or paid campaign by the revenue it produced, not just by traffic.
For example, a channel with 2,000 visits may look strong until you compare it with a source that brought 150 visitors and ten paying customers. Chartsy helps expose that gap. The same view can show which source brought customers with higher LTV or faster churn. This works across all six billing sources; Freemius payments are matched to visitors by email only.
Chartsy also keeps things plain. The metrics a founder actually needs are there from the first sync, without the clutter of an enterprise BI tool. When you want a view of your own, such as MRR by plan next to churn by acquisition source, you build a custom dashboard around those numbers.
The tradeoff is scope. Chartsy natively connects Stripe, Paddle (Billing and Classic), Polar.sh, Freemius, Creem.io and Lemon Squeezy, and you can connect several at once to see one MRR number. It isn't a broad warehouse for every billing system; other sources go through its Custom API. Some features also depend on the source - metadata breakdowns, for example, work with Stripe and Paddle custom fields only. If you need a deep import model for Recurly or Chargebee, check the next options.
Teams comparing product fit can review Chartsy's SaaS analytics pricing. There is a 14-day trial with no card required, so you can test the workflow against your own billing data.
Key Takeaway: Choose Chartsy when you want to understand your MRR quickly and plainly, with acquisition results on the same dashboard.
2. ProfitWell Metrics, retention analysis, segmentation, and churn signals
ProfitWell Metrics is a subscription analytics product focused on revenue reporting, retention data, segmentation, and churn risk signals. Paddle describes it as a free product for subscription and SaaS companies.

It is best for teams that want ready-made retention views rather than a blank reporting workspace. The product includes real-time revenue, cash flow, retention data, customer health scores, cohort analysis, and pricing-plan segmentation.
The churn workflow is its strongest use case. Activity data helps teams find customers at risk of leaving, while health signals point toward accounts that may expand. A customer success lead could use plan and cohort views to see if churn clusters around one pricing tier.
Customizable alerts are useful for teams that review metrics on a set schedule. An alert about rising churn or falling retention can prompt a check before the next board meeting. Its API and integrations can also pass data into other systems.
One caveat is dashboard control. If your team wants to ask unusual questions across acquisition and billing data, a more flexible tool may fit better within the stated product scope.
ProfitWell Metrics makes sense when retention diagnosis is the main job. It is less suited to a founder who wants one connected view of marketing source, signup, MRR, and long-term value.
3. StripeReport, forecasting and scenario planning for Stripe data
StripeReport is a Stripe-focused reporting tool for recurring revenue metrics and forecasts. Its documented coverage includes MRR, ARR, churn, ARPU, active subscribers, revenue at risk, and cash flow forecasts.
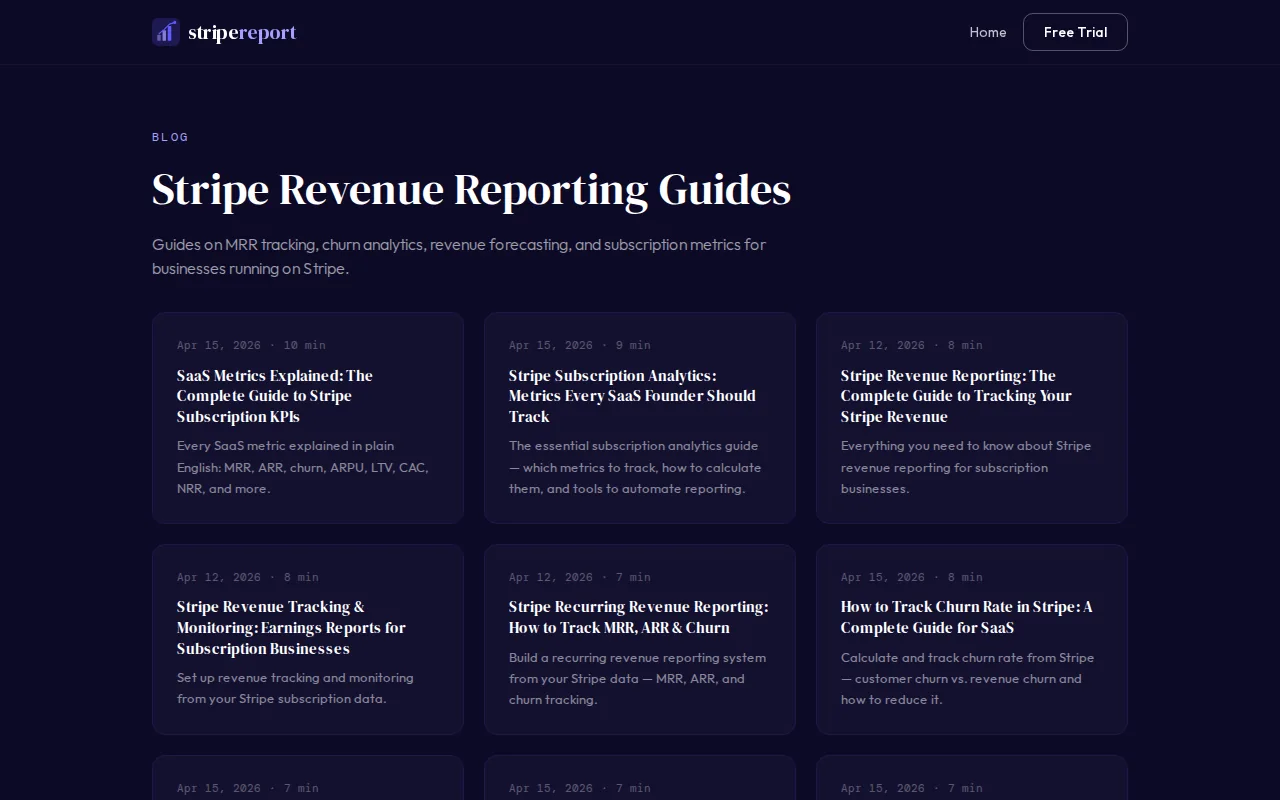
It is best for Stripe teams that need to look ahead. The renewal-based forecast uses subscription renewal dates, so a founder can estimate incoming revenue by day, week, or month. That is more useful for cash planning than a single current-MRR number.
The scenario planner adds a second layer. You can model what may happen if churn drops, growth rises, or pricing changes. Suppose a plan change raises ARPU but also increases cancellations. A scenario view can help frame the decision before you change every account.
StripeReport also focuses on operational warning signs. Reports can cover pending cancellations, past-due invoices, failed payments, and revenue at risk. Those signals matter because a revenue drop may start as a payment issue rather than a demand issue.
Its limitation is the Stripe-only focus. If you sell through Paddle, Lemon Squeezy or another provider as well, you'll need another source or a tool that combines those systems. StripeReport is a sound choice when Stripe is the source of truth and forecast detail matters more than cross-channel attribution.
For a team that checks cash flow each morning, the decision is simple: pick this type of tool when renewal timing matters as much as historical reporting.
4. Baremetrics, straightforward standard metrics for Stripe-only SaaS
Baremetrics is a subscription analytics dashboard for Stripe-based SaaS companies. Its standard coverage includes MRR, ARR, churn, LTV, ARPU, cohorts, and revenue movements.
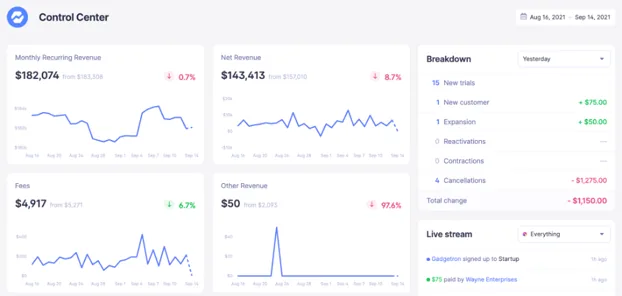
It is best for a Stripe-only company that wants a clean view without building SQL reports. A founder can use the dashboard to see how MRR changed, which plan is expanding, or where churn is rising.
The product's strength is speed and clarity. Baremetrics describes its setup as a way to process Stripe history into prebuilt SaaS metrics. That helps when the team has no analyst and needs a working view soon.
Its wider product set also covers revenue recovery and cancellation analysis. Failed payment work can sit beside the revenue view, which helps teams separate voluntary churn from payment problems. A cancellation dashboard can show why customers leave and guide a save offer or win-back message.
But Stripe remains the boundary. A company that adds another billing source may need a different reporting layer. Baremetrics also has limits for teams that need a warehouse connection, SQL-first workflow, or financial revenue recognition.
That makes Baremetrics a sensible fit for standard Stripe reporting, not a universal data system. Before choosing it, write down the questions your team will ask after the first month. If those questions include acquisition source, or revenue from Paddle, Polar.sh, Freemius, Creem.io or Lemon Squeezy, Chartsy may reduce the need for a second tool.
Teams that want to study customer loss in more detail can pair their tool choice with customer churn analysis methods for SaaS. The method matters as much as the dashboard.
5. ChartMogul, deep cohorts and customer journey analysis
ChartMogul is a subscription analytics product built for deep cohort work and customer-level revenue history. It supports billing data imports from systems such as Stripe, Recurly, and Chargebee, plus manual imports through API, CSV, or direct entry.
It is best for mid-sized or larger SaaS teams with more than one billing source. Finance and growth teams can compare cohorts, plan changes, retention curves, and customer revenue timelines in one model.
The data model is a major part of the product. ChartMogul needs customer, plan, invoice, and cancellation data before it can calculate subscription metrics. Once the data is imported, it generates subscriptions and calculates the relevant analytics from that model.
That setup gives teams more control over messy billing history. For example, a company with most customers in Stripe and a smaller direct-debit group can keep separate sources and review how those records feed the reports.
The tradeoff is setup work. Teams must check source data, imports, and metric differences before trusting the output. That effort can pay off when investor reporting or multi-source consistency is more important than instant answers.
ChartMogul is the stronger choice for detailed cohort investigation. Chartsy is the easier starting point when your data is in Stripe, Paddle, Polar.sh, Freemius, Creem.io or Lemon Squeezy and your first need is a clear MRR picture without an import project.
Subscription analytics comparison: Which tool fits your SaaS?
The best subscription analytics software depends on the question you need answered most often. Use this table to match the tool to the work, rather than picking the longest feature list.
| Tool | Best fit | Main strength | Watch for |
|---|---|---|---|
| Chartsy | Founders on Stripe, Paddle, Polar.sh, Freemius, Creem.io or Lemon Squeezy | Plain MRR breakdown, custom dashboards, a couple of minutes to set up, acquisition links | Some features vary by billing source |
| ProfitWell Metrics | Retention-focused teams | Segmentation, cohorts, health signals, and benchmarks | Custom dashboard limits |
| StripeReport | Stripe teams planning cash flow | Renewal forecasts and scenario planning | Stripe-only reporting |
| Baremetrics | Stripe-only SaaS | Clean standard metrics and revenue recovery workflows | Less suited to multi-source data |
| ChartMogul | Teams with complex or multiple billing sources | Deep cohorts and customer-level timelines | More import and data-check work |
One useful rule is to test the tool with a question that crosses two systems. For example: which acquisition source produced customers with the best six-month retention? If the answer needs exports and spreadsheet joins, the tool may not fit your operating style.
For a wider view of SaaS reporting layers, this revenue analytics guide explains how billing data connects with churn, retention, and customer value.
What to look for in subscription analytics software
Start with metric definitions. Ask how the tool treats trials, pauses, annual plans, refunds, proration, failed payments, upgrades, downgrades, and reactivations. Two tools can show different MRR if they handle the same billing event in different ways.
Then test the workflow, not just the dashboard. Can your team answer these questions without manual cleanup?
- Which plan lost the most MRR last month?
- Which source brought the highest-LTV customers?
- How much revenue is at risk from pending cancellations?
- What changed in retention for each signup cohort?
Also check data ownership and export options. A narrow integration set may be fine now, but a future billing move can change the cost of staying with a tool. If you also run an online store, a separate view such as online store analytics and custom reporting may need to sit beside SaaS reporting.
Pro Tip: Use one month of real billing data and ask the same five questions in every trial. The fastest demo is rarely the best test.
Consent can affect acquisition data too. If website attribution depends on tracking choices, document that setup and review your cookie settings information before judging channel performance.
FAQ
What is subscription analytics?
Subscription analytics is the measurement of recurring revenue and customer activity across a subscription business. It can include MRR, ARR, churn, LTV, ARPU, retention, upgrades, downgrades, refunds, and failed payments. The goal is to explain what changed in revenue and identify the customer or plan behavior behind it.
Which subscription analytics tool is best for a small SaaS?
Chartsy is the strongest fit for a small SaaS billing through Stripe, Paddle, Polar.sh, Freemius, Creem.io or Lemon Squeezy that wants a clear dashboard without setup work. It connects in a couple of minutes, shows what moved your MRR, and combines billing metrics with acquisition data, so you can compare channels by customers and MRR. Baremetrics or ProfitWell Metrics may fit better if you only need a standard revenue or retention dashboard.
Can subscription analytics show where customers came from?
Some subscription analytics tools can show acquisition source, but many focus only on billing data. Chartsy connects UTM-tagged visits and signups with subscription outcomes. That lets you compare a source by signup volume, paid conversion, MRR, and customer value instead of stopping at traffic.
What is the difference between MRR and ARR?
MRR is the normalized monthly value of active recurring subscriptions, while ARR is commonly based on recurring revenue projected across a year. MRR helps with month-to-month operating review. ARR is often used for larger planning and investor conversations, but teams should define treatment for discounts, pauses, and annual contracts.
Do I need a separate analytics tool if I use Stripe?
You may need one when Stripe's built-in views can't answer questions about churn, cohorts, LTV, or acquisition source. Stripe is useful for payment and subscription records. A separate subscription analytics layer turns those records into consistent metrics and trends that a founder or finance team can review. The same applies to Paddle, Polar.sh, Freemius, Creem.io and Lemon Squeezy, and it matters most once you bill through more than one of them.
Which billing platforms does Chartsy support?
Chartsy connects Stripe, Paddle (Paddle Billing and Paddle Classic), Polar.sh, Freemius, Creem.io and Lemon Squeezy. You can connect more than one and see a combined MRR view, and push data from any other billing system through the Custom API.
Conclusion
Choose Chartsy if your SaaS runs on Stripe, Paddle, Polar.sh, Freemius, Creem.io or Lemon Squeezy and you want the simplest way to understand your MRR, with revenue tied to the customers and channels behind it. Connect your billing data, let the history sync, then test five questions from your weekly review against the dashboard. If you need multi-source cohort work or finance-heavy reporting, compare the tradeoffs of ChartMogul, ProfitWell Metrics, StripeReport, and Baremetrics before you commit.
You can also review SaaS churn rate benchmarks to decide which metrics belong in your next operating review. For product context, Subscription & Revenue Analytics for your SaaS | Chartsy shows how the connected workflow works.

Written by
Chartsy TeamAnalytics team at Chartsy
The Chartsy Team writes guides, product updates, and resources to help SaaS and eCommerce founders make sense of their metrics, without SQL or spreadsheets.
Chartsy
