A high trial signup count can hide a weak path to payment. The trial to paid conversion rate shows what share of trial users actually become customers, but the number only helps when you define it well. You’ll learn the formula, how to read benchmarks, where users drop off, and what to fix first.
For small SaaS teams, the best starting point is a clean cohort view tied to billing data. Chartsy connects Stripe, Paddle, Polar.sh, Freemius, Creem.io, or Lemon Squeezy data to clear charts and custom dashboards, so you can inspect conversion without building reports by hand.
Table of Contents
- What Is Trial to Paid Conversion Rate?
- How to Calculate a SaaS Trial to Paid Conversion Rate
- What Is a Good Trial to Paid Conversion Rate?
- Why Trial Users Do Not Become Paying Customers
- How to Improve Trial to Paid Conversion Rate Without Chasing Vanity Metrics
- FAQ: Trial to Paid Conversion Rate
What Is Trial to Paid Conversion Rate?
The trial to paid conversion rate is the percentage of users who start a free trial and become paying customers within a defined time window.
The basic formula is:
Trial to paid conversion rate = paid conversions ÷ trial signups × 100
When people start a trial, some become paying customers after the full trial window ends. Divide those paid conversions by the trial signups to calculate your rate.
This metric measures movement between two funnel points. It doesn’t tell you why users converted or why they left. To answer that, you need activation events, product use, acquisition source, plan choice, and the timing of each action.
The time window matters. If your trial lasts 14 days, don’t judge a cohort on day five. Some users haven’t reached the point where they must decide. A late payment can also come after a reminder or a sales touch.
A clean setup uses the trial start date as the cohort key. Then you wait until the cohort has had enough time to mature. This avoids mixing new trials with older trials that had more time to convert.
The metric also differs from free-to-paid conversion. A free trial has a fixed evaluation period. Freemium gives users ongoing access with limits. Mixing the two groups makes the rate hard to interpret. Chartsy’s guide to freemium versus free trial models explains why the denominator changes with each model.
There’s another important split: opt-in trials don’t ask for a card, while opt-out trials start billing unless the user cancels. The second model may show a higher rate because it begins with more purchase intent. That doesn’t prove it produces more customers overall.
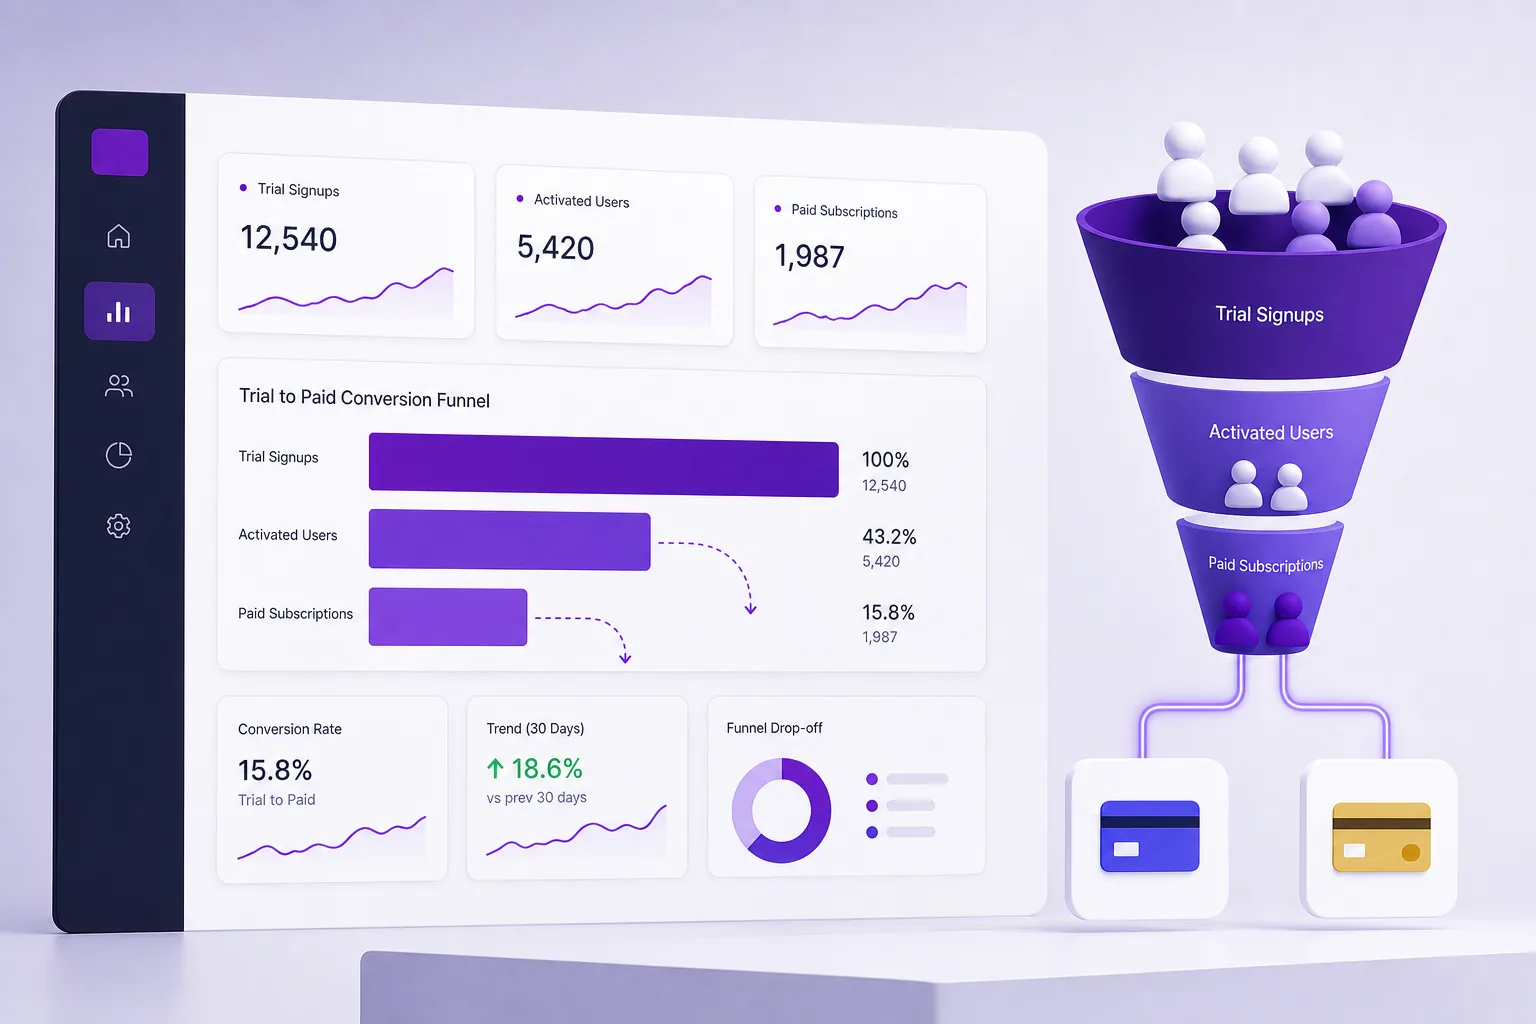
For a plain definition of the metric and its role as a SaaS KPI, a trial conversion rate reference provides useful background. Use the definition as a starting point, then set rules that match your own billing flow.
Key Takeaway: A useful conversion rate always names the cohort, trial model, conversion window, and event that counts as paid.
How to Calculate a SaaS Trial to Paid Conversion Rate
Calculating the rate is easy. Making the result trustworthy takes more care.
Start by writing down the four rules below before you pull numbers from Stripe, Paddle, or another system.
- Denominator: every user who started the trial during the chosen period.
- Numerator: users from that same group who became paid.
- Window: the time allowed for conversion after trial start.
- Unit: choose users or accounts, then keep that choice fixed.
Accounts matter more than seats for most B2B SaaS products. If one company invites six team members, counting six trial users can make the funnel look better than it is. Pick the entity that makes the buying decision and use it in every report.
Next, match paid status to a real billing event. A checkout click isn’t a conversion. A card added to an account isn’t always a conversion either. Count the point at which the account has an active paid subscription or a successful first payment, based on the rule your finance team accepts.
Suppose 320 accounts started trials in one month. Of those, 48 had an active paid subscription by day 21. The calculation is:
Calculate the rate by dividing paid conversions by trial signups, then multiplying by 100.
Don’t remove users who quit early. They belong in the denominator because they started the trial. Excluding them turns a funnel metric into a best-case result.
Track the result by trial start week, not only by calendar month. A monthly report can contain a mix of fresh and mature trials. Weekly cohorts make timing easier to see, especially when you change onboarding or pricing.
| Question | Good rule | What goes wrong if ignored |
|---|---|---|
| Who belongs in the denominator? | Every account that started the trial | Early drop-offs disappear |
| What belongs in the numerator? | A paid account from the same cohort | Older customers inflate the result |
| When do you measure? | After the trial window and late-payment buffer | Recent cohorts look weak |
| How do you group users? | By start week, source, plan, or segment | Strong and weak groups blur together |
| What should you inspect next? | Activation before pricing | You may fix the wrong problem |
A cohort report tells you what happened. It doesn’t explain the cause. If the rate falls, compare activation first. Look at who reached the first useful outcome, then compare those users with people who stopped earlier.
Chartsy shows trial-to-paid conversion after you connect your billing platform, with no report to build. Its ChartsyAI chart builder is useful when you need an extra chart quickly, but you should still check the definition behind the report.
A calculator can confirm the arithmetic. It can’t repair a poor event definition. A SaaS free-trial conversion calculator can help with the basic math, while your own data rules determine whether the answer means anything.
What Is a Good Trial to Paid Conversion Rate?
There is no single good trial to paid conversion rate for every SaaS business. Trial type, price, buyer role, product complexity, and sales motion all change the expected range.
For opt-in trials, a lower rate can be normal because more people can enter with little commitment. Some are researching. Some are testing a feature. Others may never have had a buying need.
Opt-out trials often convert at a higher rate because the signup step filters for intent. But the card requirement can reduce trial volume. The better comparison is paid customers per qualified visitor, not the percentage alone.
Price and sales cycle matter too. A low-cost self-serve product may convert quickly. A tool sold to a larger company may need security checks, team review, and a budget decision. Its trial rate can be lower even when the business is healthy.
Trial length changes the reading as well. Fourteen days is common in the benchmark material, while seven-day and 30-day trials also appear. A short trial can push users to act sooner. A longer trial may fit a product that needs setup or group use.
Don’t use a benchmark to defend a weak funnel. Compare your rate with your own past cohorts first. Then split the result by source, company type, plan, and activation behavior.
A single overall rate may hide two very different groups. Users who connect a data source could convert well, while users who never finish setup contribute little. That points to an activation problem, not a pricing problem.
Chartsy’s SaaS dashboard templates can give founders a clear place to watch trial performance beside subscriber growth and early churn. The goal is to judge customer quality, not to chase a higher percentage at any cost.
Pro Tip: Set a primary target for paid customers per qualified signup, then use conversion rate to find the step that blocks those signups.
Why Trial Users Do Not Become Paying Customers
A weak conversion rate usually starts before the pricing page. Users may never reach a useful result, may not understand the next step, or may have entered with the wrong expectation.
They never reach activation
Activation is the first action that proves value. For an analytics product, it might be connecting a billing source and viewing a useful report. For a collaboration tool, it might be inviting a teammate and completing a shared task.
Track that event directly. “Logged in” is too weak. A user can log in three times without learning why the product deserves a paid plan.
The first session has too much friction
Long tours can delay the one action that matters. So can empty dashboards, unclear setup steps, and requests for data before the user understands the payoff.
Give the user one clear next move. If setup needs several steps, show progress and explain what the next completed step will produce.
The message and product do not match
A visitor may expect a quick report but find a complex setup process. That mismatch can produce many signups with weak intent. The problem sits in acquisition and onboarding together.
Break down conversion by source. Chartsy’s signup-to-paid tracking guide is relevant when you need to connect the first visit with later payment instead of judging traffic on signup volume alone.
The upgrade path feels unclear
Users need to know what they get by paying and when payment begins. Hidden limits can feel like a trap. Too many plans can slow the choice. A loss-aversion case study on trial-to-paid conversion shows why upgrade prompts work best when they reflect value the user has actually received.
Show the plan that fits the user’s observed need. Put the upgrade action near the moment when the user reaches a real limit or sees a useful outcome.
You are reading an immature cohort
A fresh cohort may look poor simply because its trial window hasn’t ended. Don’t change pricing based on incomplete data. Mark incomplete cohorts clearly in every report.

Funnel analysis can show where users stop. It can’t always show the feeling behind the stop. Pair event data with cancellation answers, support notes, and short user interviews.
That mix keeps you from treating every drop-off as a product bug. Sometimes the user is a poor fit. Sometimes the price is wrong. Sometimes the product never made its value clear.
How to Improve Trial to Paid Conversion Rate Without Chasing Vanity Metrics
Improve the trial to paid conversion rate by fixing the path to value, then measure what happens after payment. A higher rate is useful only when new customers stay.
Define one activation event
Choose the first action that shows the user has received value. Make it specific and measurable. Then place it in the first-session flow.
For Chartsy, a team might track whether a new account connects Stripe, Paddle, or another billing platform and views a trial conversion report. That event says more than a page view because it shows the user reached the product’s main job.
Shorten time to value
Remove steps that don’t help the user reach the first result. Use sample data when an empty state would block learning. Give users a clear path if they need to connect an external source.
Measure the time between signup and activation. Then compare that time with paid conversion by cohort. If users who activate on day one convert more often, your first goal is clear.
Branch your onboarding messages
A user who has connected a data source needs a different prompt from someone who has not started setup. Send the first user toward a report. Help the second user clear the setup barrier.
Use behavior as the trigger, not only the number of days since signup. Early messages should teach the next action. Later messages can address plan choice, trial expiry, or unanswered objections.
Test pricing with the right metric
Don’t judge a pricing test by conversion alone. Watch paid customers, new MRR, refunds, and early churn. A rate increase that brings low-fit customers can hurt the business later.
Chartsy’s SaaS pricing calculator guide is useful when you want to connect plan changes with ARPU and retention. Test a small segment first, then wait long enough to see early customer behavior.
Compare sources by revenue quality
A source with many trial signups may produce fewer paid accounts than a smaller source. Traffic volume can hide poor fit.
Follow the full path:
- Source to visitor.
- Visitor to signup.
- Signup to activation.
- Activation to paid account.
- Paid account to MRR and retention.
Chartsy joins acquisition data with subscription data, which helps founders see which source brings customers with the strongest conversion and retention. That view is often more useful than a dashboard that stops at clicks.
Review the first 90 days after conversion
Conversion is the start of the revenue relationship. Check whether new customers stay active after the first payment. If early churn is high, your trial may promise more than the product delivers.
Keep a simple test log. Write down the cohort, change, expected result, and review date. That stops the team from treating random movement as proof.
When the data is spread across billing and site analytics, a tool such as Chartsy can reduce the manual work. You can open a clear breakdown, then inspect the chart before deciding what to change. If you are comparing analytics platforms, the Chartsy vs ChartMogul comparison can help clarify which workflow fits your reporting needs.
FAQ: Trial to Paid Conversion Rate
What is a good trial to paid conversion rate for SaaS?
A good rate depends on your trial model, price, buyer, and sales cycle. An 8% median is reported in one 2026 B2B software benchmark, but that figure isn’t a universal goal. Compare mature cohorts against your own history, then split the result by activation and acquisition source.
How do I calculate free trial conversion?
Divide paid conversions by total trial signups, then multiply by 100. Count every trial that started in the cohort, including users who left early. Measure the group after the full trial window so recent signups don’t make the trial to paid conversion rate look lower than it will be.
Should I require a credit card for a free trial?
Require a card only if the added intent outweighs the lost signup volume. Card-required trials often show higher conversion, but fewer people may start. Compare paid customers per qualified visitor and early churn before changing your signup flow.
Why might a trial conversion rate fall?
A falling rate may point to slower activation, lower-quality traffic, unclear pricing, or an immature cohort. Check trial start weeks first. Then compare the share of users who reached your activation event. This separates a reporting issue from a product or acquisition issue.
Can Chartsy track trial conversions?
Chartsy tracks subscription data from Stripe, Paddle, and other billing platforms like Polar.sh, Freemius, Creem.io, and Lemon Squeezy, including trial conversions, through clear charts and custom dashboards. It can also connect acquisition sources with signup and revenue outcomes. That helps small teams compare conversion by source instead of relying on one overall percentage.
Set one clear conversion definition, measure complete cohorts, and inspect activation before changing your pricing. Start with your last mature cohort today. If billing and acquisition data live in separate places, connect them in Chartsy and see which sources produce paid customers that stay.

Written by
Chartsy TeamAnalytics team at Chartsy
The Chartsy Team writes guides, product updates, and resources to help SaaS and eCommerce founders make sense of their metrics, without SQL or spreadsheets.
Chartsy
