You're staring at a dashboard that flashes numbers, but you don't know which ones matter. Below is a step‑by‑step guide that takes the guesswork out of SaaS growth tracking and shows you how to turn raw data into clear actions.
Table of Contents
- Step 1: Define the SaaS Growth Metrics That Match Your Goals
- Step 2: Build a Reliable MRR and ARR Baseline
- Step 3: Measure Churn, Retention, and Customer Quality
- Step 4: Connect Acquisition Metrics to Customers and Revenue
- Step 5: Turn Metric Changes Into Weekly Actions
- FAQ
- Conclusion
Step 1: Define the SaaS Growth Metrics That Match Your Goals
Start with the business question you need to answer. Are you trying to prove product‑market fit? Do you need to convince investors of runway? Each goal points to a core set of metrics.
For product‑market fit, focus on churn and net revenue retention (NRR). For fundraising, surface MRR, ARR, and LTV‑to‑CAC ratio. For budgeting, add CAC payback period and gross margin. The six metrics that show up most often are:
- Monthly Recurring Revenue (MRR)
- Annual Recurring Revenue (ARR)
- Customer churn (logo and revenue)
- Net Revenue Retention (NRR)
- Customer Lifetime Value (LTV)
- Customer Acquisition Cost (CAC)
Chartsy can pull Stripe and Paddle data into a single view, so you don’t have to build a spreadsheet for each metric. The platform also auto‑calculates the formulas above, which saves hours of manual work. For a practical reference, see Chartsy’s SaaS metrics guide.
Why does this matter? Because every metric tells a story. MRR shows current scale, churn shows leakage, and NRR tells you whether existing customers are expanding. Recurring revenue is the predictable portion of a subscription business, and that definition underpins all the numbers you’ll track.
Key Takeaway: Pick metrics that directly answer your top business question, then let a tool like Chartsy do the heavy lifting.
Step 2: Build a Reliable MRR and ARR Baseline
The first thing you need is a clean MRR number. Pull every active subscription from your billing system, strip out one‑time fees, and normalize annual contracts to a monthly amount. For example, an annual deal becomes a corresponding monthly MRR amount.
Next, calculate ARR by multiplying the final MRR by 12. This gives you an annual view that investors love. The trick is to keep the calculation consistent month over month; otherwise downstream metrics will wobble.
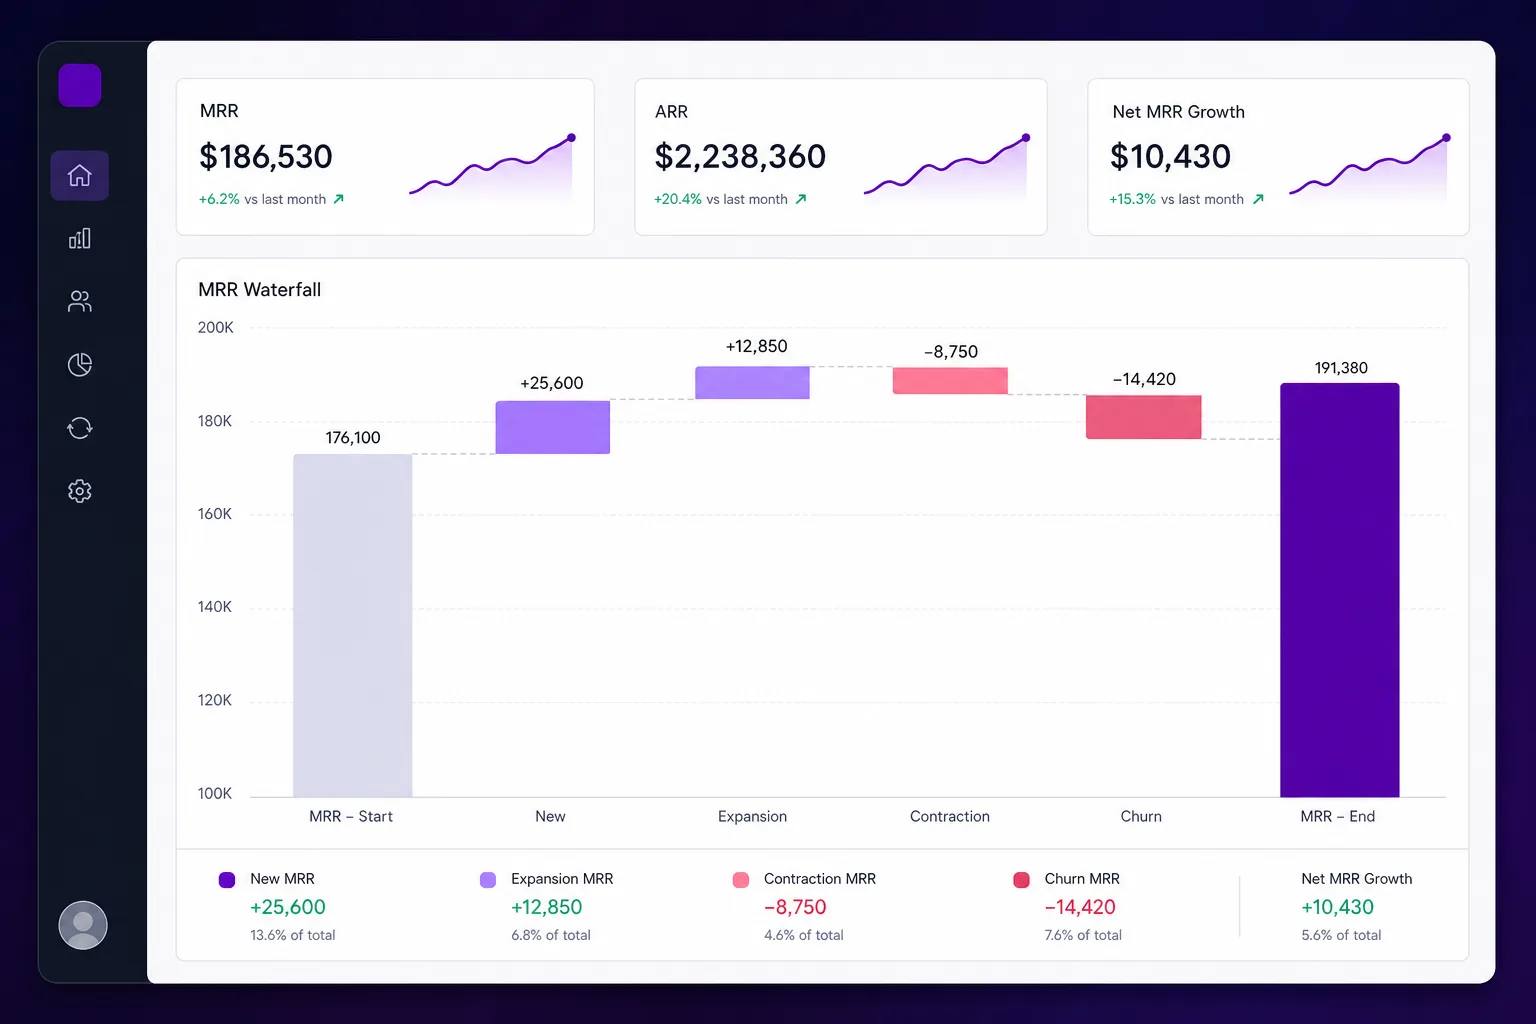
Here’s a quick table that shows a simple waterfall for a single month, starting from $38,000 in MRR:
| Component | Value |
|---|---|
| Starting MRR | $38,000 |
| New MRR | $3,600 |
| Expansion MRR | $1,800 |
| Contraction MRR | -$1,200 |
| Churned MRR | -$2,500 |
| Ending MRR | $39,700 |
That's a net gain of $1,700, or about 4.5%, for the month. Notice how a complete waterfall should reconcile the starting MRR with all movements: $38,000 + $3,600 + $1,800 − $1,200 − $2,500 = $39,700. If your own numbers don't reconcile that cleanly, you probably missed a refund or a failed payment somewhere in the export.
Chartsy’s “Growth” feature tags each movement automatically, so the table above can be generated with a click. The simple MRR × 12 formula works for most SaaS businesses, as long as you treat annual contracts consistently.
Pro Tip: Record the source of every subscription (e.g., direct, referral, marketplace) at the moment of signup. That data fuels later acquisition analysis.
Step 3: Measure Churn, Retention, and Customer Quality
Churn comes in two flavors: logo churn (customers lost) and revenue churn (MRR lost). Both matter, but they tell different stories. High logo churn with low revenue churn means you’re losing small accounts; the opposite signals you’re losing big, high‑value accounts.
Net Revenue Retention (NRR) pulls the picture together. It adds expansion MRR and subtracts contraction and churn MRR, then divides by starting MRR. An NRR above 100 % means the existing book is growing without new sales.
Customer Lifetime Value (LTV) is the total gross‑margin revenue you expect from a customer. The formula is ARPU × gross‑margin ÷ monthly churn. Wikipedia defines LTV and walks through the math, which helps you set a sensible CAC target.
Chartsy surfaces churn buckets (new, expansion, contraction, churned, reactivation) in a single view, so you can spot whether a spike is due to failed payments, downgrades, or outright cancellations. Related resource
When you see a rise in churn, ask three questions: Is it voluntary or involuntary? Which plan tier is bleeding? Which acquisition source does the churned cohort belong to? Answering those quickly narrows the fix.
Step 4: Connect Acquisition Metrics to Customers and Revenue
Marketing teams love clicks; finance teams love dollars. The bridge is a unified customer record that stores the first‑touch source and every subsequent payment event.
Capture the UTM parameters at signup and write them to the same customer ID that your billing system uses. When the payment lands, you can query: "How much MRR did channel X generate in the last 30 days?" That answer is far more useful than a raw click count.
Chartsy’s Growth feature does the join for you. It pulls the source field from the signup event, then rolls up the associated MRR, expansion, and churn. You end up with a table that looks like this, using the same $3,600 in new MRR and $1,800 in expansion from the waterfall above, broken out by channel:
| Channel | New MRR | Expansion MRR | Churned MRR |
|---|---|---|---|
| Product Hunt | $1,400 | $200 | -$300 |
| Paid Search | $1,100 | $600 | -$900 |
| Referral | $1,100 | $1,000 | -$1,300 |
Referral brings in the least new MRR of the three but drives the most expansion and carries the highest churn — a signal worth digging into before assuming it's the weakest channel. Use fields like these to compare customer and revenue outcomes across acquisition channels, rather than relying on click volume alone.
First‑touch and last‑touch models show different parts of the customer journey, so keeping the source on the customer record matters.
Step 5: Turn Metric Changes Into Weekly Actions
Metrics are only as good as the decisions they drive. Set up a weekly cadence where you review the waterfall chart, the churn risk list, and the acquisition ROI table.
Pick a handful of triggers: a churn rate above 4 % for two weeks, a drop in activation rate below 30 % for a cohort, or a channel’s LTV falling under the 3 × CAC rule. When a trigger fires, assign an owner and a concrete play.
Typical plays look like this:
- Win‑back email series for accounts flagged with involuntary churn.
- Targeted upsell campaign for users who have hit the “aha” moment but stay on the low tier.
- Budget reallocation from a channel whose month‑three LTV is below the median.
Chartsy can generate a task queue from the dashboard, so the operations team sees exactly which accounts need a call or an email. That turns a static report into a live to‑do list.

By the end of each week you should have a short list of "who, what, and when", a concrete plan that moves the needle on growth.
FAQ
What are the most important SaaS growth metrics?
The core set includes MRR, ARR, churn (both logo and revenue), NRR, LTV, CAC, and CAC payback period. Together they show scale, retention, efficiency, and runway.
How do I calculate MRR from annual contracts?
Divide the total contract value by 12 and add the result to your monthly total. This spreads the revenue evenly across the year and prevents spikes in the month you receive payment.
Why does NRR matter more than gross revenue churn?
NRR captures expansion revenue from existing customers, so a business can grow even if it stops acquiring new users. Gross churn only shows loss and hides the upside from upsells.
How can I link acquisition sources to revenue?
Store the first‑touch UTM parameters on the customer record at signup, then join that field to your billing data. The joined view lets you sum MRR, expansion, and churn by channel.
What weekly actions should I take when churn spikes?
First, identify if the churn is voluntary or involuntary. Then run a win‑back email series for payment failures, and have a success manager reach out to high‑value accounts that cancelled.
Conclusion
Start with a clean MRR baseline, layer on churn and retention, tie every subscriber back to its acquisition source, and turn the resulting alerts into a weekly to‑do list. Chartsy does the data plumbing so you can focus on the actions that grow revenue.

Written by
Chartsy TeamAnalytics team at Chartsy
The Chartsy Team writes guides, product updates, and resources to help SaaS and eCommerce founders make sense of their metrics, without SQL or spreadsheets.
Chartsy
