
A SaaS company generates data on three separate fronts - what visitors do on the marketing site, what users do once they're in the product, and what happens to their subscription after they pay - and almost no team runs all three through one tool. This list covers all three categories: subscription-revenue platforms, in-product behavioral analytics, and the acquisition/infrastructure layer that connects them, with 11 tools matched to the specific job each one does best.
Table of Contents
- 1. Chartsy (Our Top Pick) — AI-Powered Subscription Revenue Analytics
- 2. Mixpanel — Event-Based Product Analytics for SaaS Teams
- 3. Amplitude — User Journey and Behavioral Analysis
- 4. PostHog — Open-Source Analytics with Session Replay and Feature Flags
- 5. ChartMogul — Subscription Revenue Metrics and MRR Tracking
- 6. Baremetrics — Stripe Revenue Analytics and Benchmarking
- 7. Pendo — Product Adoption, Onboarding, and In-App Guidance
- 8. Heap — Autocapture Analytics with No-Code Event Tracking
- 9. Segment — Data Infrastructure and Customer Data Platform
- 10. Google Analytics 4 — Web Traffic and Acquisition Tracking
- 11. Kissmetrics — Person-Based Marketing Funnel Analytics
- How to Choose the Right SaaS Analytics Tool for Your Stage
- FAQ
- Conclusion
1. Chartsy (Our Top Pick) — AI-Powered Subscription Revenue Analytics
Chartsy is an AI-powered analytics platform that connects directly to Stripe and Paddle and turns your subscription data into charts and dashboards from plain-English questions. Type "What was my MRR last 90 days by plan?" and you get a chart. No SQL. No exports. No separate BI layer.
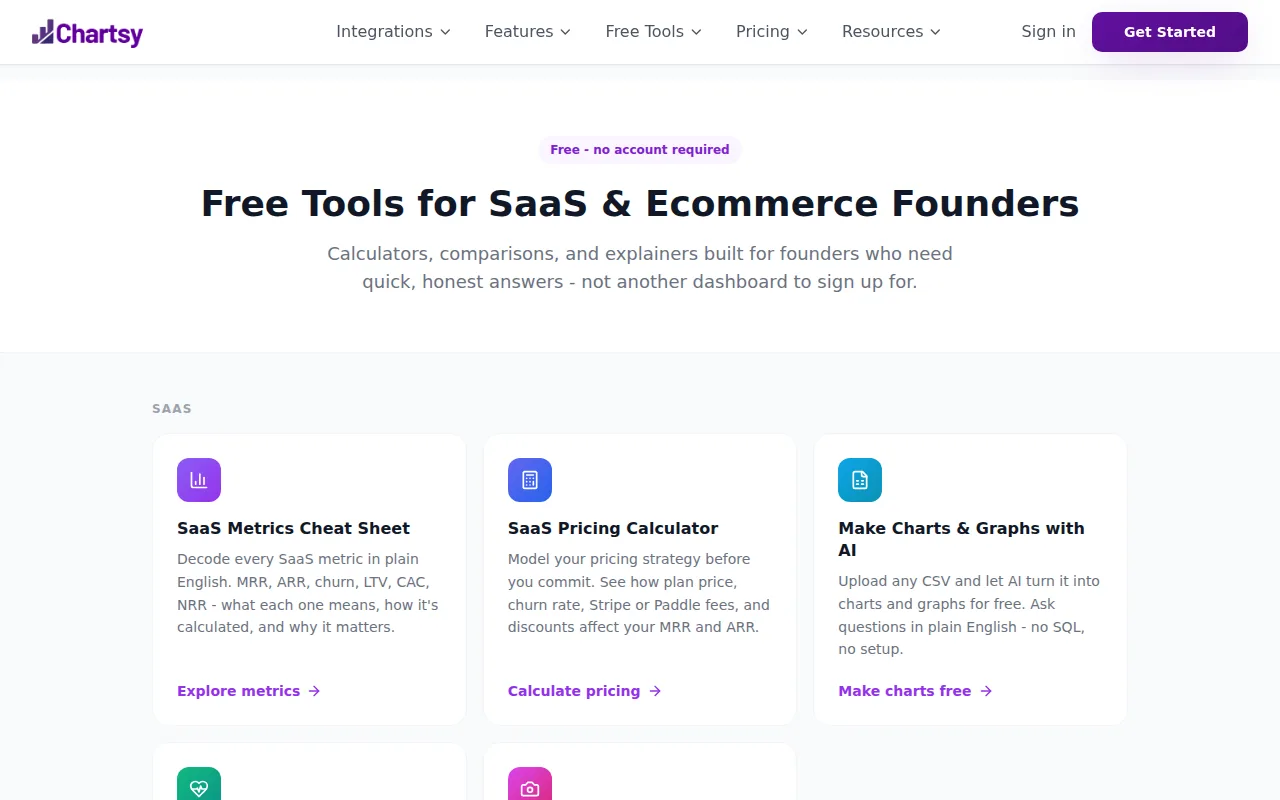
This matters because most subscription analytics tools give you a fixed set of dashboards. Chartsy lets you ask the question you actually have right now, not the question the tool predicted you'd have. That's a real difference when you're trying to figure out why MRR dropped in a specific cohort or which plan tier has the worst churn rate.
Chartsy is built for SaaS founders, finance teams, and revenue ops. It covers the metrics that matter most to a subscription business: MRR, ARR, churn rate, expansion MRR, contraction, LTV, ARPU, trial conversions, failed payments, and cohort-level revenue retention. Multi-account support means you can manage more than one Stripe or Paddle account from one place.
The AI natural-language query engine is the thing that separates Chartsy from every other tool in the subscription analytics market. When our research compared 15 SaaS analytics tools, only a small number offered any form of conversational AI at all. Most rely on static dashboards. Chartsy's whole model is built around answering questions, which means you get the answer to the question you actually asked, not a pre-built report you have to interpret.
If you're using Stripe or Paddle and want to understand your recurring revenue performance without hiring a data analyst, Chartsy is the right starting point. The caveat: if your primary need is in-app product behavior (funnels, session replay, feature adoption), Chartsy isn't designed for that. It's focused on subscription revenue data, and it does that job well.
Key Takeaway: Chartsy is the only tool in this list that combines AI natural-language queries with native Stripe and Paddle support, making it the fastest path from raw billing data to clear revenue answers.
2. Mixpanel — Event-Based Product Analytics for SaaS Teams
Mixpanel tracks what users do inside your product. Not pageviews or sessions, discrete actions. "User completed onboarding," "User hit the upgrade screen," "User cancelled subscription." It builds funnels, retention curves, and cohort analyses from those events.
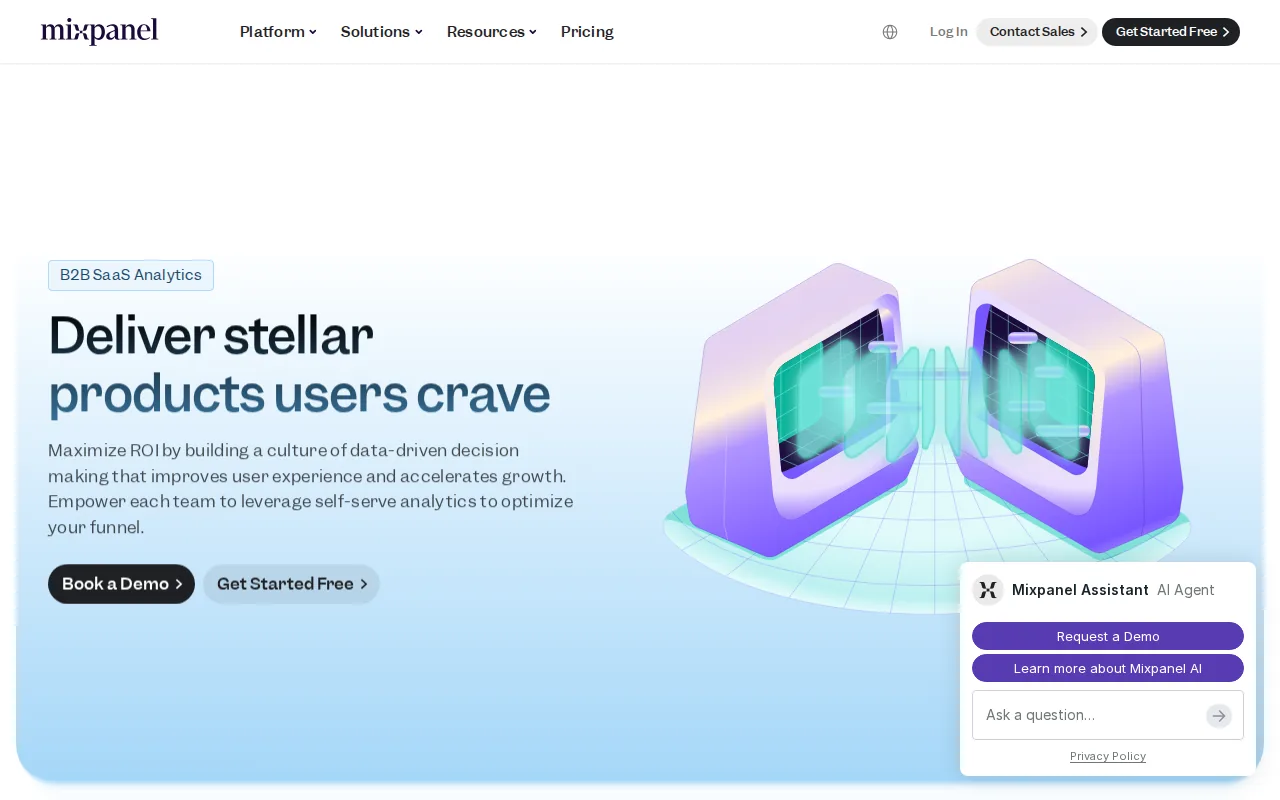
Mixpanel was founded in 2009 and has grown into one of the most established dedicated product analytics platforms in the market. Its retention charts are particularly strong, you can see N-day, unbounded, and custom retention windows side by side, and filter by user properties to understand which cohorts actually stick.
The free plan covers up to 1 million events per month, which is enough for most early-stage teams. Paid plan pricing is available on request or on their website. The main limitation is data warehousing: Mixpanel stores events in its own system, so if your source of truth is Snowflake or BigQuery, you'll need to pipe data in or out. It also doesn't touch subscription revenue metrics like MRR or churn, so product teams usually pair it with a separate revenue analytics tool.
Best for product and growth teams that need fast, flexible funnel and retention analysis without SQL. Not the right tool if your primary questions are about subscription revenue health.
3. Amplitude — User Journey and Behavioral Analysis
Amplitude is the enterprise-grade option for product analytics. It maps user journeys across web and mobile, runs A/B tests, and builds behavioral cohorts that predict which users will expand or churn before the revenue data shows it.
Where Amplitude earns its spot over Mixpanel is in the depth of its journey analysis and built-in experimentation. You can define behavioral cohorts, users who completed a specific onboarding step in their first session, and compare their 90-day retention against users who didn't. The A/B testing layer runs directly against those same metrics, so you don't need a separate experimentation tool.

The free Starter plan exists but has significant limits. Growth plans are available on request, and enterprise pricing is custom. That cost is a real consideration. If you're pre-Series B, Mixpanel likely gives you 90% of what Amplitude offers at a fraction of the price. Amplitude makes sense when you have a dedicated analytics function and need enterprise-grade governance, permission management, and cross-platform journey stitching.
One honest caveat: Amplitude's power comes with complexity. Setting it up properly takes time and a clear event taxonomy upfront. Teams that rush the instrumentation end up with dashboards full of data they can't trust.
4. PostHog — Open-Source Analytics with Session Replay and Feature Flags
PostHog bundles event tracking, session replay, feature flags, A/B testing, and user surveys into one open-source platform. For engineering-led teams that care about data ownership, it's one of the strongest options available right now.
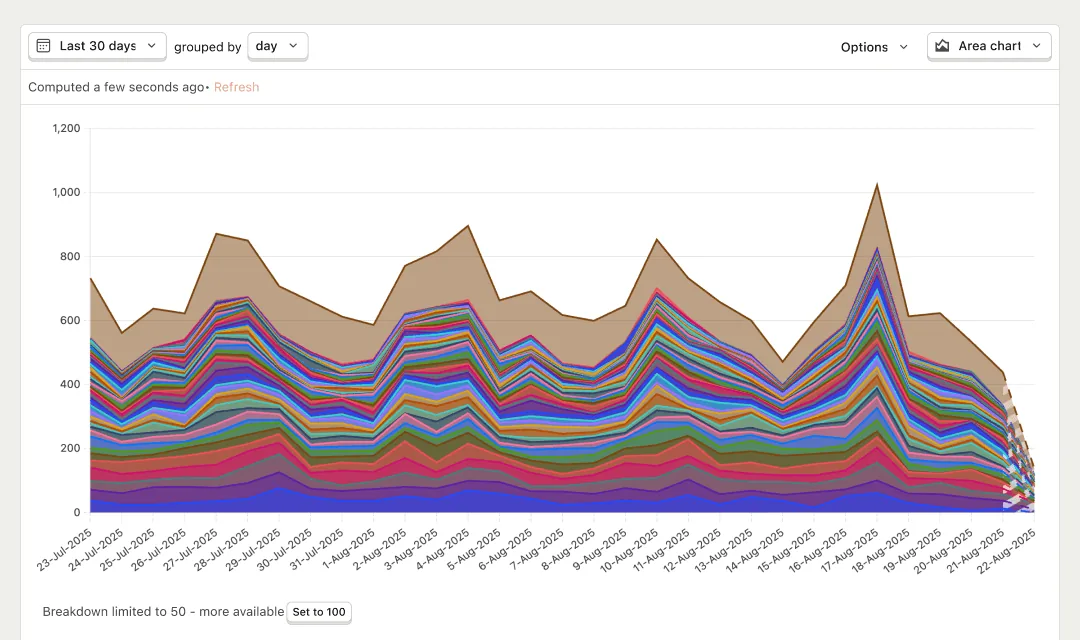
The session replay feature is especially useful for SaaS teams trying to understand where users get stuck. PostHog's replays include console logs, network activity, and performance metrics, so you can find the root cause of a drop-off without leaving the tool. AI session summaries highlight key moments automatically, which saves time when you're reviewing dozens of recordings. The free tier covers 1 million analytics events, a generous number of session recordings, and 1 million feature flag requests per month.
The open-source angle is a genuine advantage for teams worried about privacy and data ownership. You can self-host PostHog on your own infrastructure, which keeps all user data inside your control. This matters a lot for EU-based SaaS companies handling GDPR. The tradeoff is that self-hosting requires real DevOps resources to maintain at scale.
PostHog is best for technical, engineering-led SaaS teams that want one platform to handle analytics, feature flags, and experimentation together. If you want a tool your marketing team can use without writing code, the learning curve might be steep. But for a developer building their first SaaS product, it's probably the best free starting point in the market.
5. ChartMogul — Subscription Revenue Metrics and MRR Tracking
ChartMogul is purpose-built for subscription revenue analytics. It connects to Stripe, Paddle, Braintree, and App Store Connect to give you MRR, ARR, churn, expansion MRR, net revenue retention, and LTV with cohort-level segmentation.
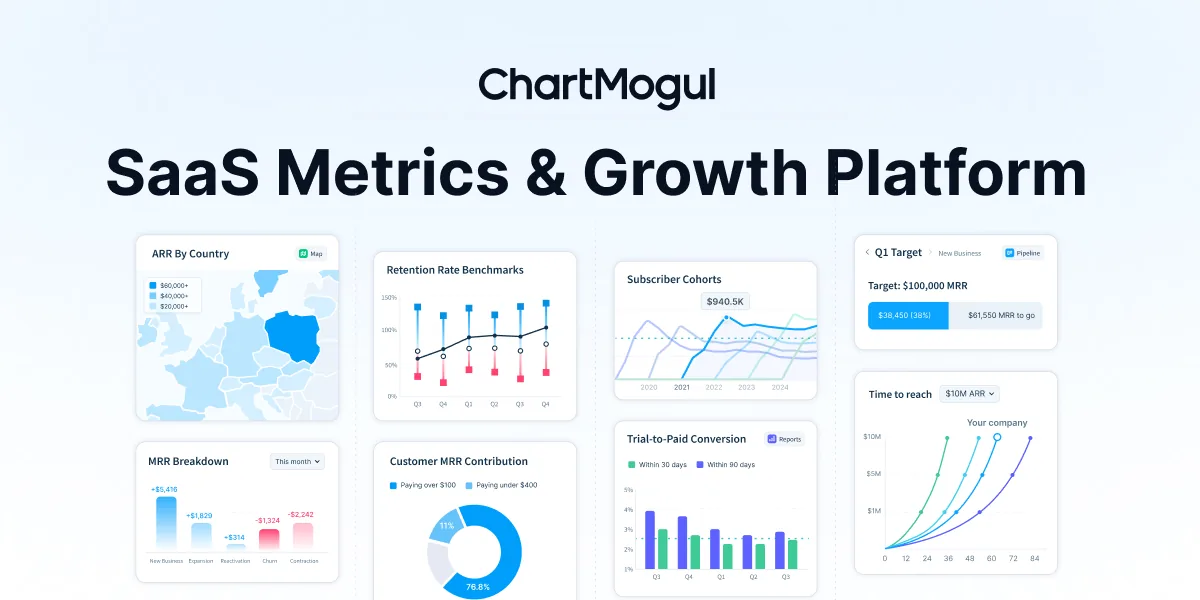
The thing ChartMogul does particularly well is cohort-level revenue analysis. You can compare churn rates by plan, see which signup cohorts produce the most durable revenue over 12 months, and track expansion by customer segment. For a finance team or a founder presenting to investors, those cohort charts are exactly what you need.
ChartMogul also does a solid job cleaning messy billing data. Real Stripe data has gaps: refunds, failed payments, plan changes, and manual adjustments all need to be reconciled before your MRR number means anything. ChartMogul handles that automatically. Free plan covers up to $10K MRR, with paid plans starting around $99 per month.
The limitation is that ChartMogul is a fixed-dashboard product. You get the reports ChartMogul built, not the reports you need for your specific business questions. If your analysis frequently goes off-script, combining revenue cohorts with custom metadata or asking questions ChartMogul's UI doesn't expose, you'll hit walls. That's the gap Chartsy was built to close.
6. Baremetrics — Stripe Revenue Analytics and Benchmarking
Baremetrics is one of the fastest ways to get a clean MRR dashboard if you're on Stripe. Connect your Stripe account and you have MRR, ARR, churn, LTV, and customer counts within minutes.
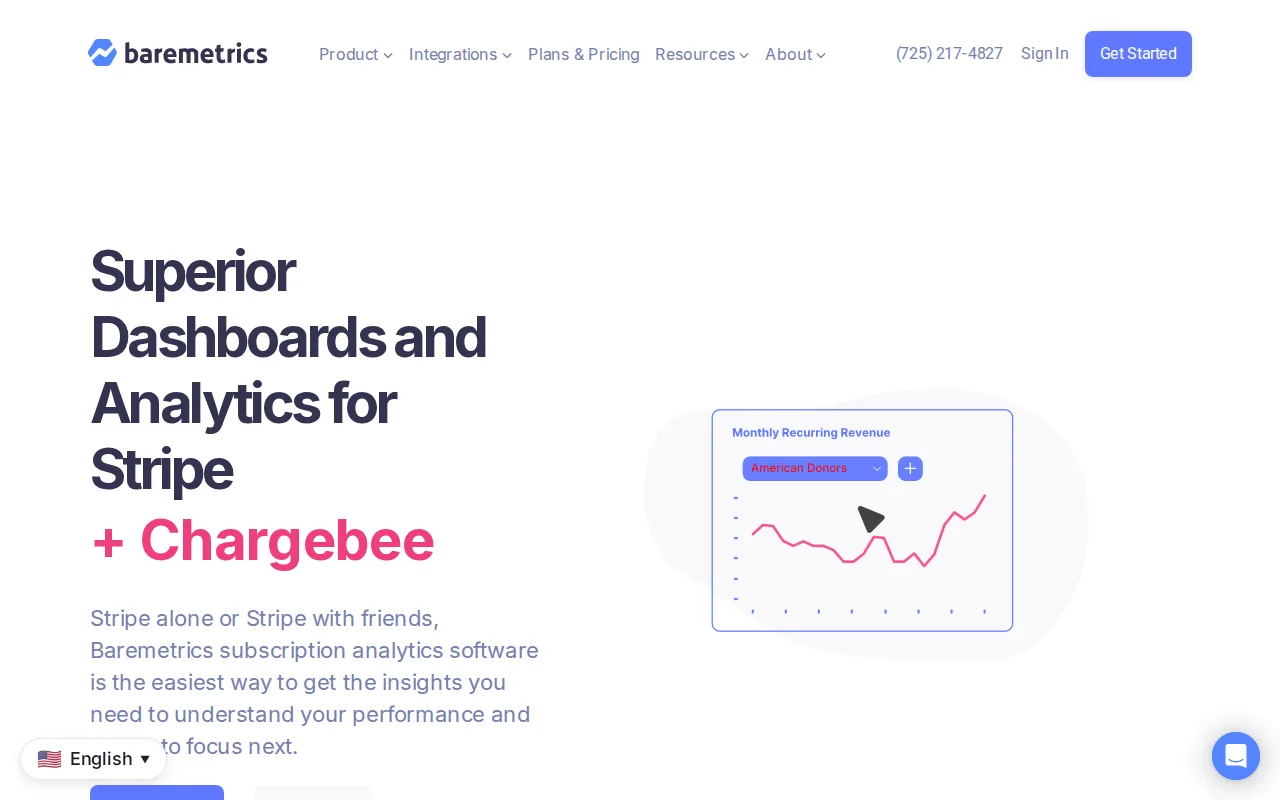
Two things make Baremetrics useful beyond basic metrics. First, its benchmarking feature lets you compare your churn rate and MRR growth against anonymized data from other SaaS companies at similar revenue levels. Seeing that your monthly churn is above the benchmark for your cohort is actionable in a way that looking at your own number in isolation isn't. Second, the dunning and payment recovery tools help reduce involuntary churn from failed payments, which is often a larger revenue leak than founders realize.
Pricing starts around $49 per month, scaling with your MRR. That's a reasonable entry point for early-stage founders. The main limitation is Stripe dependency, Baremetrics is designed specifically for Stripe and doesn't have the same depth of integration with other payment processors. If you're on Paddle or Braintree, ChartMogul or Chartsy are better fits. For a detailed breakdown of how Baremetrics stacks up directly against Chartsy on features and pricing, the Chartsy vs Baremetrics comparison is worth a look before you decide.
7. Pendo — Product Adoption, Onboarding, and In-App Guidance
Pendo is in a slightly different category from the other tools here. It combines product analytics with in-app guides, onboarding walkthroughs, and qualitative feedback collection. The goal is not just to measure what users do, but to actively guide them toward activation and feature adoption.

The in-app guidance layer is where Pendo earns its spot. You can build onboarding checklists, feature announcements, and contextual tooltips without writing code. When a user reaches a specific screen for the first time, Pendo can show a walkthrough. When you ship a new feature, Pendo can announce it to the right user segment. This closes the loop between analytics (what are users not discovering?) and product experience (show them).
Pendo also does retroactive analytics, which means it captures user interactions and lets you analyze them after the fact, even for events you didn't explicitly instrument upfront. That's useful when you're trying to understand how users got to a specific screen without having planned the tracking in advance.
The pricing is MAU-based and can get expensive quickly as you scale. Pendo is best for product teams at growth-stage SaaS companies where onboarding and feature adoption are a known problem. Early-stage teams with under a few thousand users might find PostHog or Mixpanel more cost-effective until they hit the scale where structured onboarding tooling makes financial sense.
8. Heap — Autocapture Analytics with No-Code Event Tracking
Heap's core idea is simple: it records every user interaction automatically, without you having to define events upfront. Every click, tap, form submission, and page view gets captured. You analyze it later.
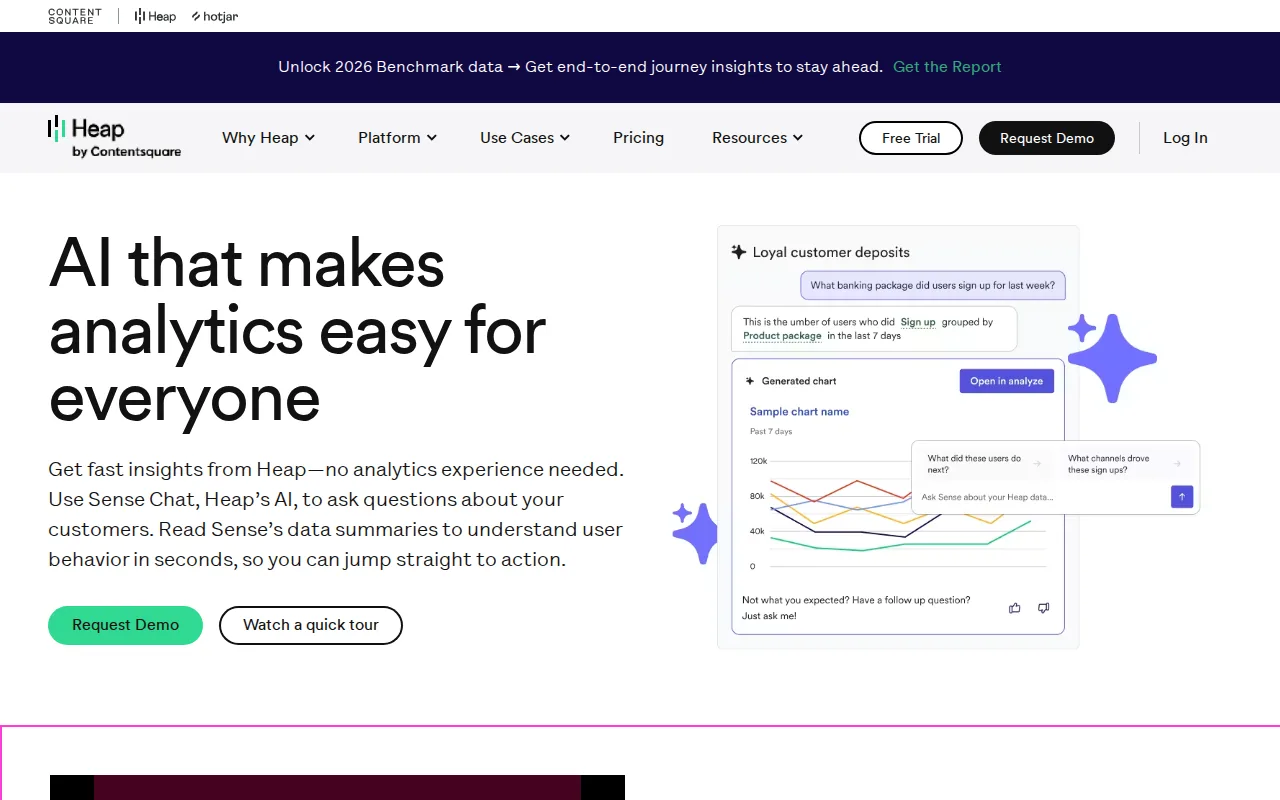
This matters because the usual workflow for product analytics is: decide what to track, instrument it, wait for data, then analyze. With Heap, you skip the first two steps. You can go back and define events retroactively using visual labeling, point at a button in the UI and name the event, and Heap fills in the historical data for that event back to when it first started capturing. That's genuinely useful when a question comes up that you hadn't planned for.
The no-code event tracking also means non-technical team members can define events themselves without filing tickets to engineering. Product managers and growth teams can move faster when they're not waiting for implementation.
The tradeoff is data volume. Capturing everything creates large datasets that can be slower to query and more expensive to store at scale. Heap's pricing is session-based and can escalate quickly for high-traffic products. It's also a managed SaaS product only, no self-hosted option, which matters for data sovereignty concerns. Best for product teams that want retroactive analysis without a heavy upfront instrumentation investment.
9. Segment — Data Infrastructure and Customer Data Platform
Segment is less of an analytics tool and more of the plumbing that connects your analytics tools. It collects event data from your product and routes it to over 100 downstream destinations: Mixpanel, Google Analytics, HubSpot, your data warehouse, and dozens more.
The value of Segment is consistency. Without it, different teams instrument different tools differently, and you end up with event names that mean different things in different places. Segment enforces a single event schema across your entire stack. When you change how you name an event, you change it once in Segment and every downstream tool updates automatically.
For SaaS teams that already use multiple analytics tools, Segment is worth evaluating as infrastructure. If you want Mixpanel for product analytics, ChartMogul for subscription revenue, and HubSpot for CRM, Segment keeps all three in sync from one event source. The free plan covers a limited number of monthly tracked users, which works for small teams. Paid plans scale with usage.
The honest caveat: Segment adds a layer of complexity. If you're just starting out and using one or two tools, you probably don't need it yet. It becomes more valuable when you have multiple data destinations and the cost of data inconsistency is real. Teams scaling past the early stage find it most useful when a dedicated data engineering function takes ownership of the schema.
10. Google Analytics 4 — Web Traffic and Acquisition Tracking
GA4 is still the default for tracking web traffic, acquisition sources, and top-of-funnel conversion. It's free, integrates with Google Ads, and gives you a baseline view of where your visitors come from and what they do on your marketing site.
For SaaS companies, GA4 is most useful for marketing analytics: which channels drive signups, how paid campaigns perform, how organic search converts compared to direct traffic. It's not a product analytics tool and it's not a subscription revenue tool. Using it to understand what happens after a user signs up is possible but awkward, it's not what the tool was built for.
One thing worth knowing: GA4 requires careful configuration to be GDPR-compliant in the EU. You need Consent Mode v2 with a default-deny state, a signed Data Processing Agreement, IP anonymization, and EU data storage settings. Without those configurations, GA4 is not compliant out of the box, and regulators have taken action against improperly configured Google Analytics deployments.
Also worth noting: the migration from Universal Analytics to GA4 was disruptive, and many teams found the new interface significantly harder to use. If you're already invested in GA4 and it meets your acquisition tracking needs, stick with it. But for dee, you'll need something else alongside it.
11. Kissmetrics — Person-Based Marketing Funnel Analytics
Kissmetrics takes a person-based approach to analytics. Instead of tracking events in the abstract, every action ties back to a specific person across sessions and devices. That makes it stronger than GA4 for understanding how individual users move through your marketing funnel over time.
The revenue attribution features are the main reason to consider Kissmetrics over GA4 for SaaS. You can tie specific marketing campaigns to actual paying customers and see which acquisition channels produce users who convert and retain, not just users who sign up. That's a meaningfully different question, and Kissmetrics answers it better than most free tools.
Where Kissmetrics shows its age is in the breadth of its feature set compared to newer competitors. Mixpanel and Amplitude have both overtaken it on product analytics depth, and dedicated subscription platforms handle revenue metrics better. Kissmetrics sits in a middle ground: better than GA4 for person-level marketing attribution, but not as deep as Amplitude for product analytics. It's a reasonable choice for marketing teams at SaaS companies that need to connect ad spend to customer revenue without a full data warehouse setup.
Pro Tip: Before picking any analytics tool, write down the three business questions you most need to answer right now. Then check whether each tool on this list actually answers those questions natively, not whether it technically could with enough configuration.
How to Choose the Right SaaS Analytics Tool for Your Stage
The research behind this list found that the SaaS analytics market clusters into three groups: subscription-revenue platforms (Chartsy, ChartMogul, Baremetrics), product-behavior platforms (Mixpanel, Amplitude, Pendo, Heap), and infrastructure or BI-oriented tools (Segment, GA4, PostHog for self-hosted teams). Choosing the wrong cluster means you're answering the wrong questions.
| Team / Stage | Primary Question | Best Starting Tool | When to Add a Second Tool |
|---|---|---|---|
| Founder, early-stage (Stripe/Paddle) | What's my MRR, churn, and LTV? | Chartsy | When product behavior questions outnumber revenue questions |
| Product team (any stage) | Where do users drop off in onboarding? | Mixpanel or PostHog | When you need A/B testing or in-app guidance (add Amplitude or Pendo) |
| Finance / RevOps | What's our net revenue retention by cohort? | Chartsy or ChartMogul | When you need to join revenue data with CRM pipeline |
| Growth / Marketing | Which channels produce retained customers? | GA4 + Mixpanel or Kissmetrics | When channel-to-revenue attribution requires a warehouse layer |
| Engineering-led team | Can we self-host and own the data? | PostHog | When you need subscription revenue tracking alongside product analytics |
| Scale-stage company | How do all our data sources connect? | Segment as infrastructure | When BI reporting crosses CRM, product, and billing data |
A few usable rules when evaluating any tool on this list. First, check whether the free tier matches the metric you'll actually exceed first, event volume, MAUs, or MRR. Second, verify GDPR or CCPA requirements before you instrument anything in production, especially for EU users. Third, if your SaaS team is growing toward a structured analytics stack, SaaS founders aiming to reach higher MRR milestones often find it useful to look at SaaS mastermind onboarding checklists to understand which metrics and tooling decisions matter most at each growth stage.
Most early-stage SaaS companies need exactly two tools: one for subscription revenue (Chartsy for the AI-native approach, ChartMogul or Baremetrics for fixed dashboards) and one for product behavior (Mixpanel or PostHog). Everything else comes later, when specific gaps make the cost of an additional tool worth it.
FAQ
What's the difference between product analytics and subscription analytics?
Product analytics tools (Mixpanel, Amplitude, Heap) track what users do inside your app: clicks, feature usage, onboarding steps, and drop-off points. Subscription analytics tools (Chartsy, ChartMogul, Baremetrics) track what your revenue does: MRR, churn rate, expansion, LTV, and cohort retention. Most SaaS companies need both, but they answer fundamentally different questions and pull from different data sources.
Is Google Analytics 4 good enough for SaaS?
GA4 works for top-of-funnel acquisition tracking: where visitors come from, how marketing campaigns convert, and basic on-site behavior. It's not designed for product analytics inside a logged-in app or for subscription revenue metrics. Most SaaS teams use GA4 for marketing measurement and a dedicated product or revenue analytics tool for everything else. For EU teams, GA4 requires careful GDPR configuration before it's compliant.
Can I track SaaS revenue metrics without a data warehouse?
Yes. Chartsy, ChartMogul, and Baremetrics all connect directly to your billing platform (Stripe, Paddle, or Braintree) and calculate MRR, churn, LTV, and cohort metrics without a warehouse. You don't need SQL or a data engineering function to get accurate subscription metrics. A data warehouse becomes necessary when you want to join billing data with CRM pipeline, ad spend, or product behavior data across multiple systems.
What SaaS analytics tool is best for a solo founder?
Chartsy is the fastest starting point for a solo founder on Stripe or Paddle, connect your account, ask questions in plain English, and get answers without setup overhead. PostHog is the best free option if your priority is understanding what users do inside your product, since its free tier is generous and it handles event tracking, session replay, and feature flags in one place without requiring a team to maintain it.
Do I need to worry about GDPR when adding analytics to my SaaS product?
Yes, especially for EU users. Most client-side analytics tools collect IP addresses and use cookies, which require explicit consent under GDPR. You need a compliant consent management platform, a signed Data Processing Agreement with each vendor, and proper configuration (default-deny consent states, IP anonymization). Cookie-less tools like Plausible skip most of this, but trade data granularity for compliance simplicity. Privacy compliance is an ongoing process, not a one-time checkbox.
How much should an early-stage SaaS company spend on analytics tools?
Early-stage teams can get meaningful coverage for very little. Chartsy, PostHog, Mixpanel, and GA4 all have free tiers that are usable for teams under a few thousand users. Paid tiers for subscription analytics tools vary by provider and plan, so check each vendor's current pricing page for what fits your stage. The right time to pay is when you're making decisions that cost more to get wrong than the tool costs to run, usually around the time you're actively optimizing churn or conversion rate.
Conclusion
If you're running a subscription business on Stripe or Paddle and want clear answers about your MRR, churn, and revenue retention without writing SQL or hiring a data analyst, start with Chartsy. It's the fastest path from raw billing data to the answers that actually drive decisions. Connect your account, ask your first question in plain English, and see what your data has been trying to tell you.

Written by
Chartsy TeamThe Chartsy Team writes guides, product updates, and resources to help SaaS and eCommerce founders make sense of their metrics, without SQL or spreadsheets.
Chartsy
