
A SaaS team can get a burst of signups from a Reddit post, celebrate the graph, and then discover that almost nobody started paying. At the same time, a smaller partner mention may produce fewer trials but a much healthier stream of subscriptions. If your reporting stops at signup, both channels can look misleading.
To track paying customers by marketing channel, you need to connect three records: the original acquisition source, the signup identity, and the billing event. That connection lets you compare customer count, recurring revenue, subscription movement, and churn instead of treating every form fill as equal. The practical workflow is straightforward, but it depends on consistent tagging, durable identifiers, correctly matched Stripe or Paddle events, and reports that distinguish new customers from existing subscribers.
Table of Contents
- Why Signups and Paying Customers Tell Different Stories
- Choosing an Attribution Lens That Matches Subscription Reality
- Setting Up Tags and Source Capture Before Signup
- Connecting Stripe and Paddle Billing to Marketing Sources
- Building Dashboards and Reports Without Writing SQL
- Reading MRR Movement by Channel
- Common Pitfalls and How to Avoid Them
Why Signups and Paying Customers Tell Different Stories
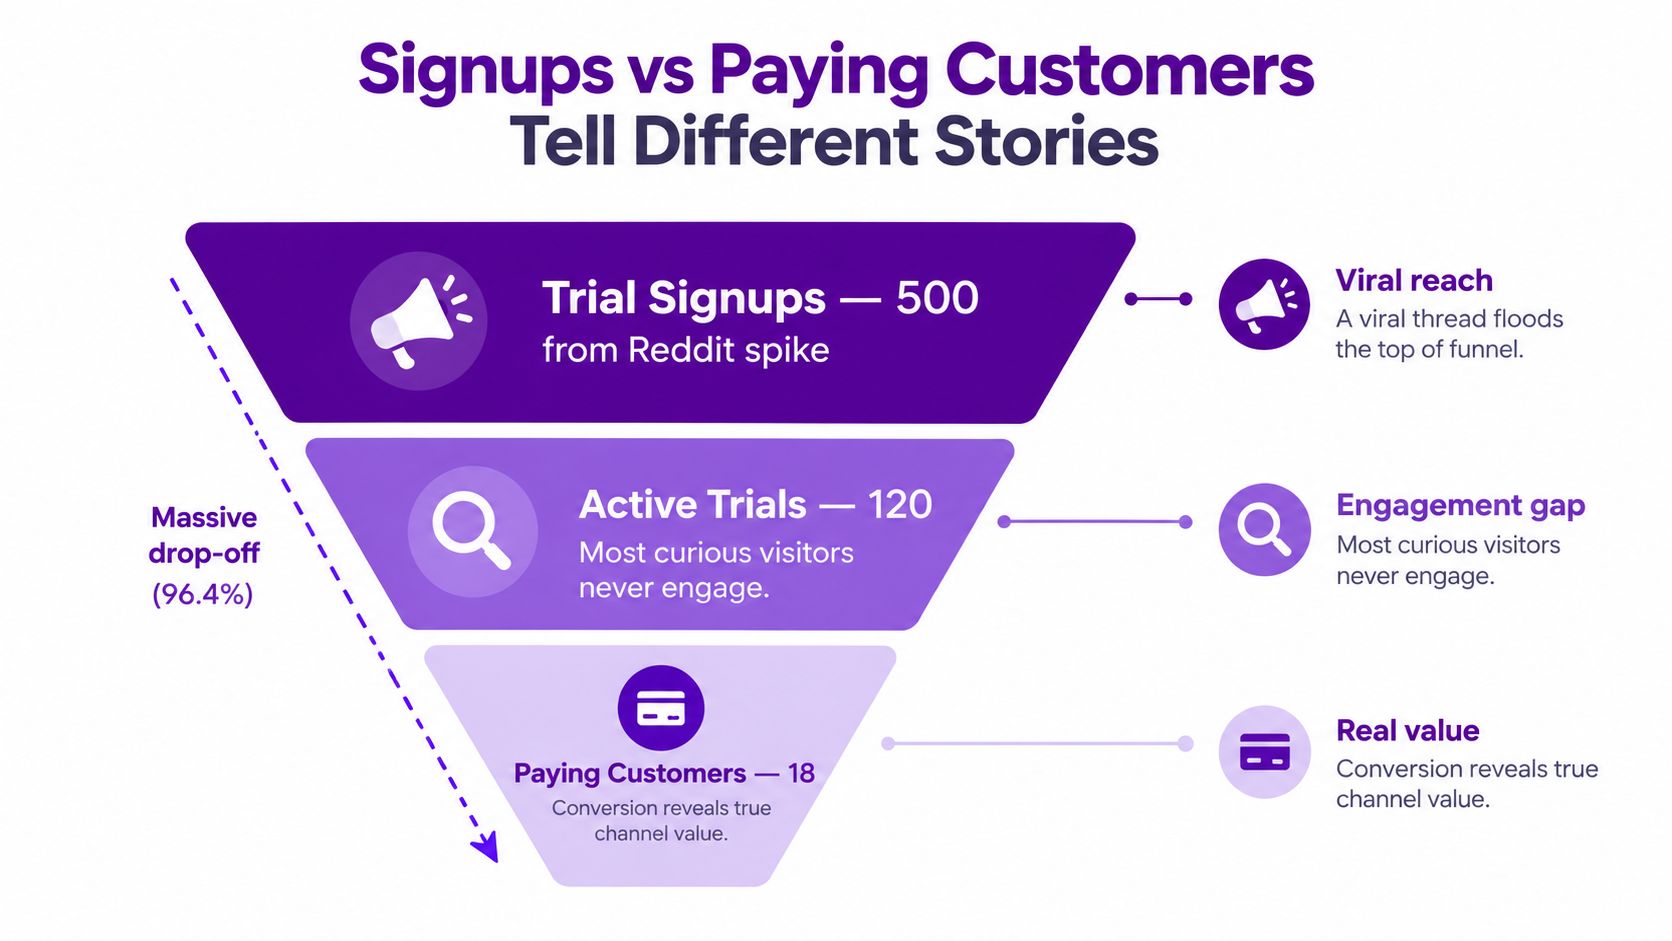
Signup tracking usually records an action near the top of the funnel. That might be a form fill, a free account, a trial start, or a waitlist join. These events show interest, but they don't prove that a person activated the product, entered a paid plan, or continued subscribing.
Paying customer tracking has a stricter definition. You need to match a person or account to a billing customer, identify the subscription event, and record whether the subscription is active, cancelled, delinquent, upgraded, or downgraded. Without that identity match, your marketing dashboard and billing system are telling separate stories.
Consider a hypothetical example. A Reddit discussion sends 1,000 signups to a SaaS product, but only 3 people become paying customers. A smaller community newsletter sends 200 signups, and 40 become paying customers. The newsletter generated fewer leads, yet it produced substantially more customers. A budget decision based only on signup volume would reward the wrong source.
Define the revenue event first
Before adding dashboards, write down what counts as a paying customer. For a self-serve SaaS product, that might be a successful paid subscription event. For a product with invoices or delayed payment, you may need a confirmed payment or an active subscription with a non-delinquent status.
Keep these events separate:
- Signup: A person creates an account or starts a trial.
- First payment: The account completes its first paid transaction.
- Active subscription: The customer remains subscribed at the reporting date.
- Revenue movement: The account upgrades, downgrades, renews, or churns.
This separation prevents trials from inflating acquisition reports and stops renewals from being counted as new customers.
The reason attribution windows matter is especially clear in subscription businesses. A 2026 SaaS attribution benchmark covering more than 4,200 workspaces found that the median workspace attributes 71% of revenue, leaving a 29% gap associated with hard-to-measure sources such as dark social. The same benchmark found that only 62% of B2B monthly-subscription conversions happen within 30 days of the first click, so a 30-day window misses 38% of revenue. Use those figures as a warning against treating a short reporting window as a complete view of channel performance.
The rest of the setup follows from this distinction: choose an attribution lens, preserve source data before signup, connect billing events, build reports around customer and MRR questions, and inspect recurring revenue quality by channel.
Choosing an Attribution Lens That Matches Subscription Reality
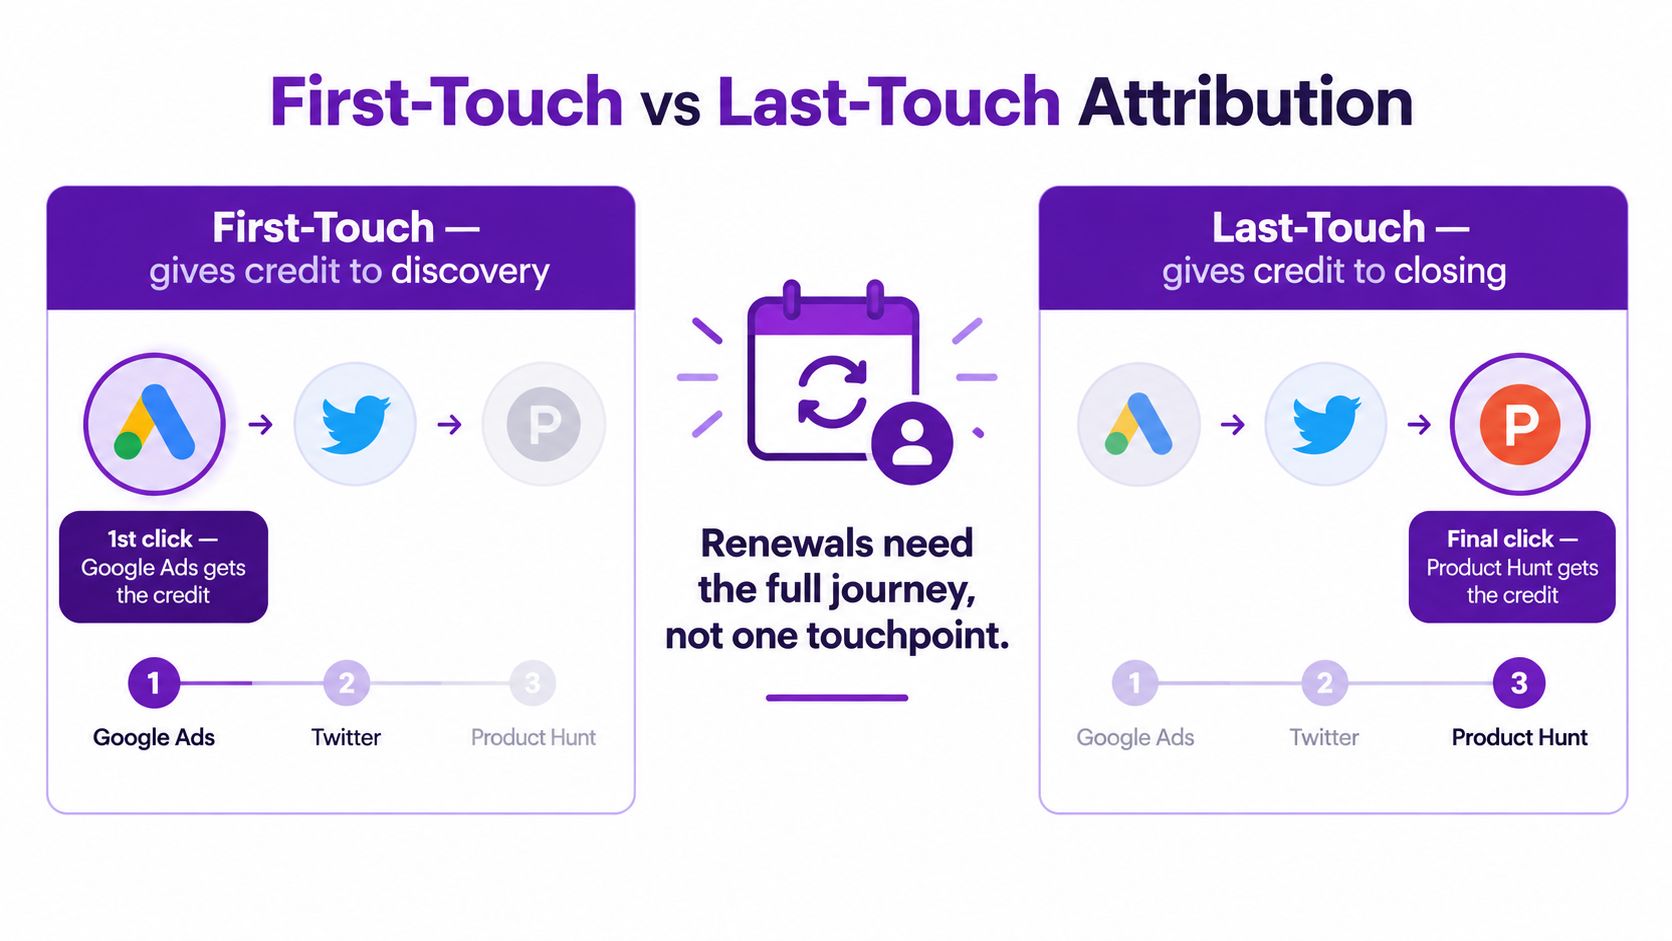
First-touch attribution gives credit to the channel that introduced the visitor. Last-touch attribution gives credit to the source closest to signup or purchase. Both are useful shortcuts, but neither describes the whole customer journey.
Take a hypothetical journey. A user clicks a Google ad, returns later through a Twitter link, and finally signs up after seeing a Product Hunt mention. A first-touch report assigns the conversion to Google Ads. A last-touch report assigns it to Product Hunt. Twitter disappears from both reports, even though it may have helped the user remember or evaluate the product.
First-touch is useful for discovery questions: which sources introduce new audiences, and which campaigns create initial demand? Last-touch helps with closing questions: which source was present when the visitor decided to sign up? The problem starts when a team treats either answer as the complete economic value of a channel.
Use simple models deliberately
Subscription attribution needs a second layer beyond the first payment. A channel can introduce customers who renew, expand, and remain active, or it can produce a large number of initial conversions that later cancel. The first payment tells you that acquisition worked once. It doesn't tell you whether the source produces durable revenue.
For practical reporting, keep first-touch and last-touch as separate dimensions rather than forcing one model to answer every question. A useful channel view can include:
- First-touch customers: Accounts originally introduced by each source.
- Last-touch customers: Accounts that converted after interacting with each source.
- First-payment revenue: Revenue associated with the initial paid event.
- Recurring revenue quality: Current MRR, later subscription movement, and churn by original source.
A 30 to 90-day lookback can keep the pre-conversion window relevant for many subscription businesses, but it shouldn't replace judgment about your sales cycle. The attribution model guidance also stresses the importance of tying website or signup identifiers to billing events and reporting both customer count and recurring revenue by source.
Practical rule: Use first-touch and last-touch to triage channel performance, then use source-linked billing events to judge whether those customers remain valuable.
Attribution still isn't proof of causation. If Product Hunt is the final recorded source, you can say the signup was attributed to Product Hunt under your chosen rule. You can't automatically say the mention caused the purchase, especially when the customer had already encountered the brand through other channels. Document the model, window, and event definition beside every dashboard.
For a plain-English explanation of the terminology and reporting logic, use the attribution concepts guide.
Setting Up Tags and Source Capture Before Signup
Good revenue attribution starts before the user creates an account. If the source disappears between the landing page and checkout, no dashboard can reconstruct it reliably later.
Start with a compact UTM standard. Use utm_source for the platform, utm_medium for the channel type, utm_campaign for the promotion, and utm_content for the specific creative or placement. Tag paid ads, social posts, emails, partner links, community posts, and other outbound campaigns consistently. Don't let every team member invent its own spelling for the same source.
Preserve the first useful source
On the first landing event, capture the UTM set, original landing page, referrer, timestamp, and a generated visitor_id. Store that payload in a first-party cookie or local storage value that survives page changes and later sessions. A server-side copy is safer for important acquisition data because browsers, privacy settings, and device changes can remove client-side values.
When the visitor submits a signup form, attach the stored payload to the account or user record. At minimum, retain:
- Source: The normalized platform name.
- Medium: The channel classification.
- Campaign: The promotion or initiative.
- Content: The ad, email, or creative variation.
- Landing page: The first page associated with the visit.
- Referrer and click ID: Available values that help with reconciliation.
- Captured timestamp: The time the source was recorded.
Capture the latest source separately if you want a last-touch report. Don't overwrite the original source with every subsequent visit, or you'll lose the discovery signal.
Make the taxonomy boring
Use lowercase values and a short channel taxonomy from the beginning. For example, google, reddit, email, and partner are easier to group than a mixture of Google Ads, google_ads, paid-search, and gads. Decide how you'll classify branded search, direct traffic, referrals, and unattributed visits before campaigns launch.
The UTM tracking guide for SaaS founders is useful when formalizing naming conventions. Before launch, check that every campaign link contains the required fields, every landing page preserves them, the signup request sends them to your backend, and the resulting user record stores both the source and visitor_id.
Source capture is an input contract. If marketing, product, and billing systems don't agree on field names, revenue reports will contain avoidable ambiguity.
Don't rely only on email address. A visitor may click on one device, sign up on another, or use a different email at checkout. The identifier should be your primary join key, with email used as a carefully controlled fallback.
Connecting Stripe and Paddle Billing to Marketing Sources
The useful join is simple in principle: source record to signup record to billing customer to subscription event. The implementation needs discipline because each system uses different object names and webhook payloads.
At signup, save the UTM payload and visitor_id in your application database. When you create the billing customer, copy the same values into Stripe metadata or Paddle custom data. Suggested fields are utm_source, utm_medium, utm_campaign, utm_content, landing_page, and visitor_id.
When Stripe sends a successful checkout or subscription event, read those values and resolve them against the signup row. Store a normalized payment or subscription event with the customer ID, subscription ID, event type, event timestamp, source fields, and recurring revenue value. A later renewal or upgrade should reference the same customer and visitor identity, not create a new acquisition record.
Paddle follows the same conceptual pattern, although the field names and event payloads differ. Map the source payload through passthrough or custom_data, depending on the Paddle product and integration path, then normalize the resulting event before reporting. Keep separate handling for Paddle Billing and Paddle Classic, because their data models and event implementations aren't interchangeable.
Use a fallback without hiding data loss
Join on visitor_id first. If that value is absent, use a controlled email match, and label the record as a fallback match so you can measure how often the stronger identifier is missing. Do not classify unmatched payments as direct traffic without explicit labeling. An unattributed customer is more honest than a false channel assignment.
| Field Purpose | Stripe (metadata key) | Paddle (custom_data key) |
|---|---|---|
| Original source | utm_source |
utm_source |
| Channel type | utm_medium |
utm_medium |
| Campaign name | utm_campaign |
utm_campaign |
| Creative or placement | utm_content |
utm_content |
| Persistent visitor identity | visitor_id |
visitor_id |
| Initial landing page | landing_page |
landing_page |
Once the events are normalized, a simple join can surface first-payment customers and MRR by utm_source. Keep customer count and recurring revenue in separate measures. A source may have many low-value accounts, while another has fewer customers with stronger recurring revenue.
Use read-only billing connections where possible. The Stripe metadata guide provides a practical reference for deciding which fields belong on billing objects and why they need to persist beyond the initial checkout.
Paddle's API also exposes timeseries metrics such as MRR, active subscribers, and revenue, with filtering and breakdowns available in Explore, as described in its feature comparison documentation. That can support recurring-revenue reporting without requiring every small SaaS team to build a separate warehouse first.
Building Dashboards and Reports Without Writing SQL
A useful weekly dashboard answers a small set of operating questions. It shouldn't become a decorative collection of every metric your billing provider exposes.
Start with four views:
- Which channel produced the most paying customers recently? Combine signup source data with successful first-payment events. Use a bar chart grouped by
utm_source. A plain-English query could be: “Show paid customers by source for the last 30 days.”

-
What is current MRR by source? Combine the original acquisition source with active subscription state and current recurring value. A grouped bar or table works well. Ask: “Show current MRR by first-touch source cohort.”
-
What is the trial-to-paid rate per channel? Divide distinct first-payment customers by eligible trial starts, using the same cohort and time definition for every source. A conversion table makes low-volume channels easier to inspect than a crowded chart.
-
How does CAC compare with later contribution? Combine campaign spend, first-payment customer count, and recurring revenue by source. A scatter plot can show acquisition cost against contribution, but only if cost data uses the same campaign naming convention as the signup records.
Keep event types separate
Filters matter more than visual polish. A “new customers” chart should include first paid conversions, not renewals, upgrades, or active subscriber snapshots. An MRR chart should use current subscription state or a defined movement event, not a raw count of every billing webhook.
A no-code analytics layer or a plain-English query tool can make these questions accessible to a founder who doesn't write SQL. One option, Chartsy, connects website and signup activity with Stripe and Paddle billing data, supports analysis across Stripe, Paddle Billing, and Paddle Classic, and lets users create charts and save them to dashboards through plain-English questions.
Review one chart per question every week. Look for changes that deserve investigation, then drill into the underlying customers and event timestamps. A dashboard should help you decide what to inspect next, not pretend to explain a cancellation that the available billing data can't explain.
A dashboard reports an observed relationship. It doesn't prove that a campaign caused the subscription.
For teams without a dedicated analyst, this distinction keeps reports useful without turning them into overconfident explanations. If a source's MRR falls after spend is reduced, record the movement and investigate the customer cohort, plan mix, and billing events before assigning a cause.
Reading MRR Movement by Channel
First-payment revenue is only the beginning of subscription analysis. To understand channel quality, attribute later MRR movement back to the source that originally acquired the customer.
Stripe's operational definitions make the categories clear. New MRR comes from a new active subscription or a free-to-paid upgrade. Expansion MRR comes from an existing paid subscription increasing in value. Contraction MRR comes from a downgrade or another reduction in value. Churned MRR occurs when a paid subscription is cancelled, downgraded to free, or becomes delinquent, as described in Stripe's MRR event definitions-totals?locale=en-GB).
Build the channel equation
For each source, calculate:
Net New MRR = New MRR + Expansion MRR - Contraction MRR - Churned MRR
The formula is more informative than a ranking by new subscriptions. A source that brings many new accounts can still produce weak net movement if those accounts cancel quickly, downgrade often, or rarely expand. Another source may acquire fewer customers while producing more stable recurring value.
Use the original visitor_id or source-linked customer record for every later event. When a customer upgrades, attach expansion to the source captured at signup. When that customer cancels, attach churn to the same source. This doesn't claim that the original channel caused the upgrade or cancellation. It creates a consistent cohort lens for comparing what happened to customers acquired through different sources.
A practical channel table might include:
| Channel | New MRR | Expansion MRR | Contraction MRR | Churned MRR | Net New MRR |
|---|---|---|---|---|---|
| Organic search | Billing events | Billing events | Billing events | Billing events | Formula result |
| Paid search | Billing events | Billing events | Billing events | Billing events | Formula result |
| Partner | Billing events | Billing events | Billing events | Billing events | Formula result |
Use actual values in your implementation. The table structure matters more than a blended company total because it shows where growth and loss are concentrated.
Zoho Billing's SaaS metric definitions use the same broad split between new, expansion, contraction, and churn components. Keep these movements visible by source, plan, and cohort where your data supports those dimensions.
Ask better channel questions
A founder should be able to answer: Which source brings customers who stay active? Which source has the strongest expansion pattern? Where is churned MRR concentrated? Are discounts making first-payment conversion look healthier than the later revenue record?
Those questions turn acquisition reporting into an operating tool. They also prevent a common mistake, judging a channel by the size of its first payment when the business depends on recurring subscriptions.
Common Pitfalls and How to Avoid Them
Channel dashboards usually fail in quiet ways. The totals may still look plausible, but one source gets too much credit, another reports zero paying users, and the unattributed bucket grows until nobody trusts the report.
UTM collisions
An email link can inherit or overwrite values from another campaign, or an outbound link can use a customer's domain as utm_source. The dashboard then shows strange sources, duplicated channels, or a channel that appears to have attracted customers from nowhere.
Run a source-value check for unexpected domains, capitalization variants, and blank campaign names. Fix the issue by enforcing a shared naming convention and applying a default utm_source to outbound links that would otherwise be classified incorrectly.
Missing identity across devices
A visitor clicks an ad on a laptop and completes checkout on a phone. If the persistent identifier exists only in the original browser, the payment arrives without source metadata. The dashboard reports a paying customer under direct or unattributed traffic.
Compare the percentage of paid subscriptions with a valid visitor_id, then inspect unmatched records by email and creation time. A server-side first-touch record, an authenticated account-level identifier, and a carefully controlled email fallback can reduce the gap without pretending every match is certain.
Empty billing metadata
A source cookie can expire before checkout, or an application can create the billing customer before copying attribution fields. Stripe or Paddle then receives a subscription with blank metadata, and every downstream report inherits the missing source.
Make required attribution fields part of the checkout handoff. Log and alert on subscriptions that arrive empty, rather than assigning them to direct traffic without notice. Test the full path from landing page through signup, checkout, webhook, and dashboard.
Trials counted as customers
If the customer query counts account creation instead of a first successful paid event, trial-heavy sources will look artificially strong. Compare distinct trial starts with distinct first-payment customers, and filter renewals out of the acquisition report.
Expansion counted as new value
An upgrade from an existing customer shouldn't be reported as a new acquisition win. Check that the subscription already existed before classifying the event as expansion, then preserve the original acquisition source while recording the movement separately.
Before launch, test five paths: tagged landing, return visit, signup, first payment, and later subscription movement.
Use a small set of test accounts to verify source persistence, webhook mapping, event classification, and duplicate handling. Then compare billing totals with the reporting layer before making budget decisions. A report that admits what it can't match is more useful than one that assigns every customer to a channel with false precision.
Chartsy connects website and signup sources with Stripe, Paddle Billing, and Paddle Classic subscription data, so small SaaS teams can compare paying customers, MRR movement, and churn by acquisition source without building SQL reports. Visit Chartsy to explore a workflow for turning source-tagged signups and billing events into practical dashboards.

Written by
Chartsy TeamAnalytics team at Chartsy
The Chartsy Team writes guides, product updates, and resources to help SaaS and eCommerce founders make sense of their metrics, without SQL or spreadsheets.
Chartsy
