Every Stripe account is sitting on a goldmine of untapped data. Not the revenue numbers - you already track those. The real gold is in the metadata: those custom fields and tags you've been adding to customers, subscriptions, and invoices for years. Acquisition source. Company size. Sales rep. Plan type. Coupon code.
Most teams use metadata as a filing system. Chartsy turns it into an analytics engine.
What Is Stripe Metadata?
Stripe metadata is a flexible key-value store you can attach to almost any Stripe object - customers, subscriptions, payment intents, invoices, and more. It's Stripe's way of letting you bring your own business context into their data model: acquisition source, company size, sales rep, plan type, coupon code, or anything else that matters to your business. If you're not familiar with how it works, Stripe's documentation covers the full details.
The Problem: Metadata Sits Idle
Here's the gap most Stripe users run into: you've been carefully tagging your customers and subscriptions for months, maybe years. But when it comes to actual analysis, that data is essentially invisible.
Your standard analytics shows you total MRR, total churn, total new subscriptions. It doesn't tell you:
- Which acquisition channel has the highest LTV?
- Do enterprise customers churn less than SMB?
- Which sales rep's deals retain the longest?
- What's the MRR breakdown by industry vertical?
- Are customers who came in via a discount code more likely to cancel?
To answer these questions today, most teams export a CSV from Stripe, wrestle it into a spreadsheet, and spend an afternoon manually building a pivot table - only to repeat the process next month.
That's the problem Chartsy's Metadata Analytics solves.
How Chartsy Turns Metadata Into Analytics
Chartsy automatically reads and indexes every metadata field across your Stripe data during sync - customers, subscriptions, and invoices. There's no configuration, no schema to define, no fields to register. If the field exists in Stripe, it becomes available in Chartsy immediately.
You don't need to export anything from Stripe. No CSV downloads, no spreadsheets, no pivot tables. Everything is already here.
As soon as you connect your account, Chartsy surfaces all the metadata fields it found across your customers and subscriptions - right on screen. You can see at a glance what you're working with before you even ask a question:
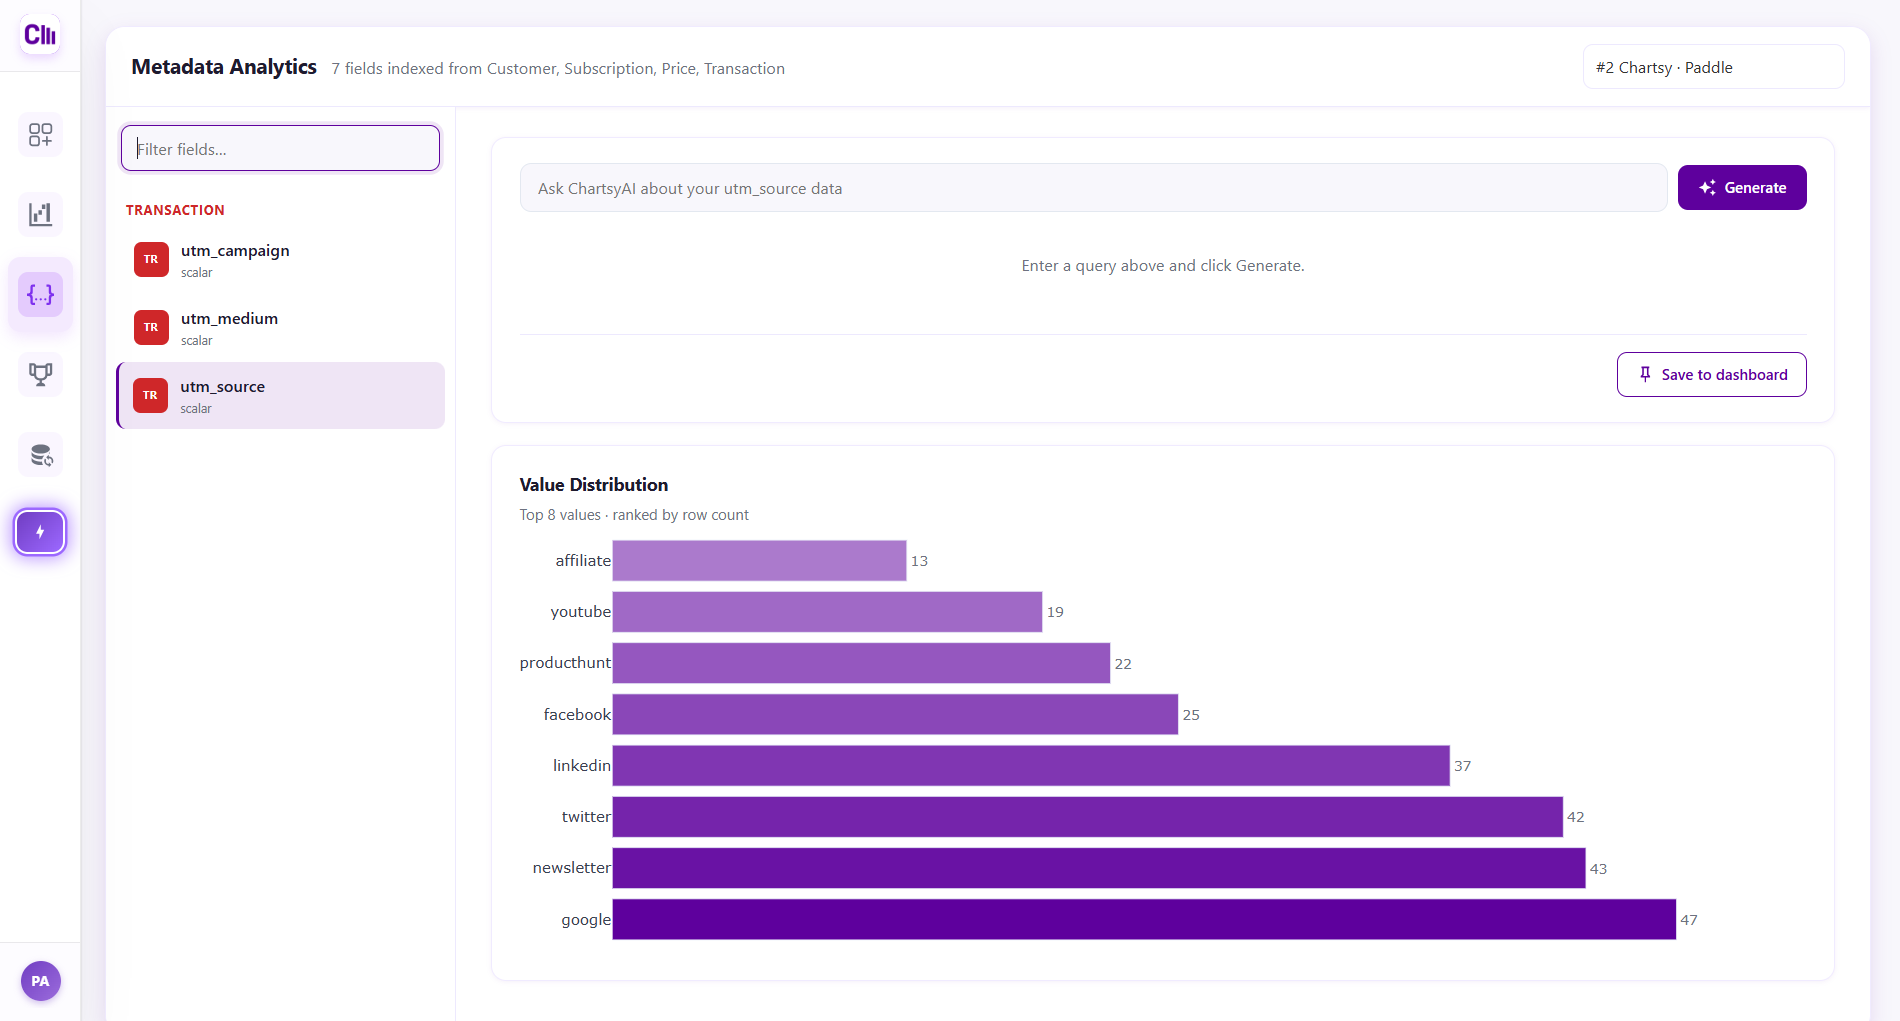
Select any field and you can see the value distribution and start asking questions:
The Metadata Fields Teams Actually Use
The most common fields we see across Stripe accounts include marketing attribution data like utm_source, utm_medium, utm_campaign, and utm_content - carried from checkout sessions into customer records. Beyond UTM parameters, teams typically tag customers with fields like acquisition_source, company_size, industry, sales_rep, plan_type, coupon_code, contract_length, and region.
If you've been passing UTM parameters through to Stripe on signup, those are already indexed and ready to slice revenue and churn by channel - no extra setup needed.
The Query Pattern
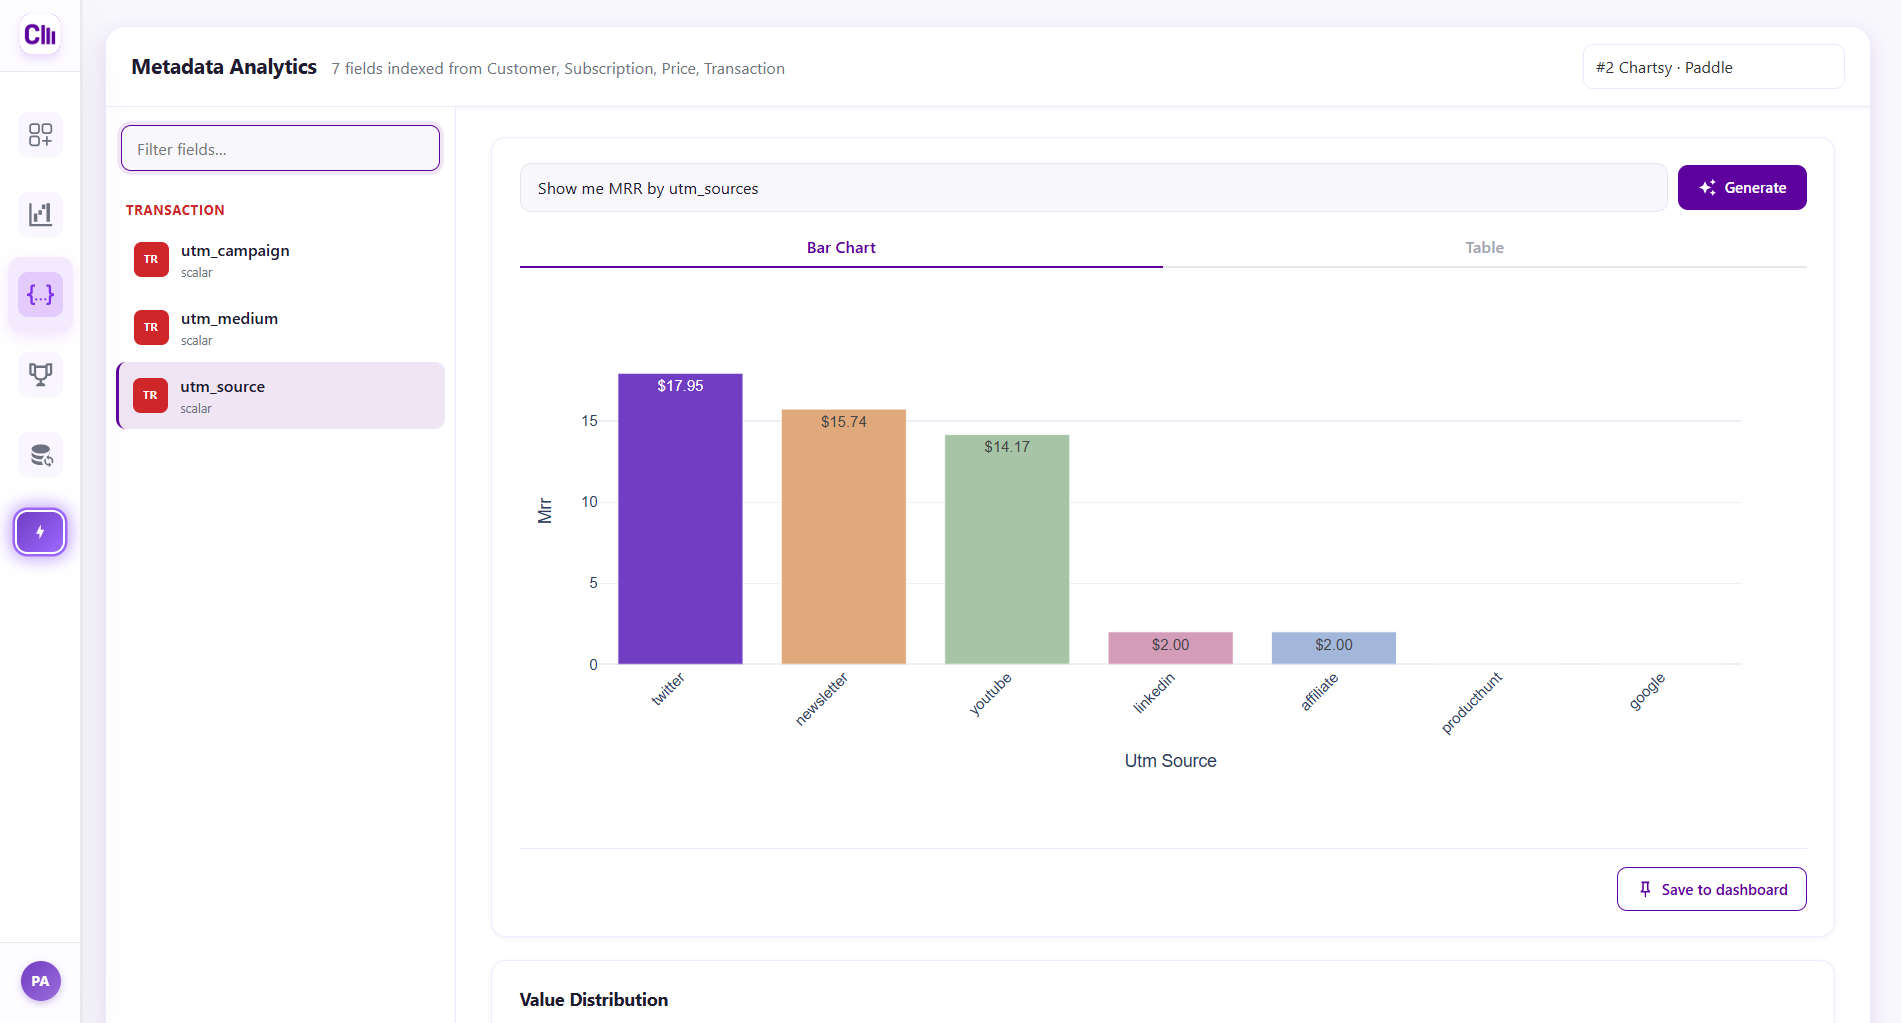
Once indexed, every metadata key becomes a first-class dimension in ChartsyAI. You can ask anything related to these fields - distribution, counts, revenue metrics, churn, trends, comparisons - all in plain English:
- "Show MRR by utm_source for the last 12 months"
- "Show churn rate by company_size this year"
- "Show LTV by industry, sorted highest to lowest"
- "Show new subscriptions by sales_rep by month for Q1"
- "Show revenue by plan_type for customers who used a discount code"
You can also combine multiple metadata filters for precise segmentation:
- "Show MRR for enterprise customers acquired through paid search"
- "What is the churn rate for annual plan subscribers in the fintech industry?"
What Chartsy Indexes
Chartsy indexes metadata across all three levels of your Stripe data:
| Object | Example Fields |
|---|---|
| Customer | utm_source, utm_medium, acquisition_source, company_size, industry, sales_rep |
| Subscription | plan_type, trial_source, coupon_code, contract_length |
| Invoice / Charge | invoice_type, billing_period, discount_applied |
New fields added to Stripe automatically appear in Chartsy after the next sync - no manual step required.
Save and Monitor
Metadata-based charts aren't one-offs. Any chart you build using metadata filters or groupings can be saved to your dashboard, and it updates automatically with each sync. You can build a permanent view of MRR by acquisition channel and watch it evolve in real time as new customers come in.
The Questions That Finally Have Answers
The real value of Metadata Analytics is that it lets you analyze your business the way you actually think about it - not the way Stripe's default reports are structured.
Any custom field you sync onto your customers, subscriptions, products, or transactions can be sliced against revenue, churn, counts, or time. These are the kinds of questions that used to require a data team:
- Which acquisition source produces the highest-MRR customers?
- What is the churn rate by customer segment?
- Which plan type drives the most MRR?
- What is the revenue distribution across pricing tiers?
- What is the churn rate by region for enterprise customers?
These aren't new questions - every SaaS team asks them. What's new is being able to answer them in seconds, from data you already have, without touching a spreadsheet.
Getting Started
If you're already using Stripe metadata, you're ready. Connect your Stripe account to Chartsy, and metadata indexing happens automatically during the first sync. From there, any ChartsyAI query can reference your metadata fields by name.
If you haven't been using metadata yet, there's no better time to start. Even a single field - acquisition_source, for example - unlocks a dimension of analysis that most SaaS teams never have access to. Add it to your Checkout Session creation, populate it consistently, and within a few weeks you'll have a dataset worth analyzing.
The tags you've been adding all along were always meant to mean something. Now they do.
Chartsy also works with Paddle, supporting metadata analytics across multiple payment providers. See the Metadata Analytics launch announcement for what shipped and when.
Related: Stripe Metadata & Paddle Custom Data: Beyond Revenue Analytics - metadata isn't only for acquisition source and plan type; see how to explore fields that have nothing to do with billing.

Written by
Chartsy TeamThe Chartsy Team writes guides, product updates, and resources to help SaaS and eCommerce founders make sense of their metrics, without SQL or spreadsheets.
Chartsy