NRR can tell you if your current customers are quietly growing your SaaS or pulling revenue away. So, what is a good NRR for SaaS? In most cases, above 100% is healthy, while 110% or more is strong. But the right target depends on your customer size, pricing model, and growth stage.
The number only helps when you calculate it from the same customer group and read it beside GRR. Here’s how the metric works, where useful benchmarks sit, and how to act on the result.
Table of Contents
- What Is a Good NRR for SaaS?
- NRR Benchmarks by SaaS Growth Stage
- How NRR Is Calculated, in Brief
- How to Interpret a High or Low NRR
- Ways SaaS Founders Can Improve NRR
- FAQ: Questions About Good NRR
What Is a Good NRR for SaaS?
A good SaaS NRR is usually above 100%. That means your existing customer base produces more recurring revenue at the end of the period than it did at the start, even after churn and downgrades.
Net revenue retention measures revenue change within an existing customer group. It includes expansion from upgrades or higher usage, then subtracts revenue lost through cancellations and downgrades. New customers are left out.
Here’s the simple reading guide:
- Below 90%: Revenue loss is outpacing expansion. You likely have a churn, pricing, or product-fit issue.
- 90% to 100%: The base is shrinking, though the level may be normal for some low-priced or early-stage SaaS products.
- 100% to 110%: Existing revenue is stable or growing at a healthy pace.
- Above 110%: Expansion is doing meaningful work. This is a strong result for many SaaS companies.
- Strong expansion: Expansion is doing meaningful work, but check GRR before celebrating.
These are guideposts, not laws. An SMB product may sit near its segment norm, while an enterprise product may need a much higher result to stay competitive. A company with high NRR can also hide serious churn if a few large customers expand enough to offset many smaller losses.
That is why you should track NRR with GRR. NRR includes expansion. GRR shows only the revenue that survived churn and contraction, so it cannot rise above 100%. The difference between the two tells you how much growth comes from existing customers who spend more.
The term NDR, or net dollar retention, often means the same thing. SaaS teams tend to use NRR in operating discussions, while investors may use NDR in reporting. Both terms point to the change in recurring revenue from the starting customer base.
For a plain-language overview of the terms, Wikipedia’s definition of software as a service describes the subscription model that makes recurring revenue metrics useful.
If you need to compare the inputs in more detail, the net revenue retention formula guide breaks NRR apart from GRR and shows how each revenue movement changes the result.
NRR Benchmarks by SaaS Growth Stage
NRR benchmarks make sense only when you compare similar SaaS companies. Customer type often matters more than company age. A self-serve SMB product has a different expansion ceiling than software sold through large annual contracts.
That gap changes the answer to “what is a good NRR?” A small-team SaaS at 100% may be doing very well. An enterprise SaaS at the same level may have weak expansion or too much contraction.
| Business profile | Useful NRR reference | What to inspect next | Target setting note |
|---|---|---|---|
| SMB and self-serve | Segment reference in the cited data | Early churn, activation, and plan fit | 100% or more is strong |
| Mid-market | Segment reference in the cited data | Account growth and adoption depth | Set a target above 100% if expansion is repeatable |
| Enterprise | Segment reference in the cited data | Renewal risk and multi-team usage | Higher targets may fit larger contracts |
| Usage-based or hybrid pricing | Often higher than flat-rate models in cited benchmark data | Usage growth and customer value | Do not compare directly with flat-rate plans |
Growth stage still gives useful context. Early companies may show a lower NRR while they learn which customers get lasting value. Later-stage companies usually need tighter retention because a larger revenue base makes churn more expensive.
Pricing also shapes the number. Usage-based and hybrid models can gain expansion as customers use more of the product. A flat-rate product needs a clear upgrade path or another reason for account spend to rise.
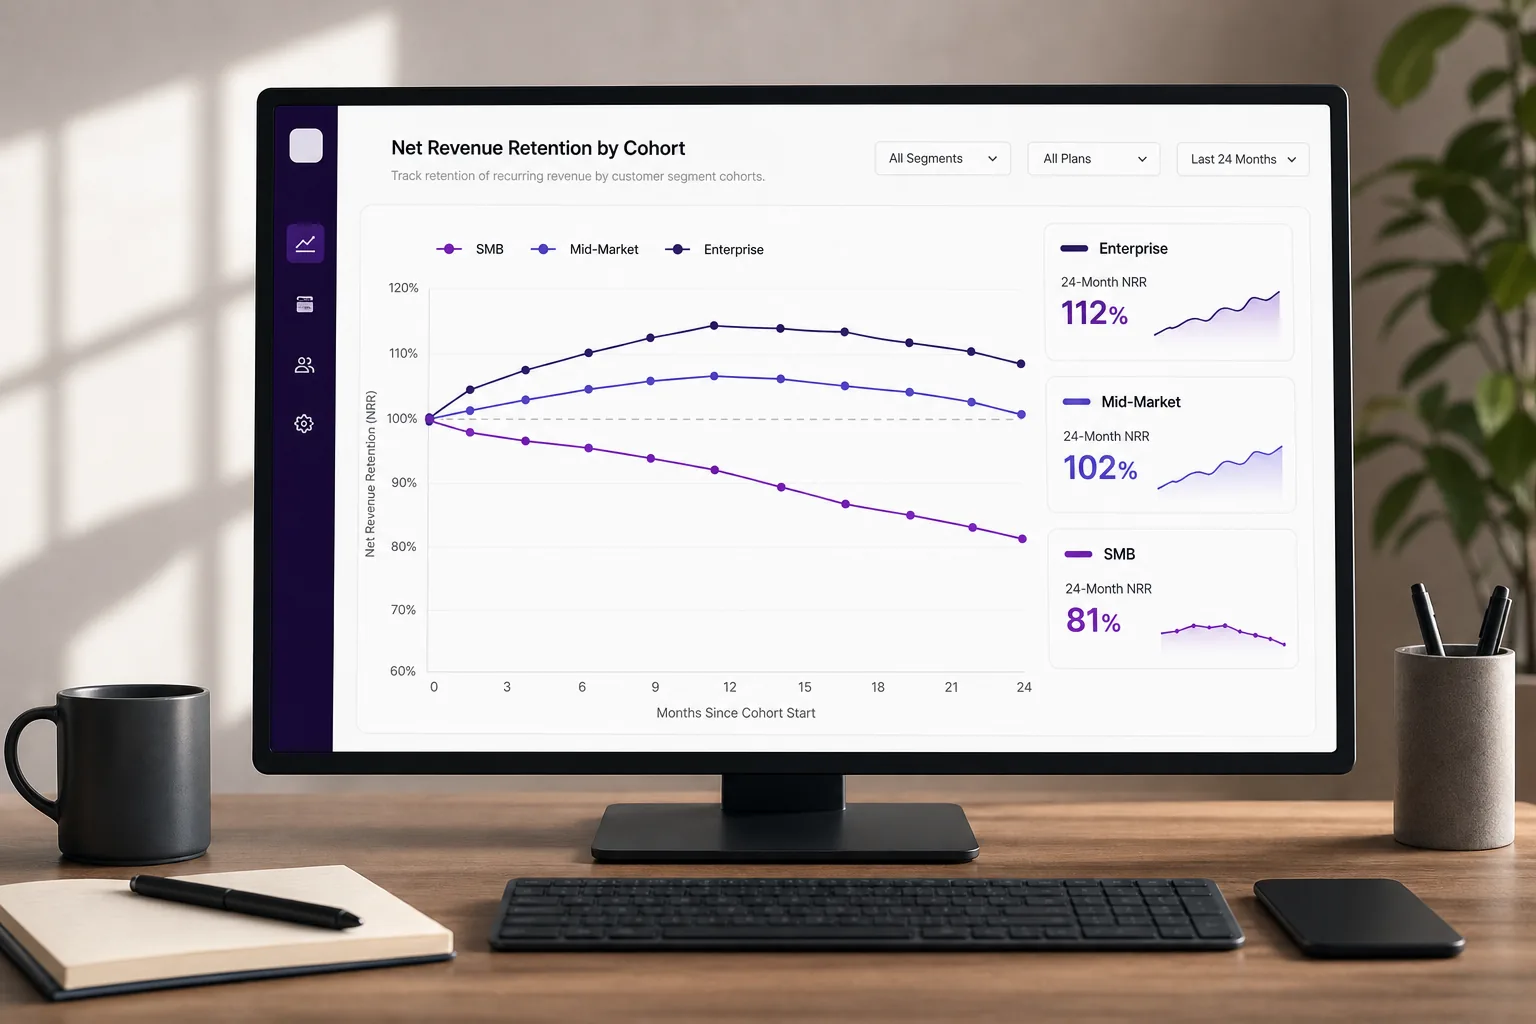
Use benchmarks as a starting point, then compare your current result with your own past quarters. A falling NRR is often more useful than a single low reading because it shows that the customer base is losing strength.
For example, a declining NRR over several quarters needs attention. A steady NRR with strong new-customer growth may support a different plan. The decision depends on your sales motion, margins, and ability to replace lost revenue.
How NRR Is Calculated, in Brief
NRR takes starting MRR from existing customers, adds their expansion, then subtracts contraction and churned revenue — divided back over the starting MRR. New-customer revenue never enters the calculation, which is what separates NRR from total MRR growth.
That's the short version on purpose. If you need the full worked example, the common data mistakes, and a repeatable monthly process, the net revenue retention formula guide and how to calculate net revenue retention cover the calculation step by step. This post's job is what the resulting number means once you have it — which is what the rest of this guide focuses on.
How to Interpret a High or Low NRR
A high NRR means the existing customer base is expanding faster than it is shrinking. A low NRR means churn and contraction are taking more revenue than expansion brings back.
But the headline number is only the first layer. Split NRR into its parts before deciding what to change:
- Churn: Customers left completely.
- Contraction: Customers stayed but paid less.
- Expansion: Customers upgraded, added seats, or increased usage.
Imagine two companies with the same NRR. Company A has higher GRR and strong upgrades. Company B has 90% GRR and a few large accounts that expanded sharply. Company A has the safer base, even though the top-line NRR matches.
A high NRR can also be misleading when one customer drives most of the expansion. Review NRR by plan, customer size, source, and cohort. If one segment carries the whole result, your company may have a concentration risk.
Cohort views help with timing. Compare customers who joined in the same month or quarter. A newer cohort with weak NRR may point to an onboarding or product-fit issue that the full-company number has not shown yet.

NRR is also a lagging metric. By the time an annual cohort reports its result, some revenue loss has already happened. Use product usage, support requests, failed payments, and renewal dates as earlier warning signs.
A falling result does not always mean the product got worse. A shift toward smaller customers can lower NRR even when each segment performs as expected. Check customer mix before blaming the product or the success team.
Ways SaaS Founders Can Improve NRR
Improving NRR means reducing revenue loss while giving current customers a clear reason to spend more. Start with the largest movement in your revenue bridge instead of launching several projects at once.
Reduce early churn
Look at the first 30, 60, and 90 days. Find the point where new customers stop using the product or fail to reach a key outcome. Then fix that step in onboarding.
For one SaaS product, the key milestone might be a first report. For another, it might be an integration or a team invite. Your goal is to help customers reach the action that proves value before renewal risk appears.
Find contraction before cancellation
A downgrade often comes before a full cancellation. Track plan changes and usage drops by account. Ask why customers cut spend, then group the answers by product gap, budget pressure, poor fit, or low adoption.
Failed payments need their own view. A customer who stops paying because a card fails is different from a customer who leaves after a poor product experience. The recovery plan should match the cause.
Build expansion around value
Expansion works best when it follows customer progress. Look for usage that reaches a plan limit, new team members, or repeated demand for a higher-tier feature. A timely upgrade path is easier to accept than a generic sales message.
Review pricing against customer value
Flat pricing can limit expansion when customers get much more value over time. Tiered, usage-based, or hybrid pricing may fit better when usage grows with customer success. Test this carefully. A price change that makes the bill hard to predict can increase contraction.
Connect retention to acquisition
Traffic volume does not tell you which sources produce durable customers. Compare source, signup, paid conversion, MRR, and later retention. A smaller channel may win if its customers expand more often.
This is where Chartsy can help small teams that work across Stripe, Paddle, or other billing data like Polar.sh, Freemius, Creem.io, and Lemon Squeezy. It joins subscription metrics with first-touch acquisition data, so you can see which source brought customers with the strongest NRR instead of judging a campaign by visits alone.
Keep the review simple. Once a month, choose one loss driver and one expansion driver. Assign an owner, set a check date, and see if the related movement changes.
FAQ: Questions About Good NRR
Is 100% NRR good for SaaS?
Yes, 100% NRR means your existing revenue base stayed flat after churn, downgrades, and expansion. It can be a good result for an early-stage or SMB-focused SaaS product. For an enterprise product with strong expansion potential, investors may expect a higher number. Always read it with GRR and customer segment data.
Is 110% NRR good for SaaS?
Yes, 110% NRR is strong for many SaaS businesses because existing customers added more revenue than the company lost. The result still needs context. Check if expansion comes from many accounts or only one large customer. Also review GRR to make sure high upgrades are not hiding broad churn.
What is a bad NRR for SaaS?
An NRR below 90% usually signals a serious retention problem, though the right threshold depends on the customer base. A low-priced self-serve product may face more churn than enterprise software. Look for the source of the loss first. Churn, downgrades, and weak expansion need different fixes.
Should NRR be monthly or annual?
Use monthly NRR for fast operating signals and annual NRR for a fuller view of customer durability. Monthly results can swing because of billing timing or one large account. Annual NRR takes longer to change, but it captures more renewals and expansion events. Many teams track both views.
What is the difference between NRR and GRR?
NRR includes expansion revenue, while GRR counts only the starting revenue that remains after churn and downgrades. NRR can exceed 100%, but GRR cannot. Use NRR to assess growth within existing accounts. Use GRR to see whether your base is leaking revenue before expansion covers the loss.
A good NRR for SaaS is usually above 100%, but your best target comes from your customer segment and revenue model. Calculate it from a fixed starting cohort, review GRR beside it, then inspect the biggest source of movement. If you want a repeatable view, Chartsy can turn billing data from Stripe, Paddle, Polar.sh, Freemius, Creem.io, or Lemon Squeezy into clear NRR reports and custom dashboards. Start by checking your last three periods and write down one retention action for the next review.

Written by
Chartsy TeamAnalytics team at Chartsy
The Chartsy Team writes guides, product updates, and resources to help SaaS and eCommerce founders make sense of their metrics, without SQL or spreadsheets.
Chartsy
