
A cohort effect is the difference in outcomes linked to the group of customers who entered together, after age and calendar time are separated out. If your newest customers retain worse than last year's customers, have you found a weaker cohort, or have you only measured them at a different age, during a harder month, or after a change in who arrived?
That question matters because cohort effects are easy to spot as gaps and hard to prove as causes. A table can show one acquisition month trailing another month after month, yet the same pattern could come from onboarding at entry, a billing problem that hit everyone, early-life drop-off, or a shift toward lower-intent channels. Treating every gap as a verdict leads to the wrong fix. Treating it as a hypothesis to test leads you to separate three clocks first, compare like with like, and only then change pricing, onboarding, or spend.
Table of Contents
- What a Cohort Effect Actually Measures
- Why Age, Period and Cohort Get Tangled
- How to Build Cohort Tables That Compare Fairly
- Telling a Cohort Effect From a Market Trend
- How Channel Mix Can Mimic a Cohort Effect
- Confirm the Cohort Pattern Before You Change Pricing or Onboarding
What a Cohort Effect Actually Measures
Say a school has a class that started together in one year. Those pupils share a starting point, but that isn't the same as their current age, and it isn't the same as what happens to the whole school in a particular year. A difficult new curriculum in one calendar year affects every class. Growing older changes every pupil over time. Something that shaped only that starting class, such as the teacher or classroom they first had, is closer to a cohort effect.
Subscription customers work the same way. Cohort effects capture experiences specific to customers who entered during a particular window, while age effects reflect life-stage processes and period effects reflect conditions affecting people at the same time, as explained in age-period-cohort work in the International Journal of Epidemiology. A retention gap between customers acquired in 2022 and 2023 shouldn't automatically be read as a product change or customer aging. It may reflect channel mix, pricing, economic conditions, onboarding design, or a campaign aimed at one group.
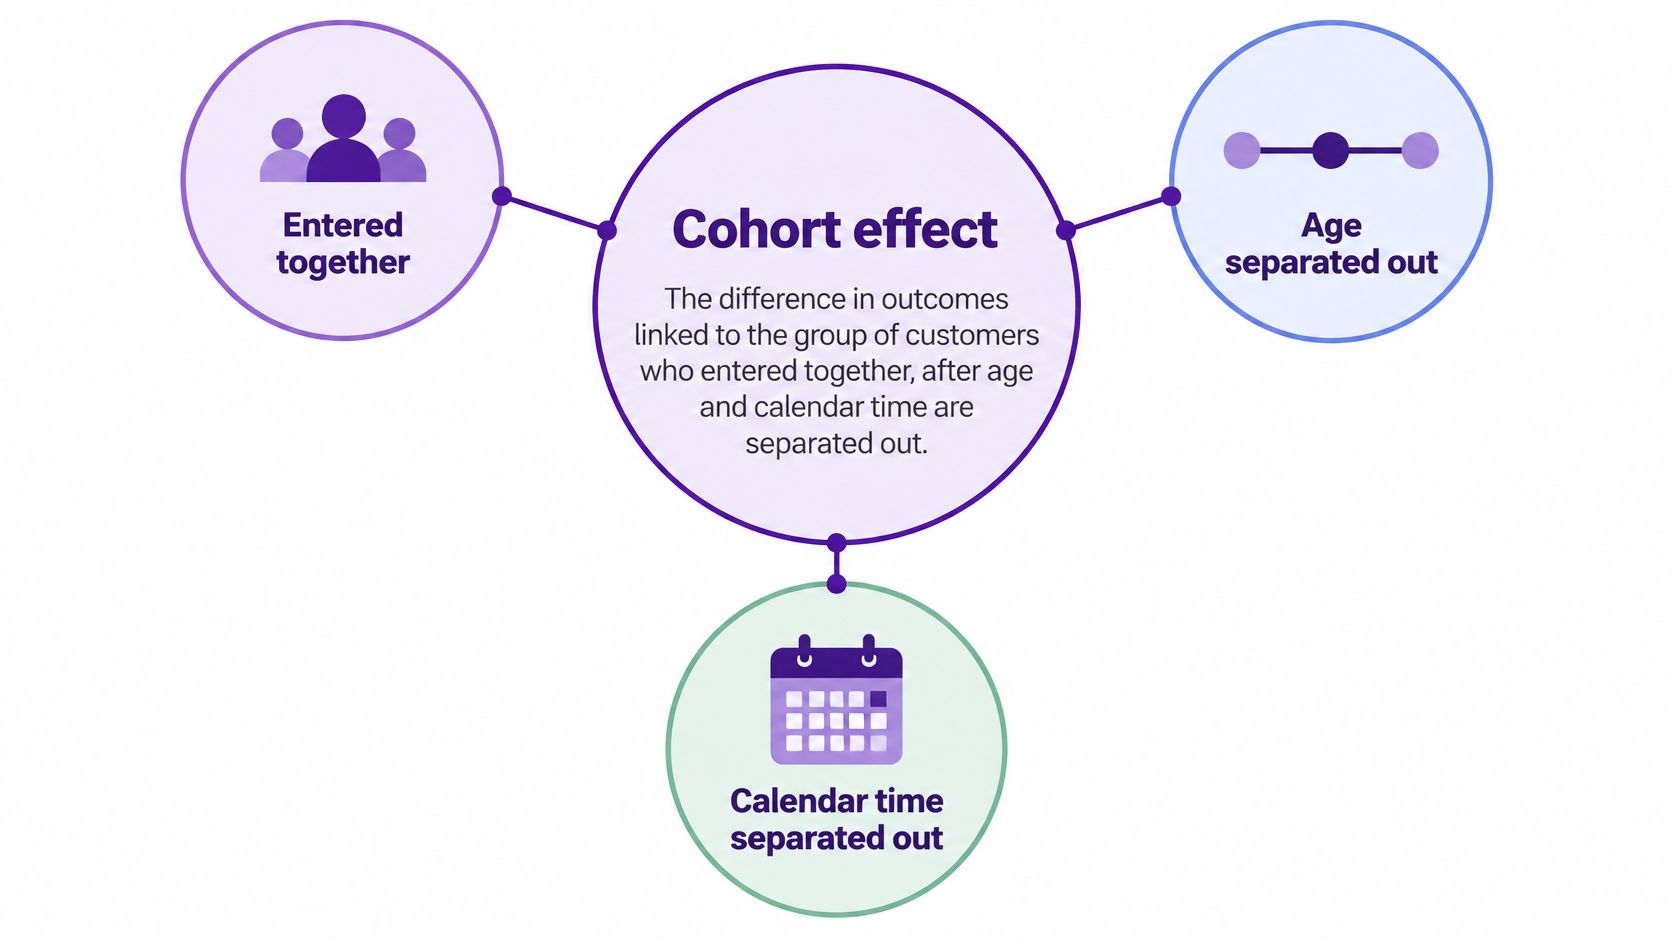
Keeping the Three Effects Apart
| Effect | What It Captures | Revenue Example | Typical Cause |
|---|---|---|---|
| Age effect | Changes that come with customer lifetime | Retention drops in months 2 to 4 for every cohort | Onboarding gaps and habit formation |
| Period effect | Shocks that hit all customers in the same window | Churn spikes in every cohort after a billing outage | Price change, outage or economic downturn |
| Cohort effect | Lasting differences among customers who entered together | Customers from one launch window retain worse at the same ages | Channel mix, launch offer, plan mix or onboarding at entry |
Read each row by asking who is affected. An age effect follows customers as they get older, so you see it at the same customer age in cohort after cohort. Early drop-off while habits form is a typical example. A period effect follows the calendar, so customers of different ages move together in the same month.
A cohort effect follows the entry group. Customers who arrived during a launch offer, for example, might keep trailing other customers at month 1, month 3, month 6, and month 12. That persistence at fixed customer ages is what makes the pattern worth investigating, especially after segmenting by plan, channel, geography, and initial contract value.
A gap between two cohorts is a question to test, not a finding yet.
Why Age, Period and Cohort Get Tangled
The tangle comes from one equation, cohort equals period minus age. Once you know any two of those values, the third is fixed. That simple arithmetic is why age, calendar period, and acquisition cohort can't be treated as three fully independent explanations.
Say a SaaS company groups customers by first paid month. A customer acquired in March 2025 and observed in March 2026 is 12 months old, belongs to the 2025 acquisition cohort, and is observed in period 2026. Change the observation date and you change age and period together, while the cohort stays put. This linear dependence is the age-period-cohort identification problem described in methodological work in the American Journal of Epidemiology, where cohort-related variation is estimated through age-by-period interactions rather than three unrestricted effects.

Why More Customers Don't Untangle It
A standard regression with all three effects left unrestricted can't pull them apart without extra assumptions. Adding more customers doesn't solve that problem, because you're adding more rows that follow the same arithmetic. You'll get a more precise answer to a question the data alone can't separate. If you want a practical reminder of how outside variables distort a comparison, examples of e-commerce confounders from Otter A/B show how a third factor can make two groups look different for the wrong reason.
The interaction idea gives you a more usable definition. A cohort effect is the gap between observed retention and what age and period alone would predict for that age and period. You're no longer asking which cohort ranks highest. You're asking which cohort does worse, or better, than its age and calendar conditions would lead you to expect.
The Two-Case Test
- Every cohort declines after a billing outage: Treat this mainly as a period effect, because customers of different ages move at the same calendar moment.
- Only the launch-window cohort underperforms at the same ages: Treat this as evidence more consistent with a cohort effect, then inspect that group's entry conditions.
Use fixed acquisition cohorts, equal follow-up windows, and confidence or bootstrap intervals where you can. Some differences disappear after period effects are added, which is exactly why raw rankings mislead.
Practical rule: Test whether a cohort pattern interacts with calendar conditions before ranking cohorts by raw retention.
How to Build Cohort Tables That Compare Fairly
A fair cohort table starts before any calculation, with rules that stop readers comparing unlike groups. The guide to subscription cohort analysis from NoChurn is a useful companion when you're setting up the basic matrix, but your own definitions and mix checks determine whether that matrix can be trusted.
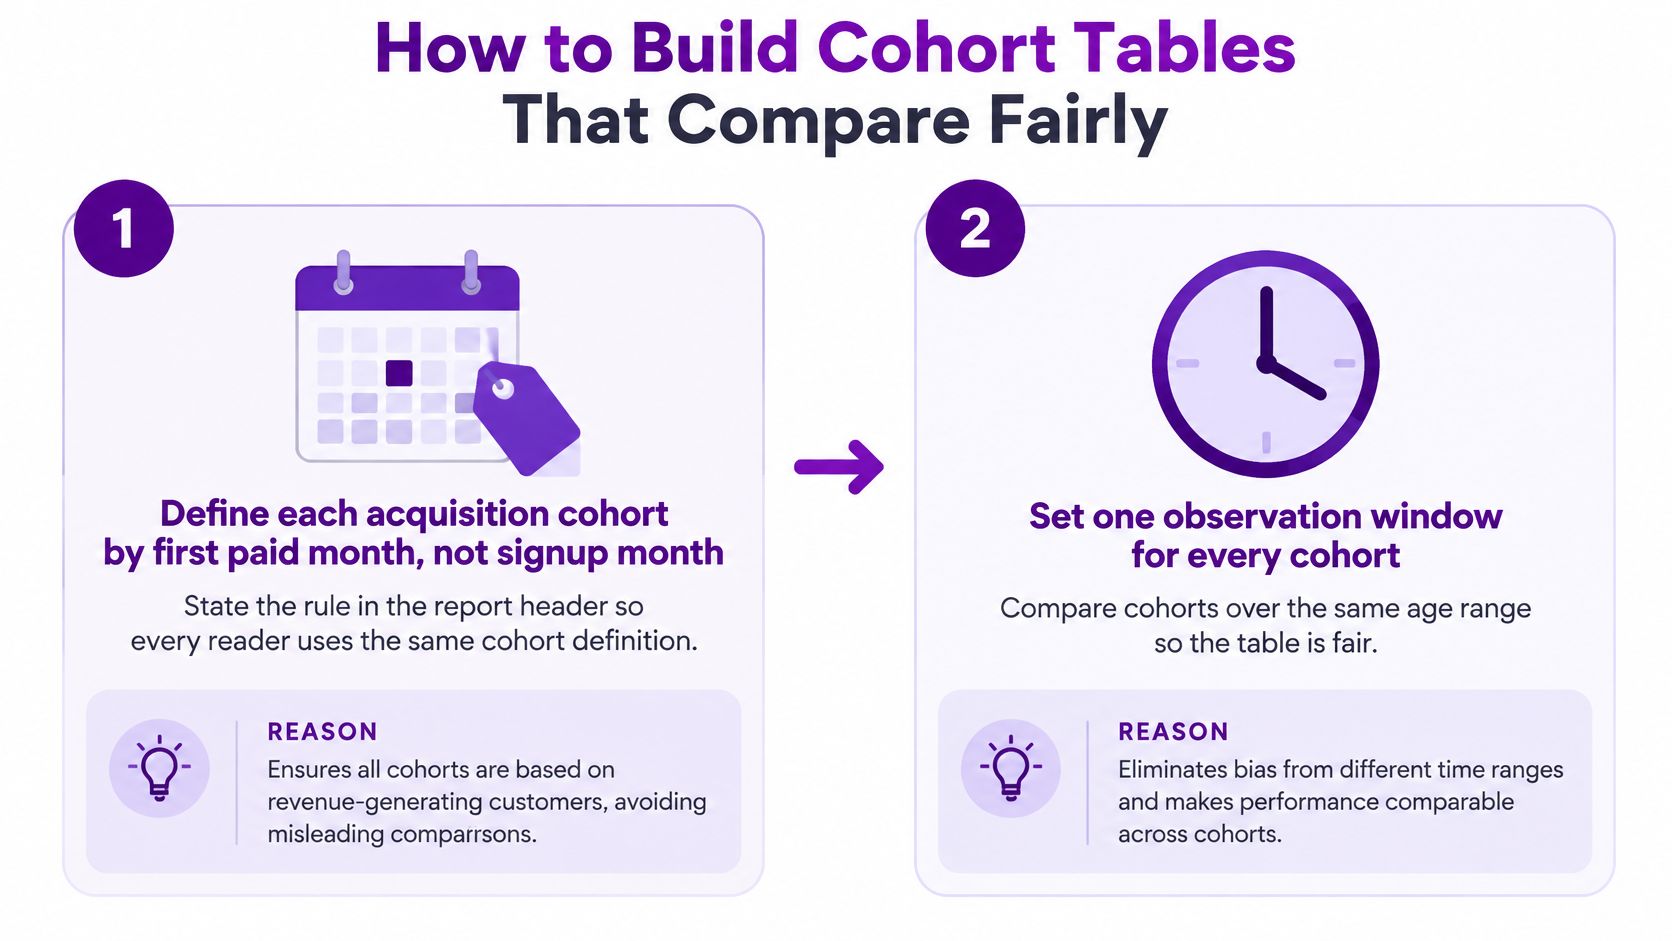
A Six-Step Build
- Define each cohort by first paid month, not signup month. State that rule in the report header. Signup timing mixes free users who never paid with customers, so first payment gives every reader the same starting line.
- Set one observation horizon, such as months 1, 3, 6 and 12. Include only cohorts that have reached that horizon. A young cohort can't lose a twelve-month comparison it hasn't lived through yet, and it shouldn't win one either.
- Calculate retained revenue or survival at each fixed customer age. Read every cohort at the same age, so a month 3 value always means three months after first payment. That consistency is what turns rows into comparisons.
- Segment by plan, acquisition channel, geography and initial contract value. Drop segments too small to read rather than presenting noisy percentages. Segmentation shows whether the gap belongs to the whole cohort or one slice of it.
- Record refunds, failed payments, censoring and mid-cycle plan changes beside each cohort. Readers need to see what moved the numbers, especially when retained revenue falls because payments failed rather than because customers chose to leave.
- Compare cohorts only within the same horizon and flag small or incomplete bases. Put the base size beside each row. A strong rate from a tiny base should never sit unmarked next to a rate from a much larger group.
The common slip is mixing annual and monthly customers in one row. Annual customers can't churn monthly in the same way, so an annual-heavy cohort can look like your best performer even when its underlying satisfaction is no better. Cohorts also differ systematically in geography, acquisition source, plan, device, pricing, eligibility, and exposure to shocks, a comparability problem set out in age-period-cohort research in a Springer methods chapter. One matrix therefore never shows equivalent populations by default.
Your finished table should have one row per cohort, columns by customer age, and a visible base size next to each row. Report composition and uncertainty alongside the averages, including plan mix, channel mix, currency, and regional context where they matter. Then ask not only which cohort retained best, but best for whom, under what exposure, and compared with what counterfactual.
Telling a Cohort Effect From a Market Trend
A retention gap rarely reveals its own cause because the same chart can come from three different places. It might be a customer-age pattern that every group passes through, a calendar shock that hit everyone at once, or an entry condition that only one group experienced. Your job is to eliminate explanations in order before naming one.
Reading the Diagnostic Table
| Pattern in the Data | Most Likely Source | Check Before Concluding |
|---|---|---|
| Every cohort dips in the same calendar month | Period effect | Compare cohorts within that calendar month and see whether the dip is shared |
| One cohort lags at every age from month 1 onward | Cohort effect | Check that cohort's channel, plan and offer mix against the others |
| Gap appears only after month 6 across cohorts | Age effect | Compare the same customer age across cohorts with equal observation windows |
| Gap disappears after adjusting for calendar month | Period artifact | Refit with period controls and report whether the difference survives |
| Newest cohort looks best only in its first month | Measurement artifact | Wait for the full observation window before ranking cohorts |
Start with calendar month. If every cohort dips together, you're probably looking at a shared event, not a string of coincidentally weak groups. Then check customer age, because a gap that opens at the same age for successive cohorts points toward lifecycle, renewal timing, or a feature customers reach later.
Only then move to mix. One cohort lagging from month 1 onward deserves scrutiny of its channel, plan, and offer mix, while a gap that vanishes after calendar adjustment shouldn't keep its cohort label. If you need context for whether the underlying retention level is unusual, compare it with retention benchmarks for SaaS companies, but don't let an external benchmark decide the cause inside your own table.
The Generation Shortcut
It's tempting to treat cohorts, and generations more broadly, as stable groups with fixed behavior. That shortcut fails because age, calendar-time shocks, and birth or entry cohort are mathematically linked through age = period minus cohort, so a standard regression can't independently estimate all three without additional assumptions, a point made in recent methodological work in Advances in Methods and Practices in Psychological Science. A larger sample doesn't remove that constraint.
That work also suggests cohort effects may be better understood as interactions between age and period than as a standalone generational coefficient. In subscription terms, cohort retention isn't automatic evidence of durable customer behavior. It's a descriptive comparison until you've applied fixed observation windows, period controls, and mix adjustment, and considered changes in pricing, onboarding, product quality, tracking, or payment failures.
Say a cohort looks strong after a pricing change that improved results for every cohort in the same month. That isn't a better cohort. It's a cohort measured during a favorable period.
Ask three questions of any gap:
- Same calendar month: Did other cohorts move then too?
- Same customer age: Are you comparing equal points in the lifecycle?
- Same customer mix: Would the gap survive segmentation?
How Channel Mix Can Mimic a Cohort Effect
Cohorts rarely differ only by start date. They also differ in where their customers came from, and that difference can wear a cohort label.
Say one month's signups come mostly from a paid social campaign that attracted curious, lower-intent visitors. The next month's signups come mainly from referrals and direct visits by people who already knew the product. If the referral-heavy month retains better, you haven't necessarily found a stronger entry month. You may have found a stronger source of customers arriving inside that month.
What First-Touch and Last-Touch Mean
First-touch attribution credits the channel that started the customer journey. Last-touch attribution credits the channel just before conversion. Both views can help you describe a journey, but neither gives you a definitive causal answer about why someone bought or stayed.
Attribution accuracy depends on the assumptions built into the model and the completeness and quality of the underlying data, as a Google Research paper on hidden assumptions in digital attribution models explains. Its simulations point to systematic user censoring, differences in user activity, and ad targeting as limits on attribution performance. Single-touch and rule-based models can also overvalue particular channels in multi-touch journeys, while cross-device tracking gaps and privacy rules leave parts of the path unseen.
That's why channel labels should be handled carefully in cohort work. The channel attached to a customer may depend on which touch your report credits, which devices you could connect, and which visits were recorded. A change in tracking can therefore look like a change in customer quality if you don't inspect the source data.
For a practical view of connecting journeys to paid outcomes, see how to track paying customers by marketing channel. Use that channel view to test the cohort story, not to replace it.
Hold Channel Constant
- Split each cohort by first-touch channel. Keep the same fixed ages and observation horizon inside every split.
- Compare retention within each channel. Ask whether the newer cohort still trails among referral customers, search customers, and paid social customers separately.
- Check whether the cohort gap persists once channel is held constant. If it largely disappears, channel mix was doing much of the work. If it remains inside channels, entry conditions beyond source deserve attention.
Channel reports show where paying customers began, not proof of what kept them subscribed.
Confirm the Cohort Pattern Before You Change Pricing or Onboarding
The moment a cohort gap leads to a proposed price rise, onboarding redesign, or acquisition-spend cut, slow the decision down. You're no longer describing a table. You're choosing an intervention, and each cause calls for a different one.
The image below captures the right posture, close inspection of the pattern before a business change.

Three Outcomes, Three Responses
Outcome 1, the gap appears across every cohort in one calendar month. Treat it as a period effect and fix the shared shock, such as a billing outage, failed-payment problem, or poorly communicated price change. Rebuilding onboarding for one cohort won't repair a calendar-wide failure.
Outcome 2, one cohort lags at the same customer ages after you control for calendar month and mix. Investigate its entry condition. Look at the offer it received, the plan it started on, the channel that brought it in, and the onboarding version it saw. That persistence is the strongest practical signal that something at entry left a lasting mark.
Outcome 3, the gap disappears after mix adjustment, or the base is too small to read. Treat the pattern as descriptive only and collect more customers before acting. A small cohort can swing sharply when a handful of accounts churn, and spending money to chase that noise teaches you nothing reliable.
This short video is a useful pause point before you turn the diagnosis into a checklist for your own report.
Pre-Action Checklist
- Confirm the newest cohort has reached the full observation window. Don't rank a cohort at month 12 when it has only reached month 4.
- Check that the base size sits beside every row. Readers should see the denominator before they react to the percentage.
- Compare the same calendar month before blaming the product. Shared movement points first to shared conditions.
- Treat a purchase after an email as one touchpoint among several. Research on attribution without user-level data notes that a conversion after an email doesn't prove the email caused it, since intent may have formed through search, social media, or another channel. Separate platforms record separate touchpoints, and privacy limits can make aggregated results biased or incomplete.
- Confirm the cohort start rule, first paid month. Remember that the analysis describes past cohorts. It doesn't forecast which current customers will leave.
- State attribution assumptions in the report. No model gives perfect credit, so name whether you're using first-touch or last-touch and what data may be missing.
Chartsy can help rerun the same fixed-age comparison each month on current billing data, and our MCP growth and retention tools give churn rate over any date range at day, week, month, quarter or year granularity, plus new subscribers by day, week or month. Any summary is only as reliable as the cohort definitions behind it, so verify the start rule first and keep it unchanged between runs.
Build your next cohort table from actual billing records, hold customer age and calendar time steady, and test channel and plan mix before you decide a cohort is weaker. Visit Chartsy to connect your subscription billing and website activity, compare retained revenue by cohort, and rerun the same fair comparison every month without rebuilding it in spreadsheets.

Written by
Chartsy TeamAnalytics team at Chartsy
The Chartsy Team writes guides, product updates, and resources to help SaaS and eCommerce founders make sense of their metrics, without SQL or spreadsheets.
Chartsy