Track Your Revenue Growth, Identify Your Best Plans, and Reward Top Customers
TL;DR
This dashboard helps you see exactly how your revenue is performing. Discover which pricing plans drive the most recurring revenue, identify your highest-value customers, and monitor MRR and ARR trends - so you can double down on what works and take action on what doesn’t.
What this template contains
The Revenue Analytics Template brings together all your key revenue metrics in one place so you can:
- Track MRR and ARR
- Monitor revenue growth trends
- See how much revenue you gain vs. lose
- Understand which plans and customers generate the most revenue
- Evaluate the overall financial health of your business
This template is ideal for founders, finance teams, and anyone responsible for revenue tracking and reporting.
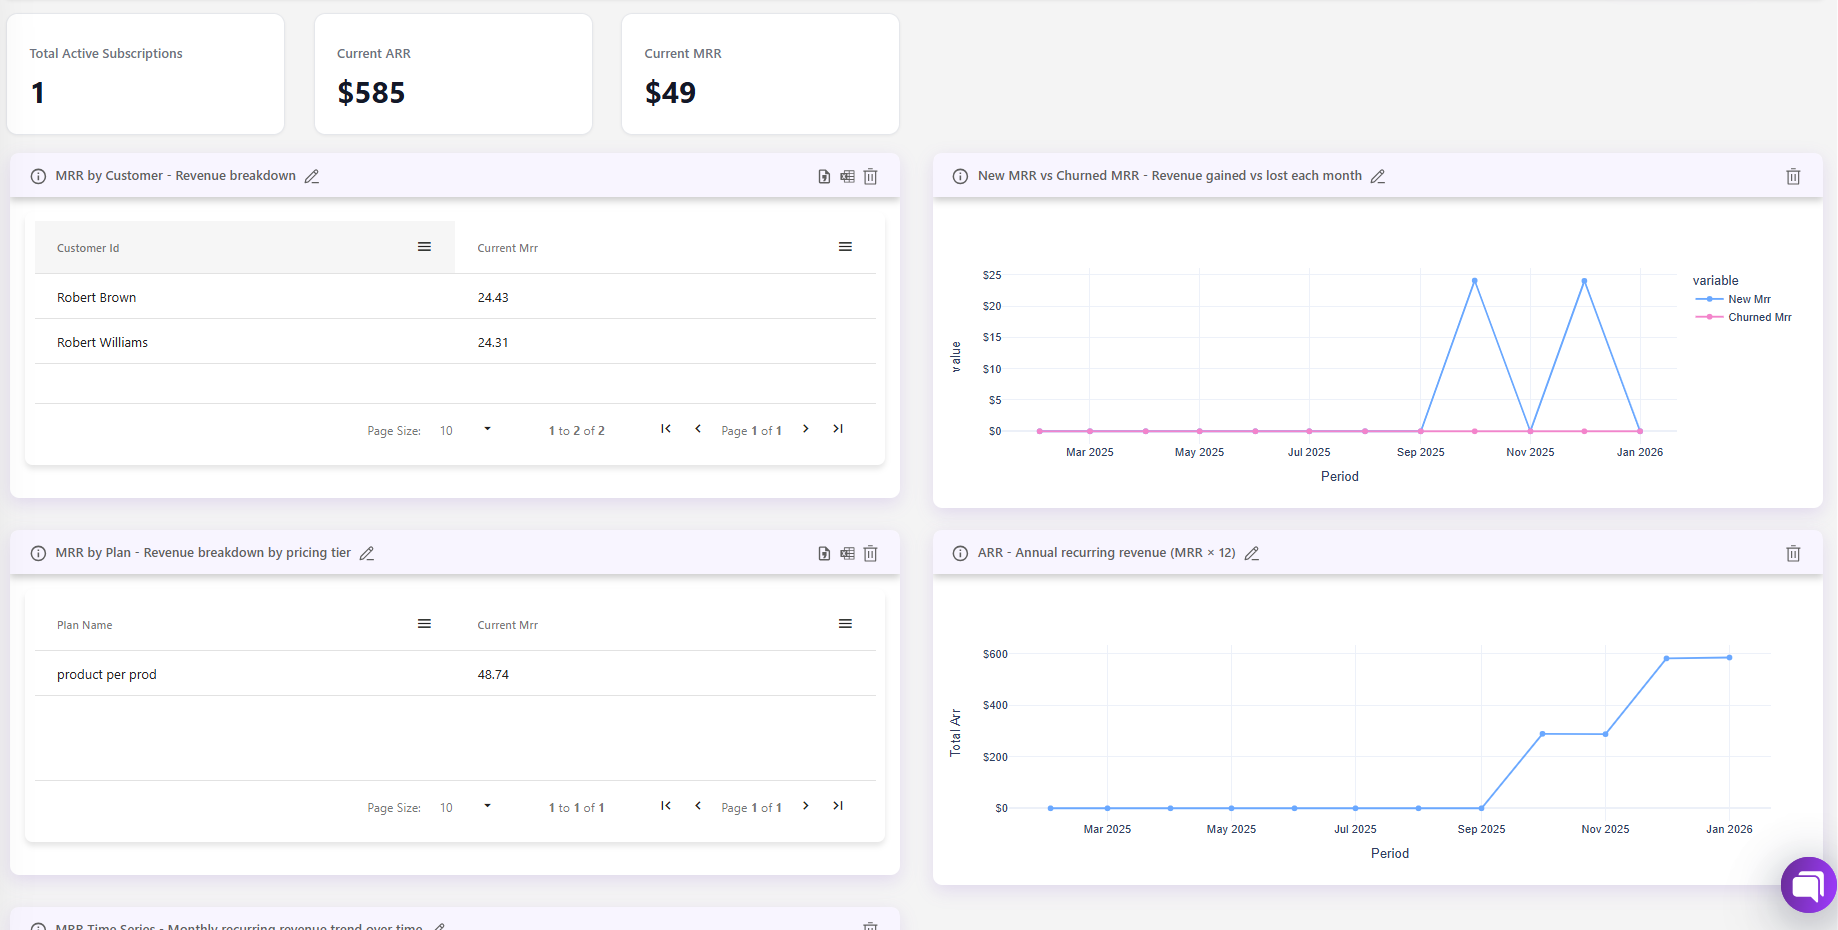
Metric breakdown
Current MRR (Monthly Recurring Revenue)
MRR shows how much predictable revenue your business generates every month.
Why it matters
MRR is the clearest indicator of business health. If MRR is growing, your business is growing. If it’s shrinking, it’s a sign that churn or pricing issues need attention.
Current ARR (Annual Recurring Revenue)
ARR is your MRR multiplied by 12 and represents your yearly recurring revenue.
Why it matters
ARR helps you understand long-term revenue potential and is commonly used for forecasting and investor reporting.
Total Active Subscriptions
This shows how many customers are currently paying for your product.
Why it matters
A decline in active subscriptions often signals churn or billing problems, while steady growth indicates healthy demand.
MRR time series
A chart showing how your MRR has changed over the past 12 months.
Why it matters
It helps you identify growth trends, seasonality, and sudden revenue changes.
ARR trend
Shows how your projected annual revenue has evolved over time.
Why it matters
This helps you understand whether your business is scaling consistently or experiencing fluctuations.
New vs. churned MRR
Compares new revenue gained with revenue lost from churn each month.
Why it matters
This metric shows whether you are truly growing or just replacing lost customers.
MRR by plan
Breaks down revenue by pricing tier.
Why it matters
Helps you understand which plans drive the most revenue and whether your pricing strategy is effective.
MRR by customer
Shows how much each customer contributes to your revenue.
Why it matters
Helps identify high-value customers and assess revenue concentration risk.
Revenue Analytics Template
When to use this template
Use this template when you want a clear understanding of your revenue performance and business health.
It’s especially useful if you:
- Track MRR and ARR regularly
- Prepare reports for investors or stakeholders
- Monitor revenue growth and churn
- Want to understand which customers and plans drive revenue
This template is ideal for ongoing financial monitoring and strategic decision-making.
What this template helps you answer
- Is my revenue growing or declining?
- How much predictable revenue do I have?
- Which plans generate the most revenue?
- Am I losing more revenue than I’m gaining?
- Who are my highest-value customers?
How to get started
- Open the Revenue Analytics Template
- Review your MRR, ARR, and revenue trends
- Analyze churn and growth patterns
- Identify top-performing plans and customers
- Use insights to guide pricing and growth decisions
Final note
This template gives you a real-time view of your business performance.
If you want to understand the financial health of your SaaS at a glance, this is the place to start.
Try Revenue Analytics Template at Chartsy.


