Ask Any Question About Your Data and Get Instant Insights
TL;DR
The Blank Canvas gives you total flexibility to explore your business metrics. Ask natural-language questions, generate custom charts, and combine metrics in unique ways - perfect for uncovering insights that prebuilt dashboards can’t show.
What this template contains
The Blank Canvas Template starts with an empty dashboard and lets you create exactly what you need - no predefined metrics, no limitations.
Instead of choosing from prebuilt reports, you can:
- Ask questions in plain English
- Generate custom charts instantly
- Combine metrics in unique ways
- Explore your data freely
This template is ideal for advanced users or anyone with specific analytical needs.
What you can do with the Blank Canvas
Ask questions in natural language
You can type questions like:
- “Show me refund rates by product and month”
- “Compare revenue by country”
- “Which customers downgraded in the last 30 days?”
Why it matters
You don’t need SQL or technical knowledge. Chartsy translates your question into the right chart automatically.
Generate custom charts instantly
The Blank Canvas allows you to create:
- Line charts
- Bar charts
- Tables
- Comparisons
- Trend analyses
Why it matters
You can explore data without being limited by predefined dashboards.
Combine metrics in unique ways
You can mix different data points such as:
- Revenue + refunds
- Customers + plan changes
- Geography + payment success
- Time-based performance
Why it matters
This helps uncover insights that standard dashboards often miss.
Explore data freely
Unlike structured templates, the Blank Canvas is built for exploration.
Why it matters
It’s ideal when:
- You’re investigating a problem
- Something looks off in your metrics
- You want to answer a new question quickly
- You’re preparing a custom report
Example use cases
Here are examples of questions you can answer in seconds without exporting data or building reports manually:
- “Show refund rates by product and month”
- “Compare payment success rates by country”
- “Which customers downgraded this month?”
- “What’s my revenue by billing interval?”
- “Show failed payment trends over time”
Blank Canvas Template
When to use this template
Use the Blank Canvas when you need full flexibility and custom insights.
It’s ideal if:
- You want to explore data freely
- You have questions not covered by templates
- You need a custom report or analysis
- You want to investigate specific trends
What this template helps you answer
- What’s happening in my data right now?
- Why did a specific metric change?
- How do different metrics relate to each other?
- What patterns or anomalies exist in my data?
- What insights can I uncover beyond standard reports?
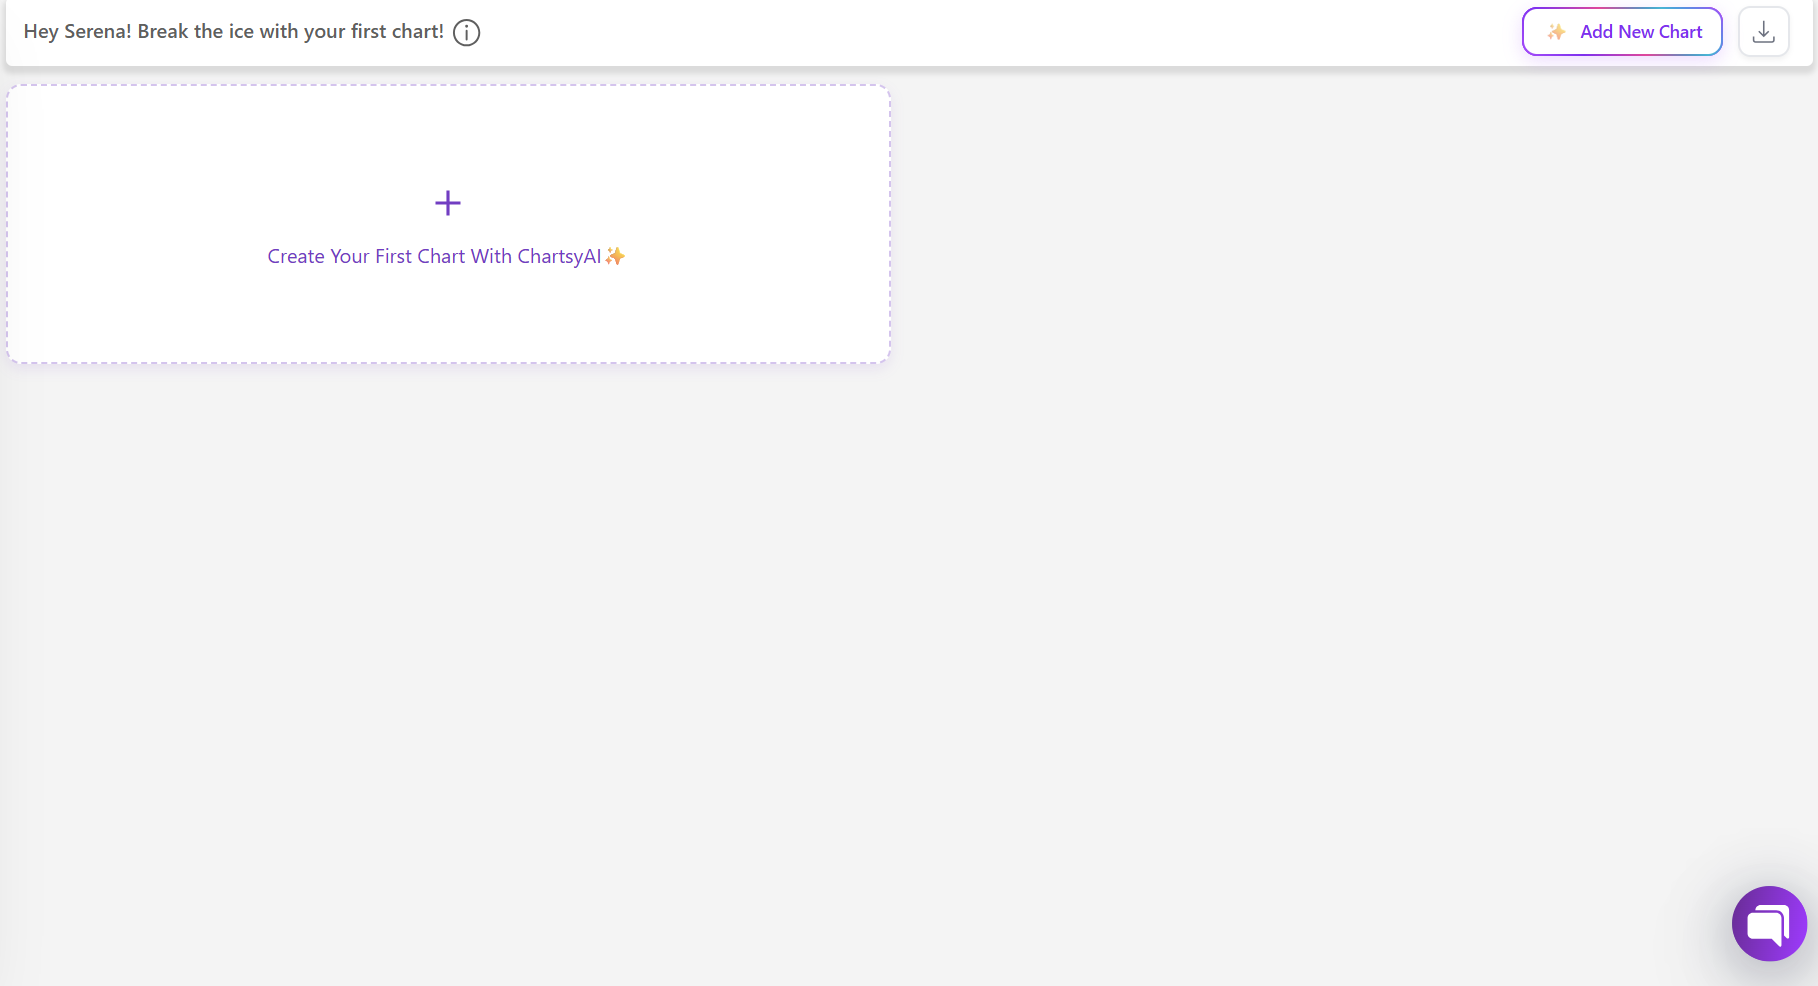
How to get started
- Open the Blank Canvas Template
- Type your question in natural language
- Let Chartsy generate the chart
- Add additional visualizations as needed
- Customize the dashboard to fit your use case
Final note
The Blank Canvas is where insights happen.
It gives you complete freedom to explore your data without limitations.
Try Blank Canvas at Chartsy.