
Customer lifetime value is the present value of the profit a typical customer generates over the whole relationship, minus the cost of acquiring them; the simplest operating estimate is ARPU × gross margin ÷ churn rate, before acquisition cost and discounting.
You may be looking at rising subscription revenue while wondering whether you can afford another acquisition campaign. The useful question isn't just how much customers pay. It's how much they leave behind, how quickly you recover your spending, and whether the answer changes by channel.
Table of Contents
- Why Customer Lifetime Value Shapes Growth Decisions
- Customer Lifetime Value Defined in Plain Terms
- Three Formulas Compared on One Example
- What Distorts the Number and How to Check It
- Reading LTV Alongside CAC and Retention
- Calculate Your Customer Lifetime Value This Week
Why Customer Lifetime Value Shapes Growth Decisions
Say two customers each pay $50 a month. One stays for three years, the other cancels after two months, and you spent $400 in advertising to acquire each of them. These are hypothetical inputs, but the budget decision is familiar: both customers initially add the same monthly revenue, yet their economics are very different.
If each came from a different campaign, which campaign should you fund again? A monthly revenue dashboard alone can't answer that. You need an estimate of the contribution each customer relationship will generate relative to what you paid to start it.
The decision behind the metric
For bootstrapped founders and small SaaS teams without a data analyst, customer lifetime value makes that comparison manageable. It connects acquisition spending with the duration and profitability of the relationship, rather than treating every new subscription as equally valuable.
Stopping at revenue collected so far creates another problem. A recent customer may look less valuable because they haven't had time to renew, while a long-standing customer may have generated substantial revenue but required expensive support.
Budgeting principle: Compare customers on the contribution you expect to recover, not just the subscription amount they initially add.
A workable calculation doesn't require an elaborate forecasting system. It requires clearly labeled inputs, a consistent treatment of costs, and enough retention history to judge the estimate.
Once you can distinguish weak acquisition economics from weak retention, you can choose more relevant ways to increase customer lifetime value. The practical outcome is a basic value you can calculate for your product, alongside a clear understanding of when it deserves trust.
Customer Lifetime Value Defined in Plain Terms
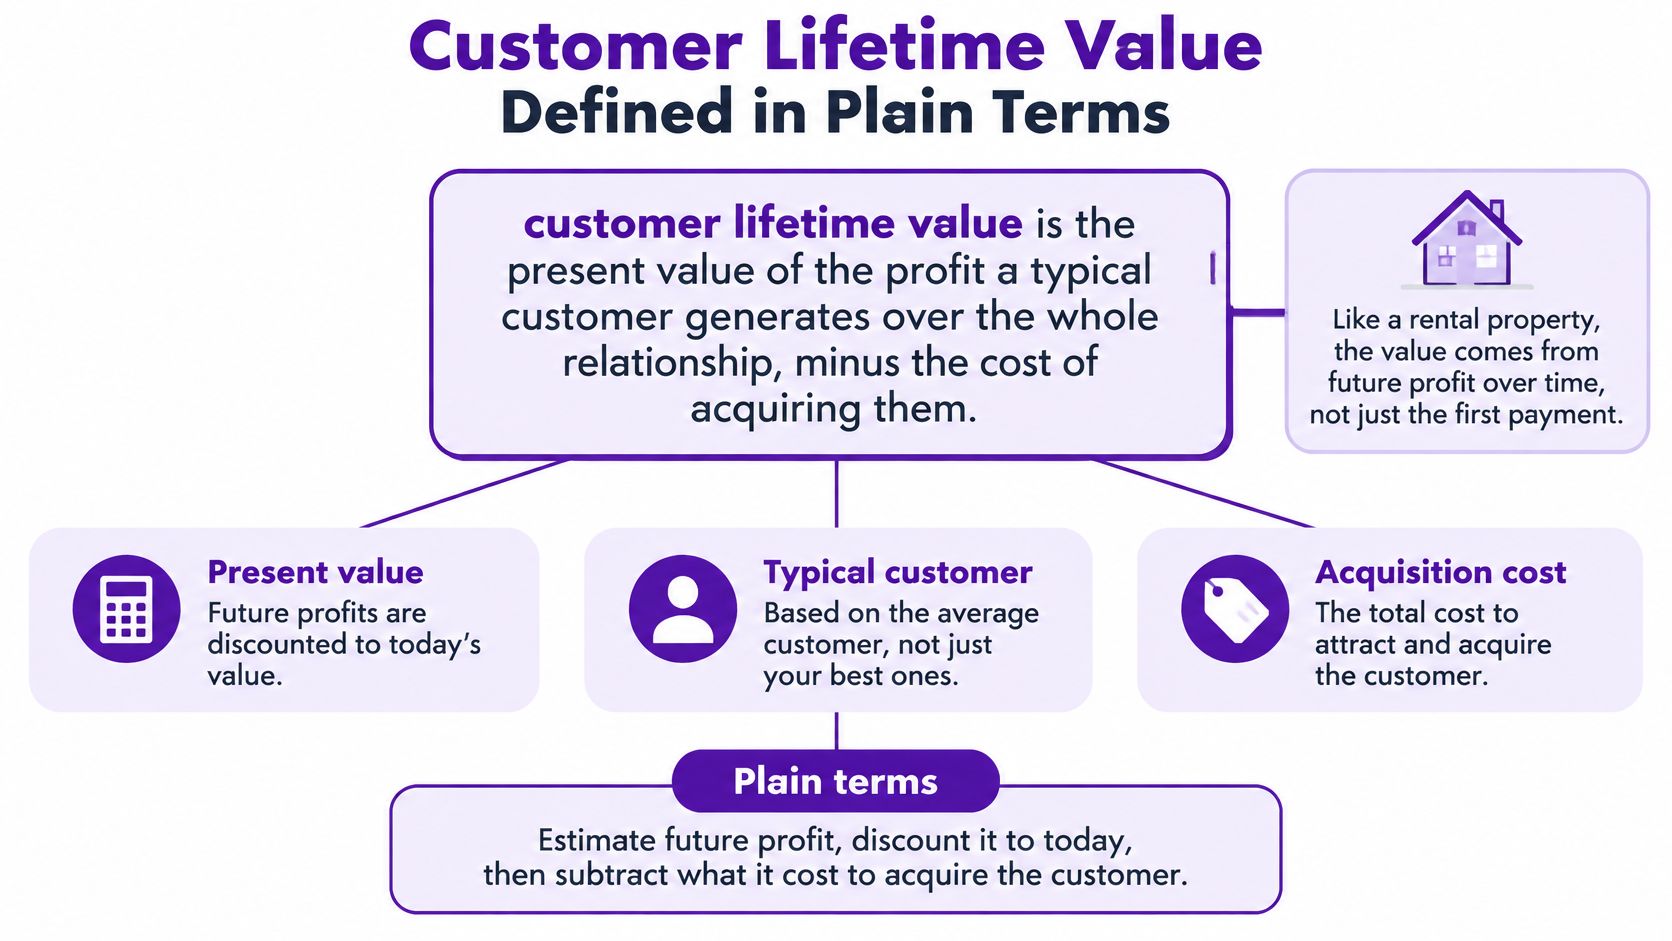
A useful customer lifetime value definition focuses on future customer profit expressed in today's money, after acquisition cost. Think of a rental property: its economic value comes from the future net income it can produce, not just the rent collected so far.
The visual below separates the main parts of that definition.
Start with terms you can measure
Several related metrics answer different questions:
- Lifetime revenue: What a customer or channel has paid to date, with nothing projected.
- ARPU: Average revenue per user or account per period. For account-based SaaS billing, calculate revenue and customer counts at the account level consistently.
- Customer churn rate: Customers who cancel during a period divided by customers at the start of that period. It counts customers, not lost revenue.
- Gross margin: The share of revenue remaining after the direct costs of delivering the service.
The simplest margin-based estimate is:
Margin-based LTV = ARPU × gross margin ÷ customer churn rate
Use matching periods throughout. Monthly ARPU needs monthly churn, and gross margin should be entered as a decimal rather than a whole percentage.
This shortcut estimates future gross contribution before acquisition cost. It isn't a fully discounted, net customer valuation, so label it accordingly rather than treating every figure called LTV as interchangeable.
Add time and acquisition cost
The mathematical treatment in Ferrentino's customer lifetime value paper expresses CLV as discounted future contribution profits less acquisition cost:
[ CLV = \sum_{t=0}^{T}\frac{p_t-c_t}{(1+i)^t}-AC ]
Here, (p_t) is the customer's payment in a period, (c_t) is the direct service cost, and (i) is the discount rate or cost of capital. (t) identifies the period, (T) is the model's final period, and (AC) is acquisition cost.
Discounting recognizes that money available later is worth less than money available today. You can't use a future renewal to pay a current advertising invoice, and you face uncertainty while waiting for it.
For another format, the accompanying video offers a further explanation.
The shortcut assumes stable economics rather than modeling every future payment. As an algebraic check, doubling churn halves margin-based LTV, provided ARPU and gross margin stay unchanged. That sensitivity makes the retention assumption a central part of the calculation, not a minor input.
Three Formulas Compared on One Example
Consider a hypothetical SaaS product with $100 monthly ARPU, 80% gross margin, 5% monthly customer churn, 95% monthly retention, a 1% monthly discount rate, and $400 customer acquisition cost.
Monthly gross contribution is $100 × 80% = $80. All results below are calculations from these illustrative inputs, not performance benchmarks.
Customer lifetime value methods on the same example
| Method | Formula | Best use |
|---|---|---|
| Revenue-based | ARPU ÷ monthly churn = $100 ÷ 0.05 = $2,000 | Quick benchmarking only; ignores cost to serve |
| Margin-based | ARPU × gross margin ÷ monthly churn = $100 × 0.80 ÷ 0.05 = $1,600 | Default for budgeting and channel comparison |
| Discounted margin | Monthly margin × retention ÷ (1 + discount − retention) = $80 × 0.95 ÷ (1.01 − 0.95) = $1,266.67 | Investment decisions under cash constraints |
| Net value after CAC | Margin-based LTV − CAC = $1,600 − $400 = $1,200 | Whether a channel creates value after acquisition |
| CAC payback | CAC ÷ monthly gross margin = $400 ÷ $80 = 5 months | How fast acquisition cash comes back |
The revenue-based result includes money you'll spend delivering the service. It can help compare similarly defined revenue metrics, but it overstates the contribution available to recover acquisition spending and fund the business.
The margin-based result removes that direct delivery cost. It's a more useful working default for budgets, provided the margin estimate reflects the customers you're evaluating rather than an unrelated company-wide average.
Why the discounted result is lower
The discounted-margin formula starts with an expected future contribution weighted by retention. Its timing convention assumes the first modeled contribution arrives after the customer must survive another period, rather than including an immediate contribution today.
That distinction matters. The difference from the margin-based shortcut reflects both discounting and payment timing, not discounting alone. If you're valuing a customer immediately after a payment, document whether that payment is already included.
Subtracting the hypothetical acquisition cost from discounted contribution gives $866.67 in discounted net value. Keep that separate from the undiscounted net-value row rather than choosing whichever answer looks more attractive.
A formula is useful only when you can explain which payments it includes and when those payments arrive.
The payback result also needs a qualification. Five months is a simple surviving-customer estimate with constant monthly margin, not a cohort cash forecast. Cancellations before recovery, billing schedules, and changes in contribution can alter actual recovery.
Retention improvement takes different forms across business models. For a store selling repeat purchases rather than subscriptions, YipSMS Inc.’s guidance on how to improve second-order rate on Shopify offers a related way to think about earning another purchase.
Test the assumption before choosing the answer
Using the same hypothetical $80 monthly contribution, margin-based LTV becomes:
- At 3% monthly churn: $80 ÷ 0.03 = approximately $2,666.67.
- At 8% monthly churn: $80 ÷ 0.08 = $1,000.
Use revenue-based LTV for quick benchmarking, margin-based LTV for operating comparisons, and discounted contribution for decisions where timing matters. Don't mistake additional decimal places for additional certainty.
What Distorts the Number and How to Check It
Correct arithmetic can still produce a misleading valuation. The main risks are usually the customers grouped together, the length of their observed history, the meaning of profit, and the billing events behind reported revenue.
Segment before averaging
A blended churn rate assumes customers behave similarly enough to share one forecast. That's often the assumption most worth challenging: research on customer lifetime value modeling warns that simplified calculations can overlook differences in retention and churn within a cohort.
Start with acquisition channel, plan, and signup cohort. Add geography or customer type when those distinctions affect service costs or buying behavior, but don't create so many tiny segments that individual cancellations dominate every result.
Say a paid-search campaign brings customers who cancel shortly after onboarding, while partner referrals renew and expand. A blended estimate can make both channels look acceptable even though only one reliably recovers its acquisition cost.
The check: Put channel-level acquisition cost, gross contribution, and retention next to each other. Then compare customers at similar ages, rather than comparing recent campaign customers with referrals accumulated over a much longer period.
An explanation of cohort effects can help you separate differences in customer mix from changes in the experience customers receive.
Separate observed value from projected value
A new cohort hasn't revealed its full renewal pattern. Extending its early behavior indefinitely can produce a confident-looking answer that rests on very little observation.
Annual subscriptions require particular care. A cancellation instruction may prevent the next renewal while leaving paid access active until the current term ends, so cancellation intent and the end of the paid relationship aren't interchangeable.
Publish a compact record beside each forecast:
- Observation window: The signup dates included and the period through which payments have been observed.
- Realized contribution: Revenue collected so far, less the direct costs assigned to that same period.
- Projected contribution: The remaining value estimated under stated retention and margin assumptions.
- Scenario range: Conservative, base, and optimistic assumptions, clearly distinguished from statistical confidence intervals.
Mature cohorts provide more observed behavior, but they may reflect older pricing or onboarding. Recent cohorts better represent the current offer, yet require more forecasting. Neither group should stand in for the other.
Publish clearly labeled value layers
Revenue, gross contribution, and net customer value aren't substitutes. MIT Sloan Management Review's discussion of calculating CLV frames the metric around future customer cash flows and decisions about acquisition and retention, while identifying customer differences and discount-rate estimation as important challenges.
A practical report should distinguish realized revenue LTV, gross-margin LTV, and net value after CAC. For each layer, state whether it is observed or forecast and whether it is discounted.
This prevents a revenue forecast from being compared directly with fully loaded acquisition spending. It also prevents acquisition cost from being subtracted twice when someone calculates an LTV-to-CAC ratio.
Gross contribution isn't the same as company-wide operating profit. You still need money for expenses outside the direct delivery costs included in your margin calculation.
Reconcile the billing events
A stable recurring-revenue total doesn't establish stable customer contribution. Refunds, failed payments, prorations, discounts, and mid-cycle plan changes can alter what you collect or retain.
Build the calculation from invoice and payment records with explicit treatment of each event. Distinguish an unsuccessful collection attempt from a final loss, and avoid counting a refund both as reduced revenue and as a separate service expense.
Before trusting the forecast: Reconcile its realized portion to billing records, then inspect the assumptions used for the unobserved portion.
These checks correct several common misconceptions at once. CLV isn't merely total revenue, one average churn rate doesn't fit every customer, and a mathematically correct formula doesn't rescue a short observation window.
Nor does a higher forecast automatically justify higher spending. You need the margin to materialize, the customer to stay, and enough cash to wait.
The most useful improvement may be exposing the segment hidden by the average, not refining the equation. Your acquisition budget ultimately depends on margin, payback, uncertainty, and available cash, rather than one universal CLV number.
Reading LTV Alongside CAC and Retention
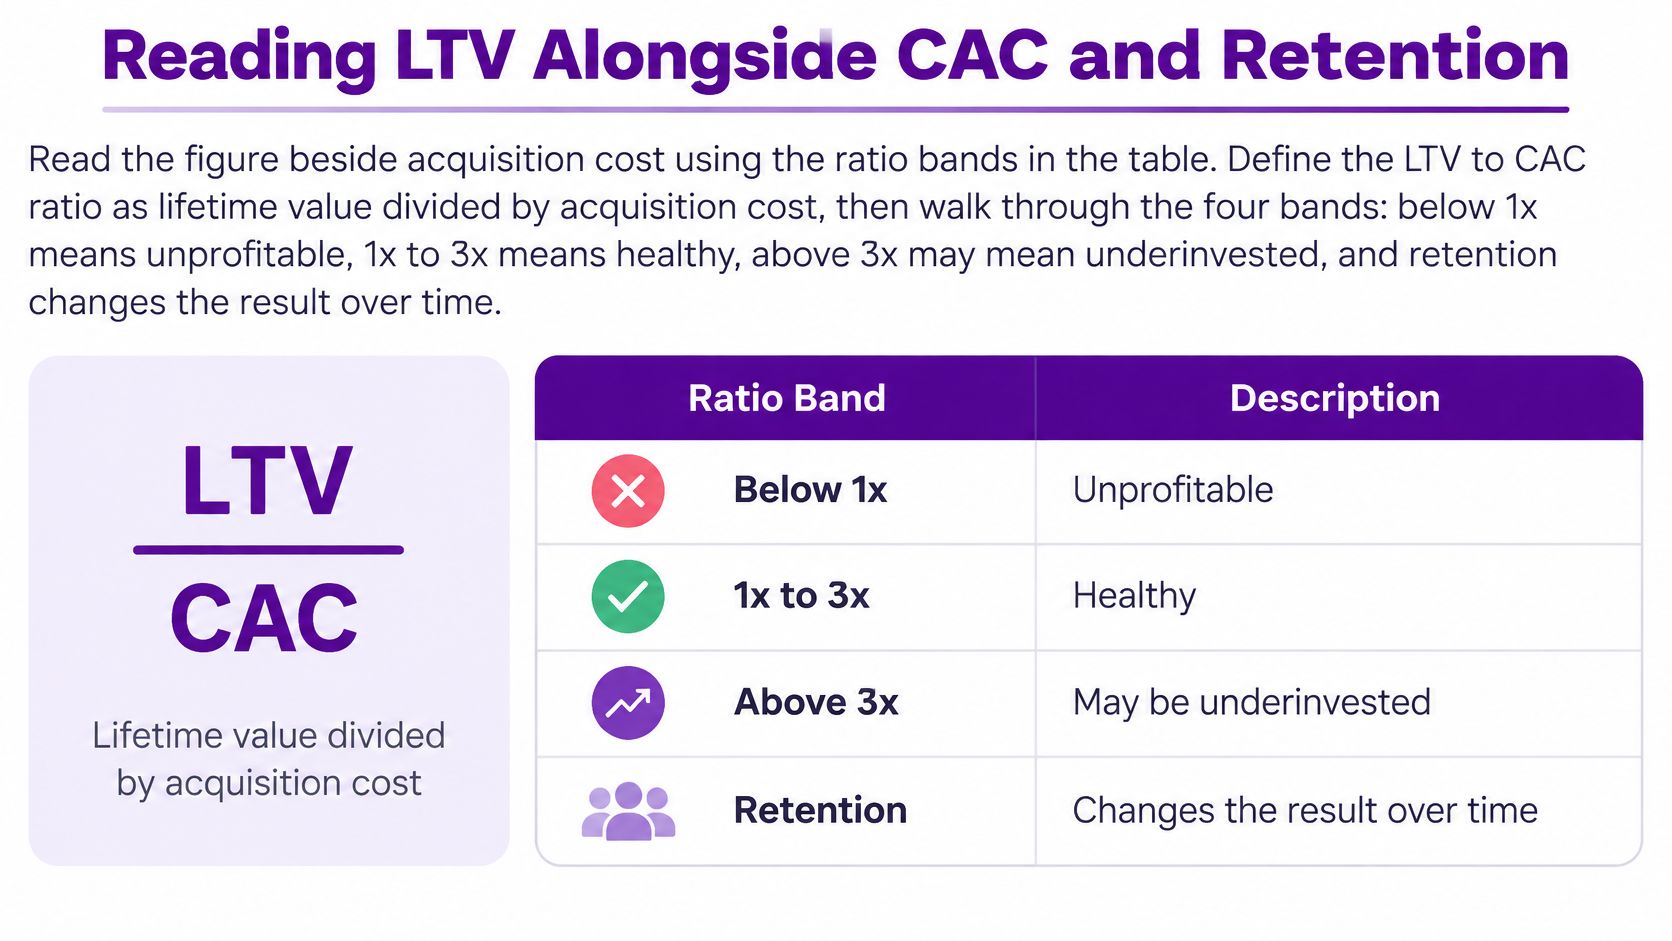
Calculate the LTV-to-CAC ratio by dividing lifetime contribution before acquisition cost by acquisition cost. Using net value after CAC in the numerator would deduct acquisition spending before comparing against it again.
The bands below are planning heuristics, not validated boundaries for every SaaS business. Your margin definition, forecast quality, overhead, and cash position still determine whether spending is affordable.
LTV to CAC ratio bands and what to do
| LTV to CAC ratio | What it signals | Typical response |
|---|---|---|
| Below 1x | Customers return less than they cost | Fix retention or pricing before adding spend |
| 1x to 3x | Thin margin for error | Improve retention, lower acquisition cost or raise margin |
| Around 3x | Common rule of thumb for healthy growth | Scale the channels that hold this level |
| Above 5x | Possible underinvestment in growth | Test higher spend while watching payback |
Around 3x is a rule of thumb, not a law. A high ratio may justify a spending experiment, but it doesn't prove that additional customers are available at the same acquisition cost.
The following visual provides a simplified ratio reference. Use the more cautious table above for budget decisions, rather than treating a band label as proof of profitability.
Apply the ratio to a channel decision
In a hypothetical comparison, channel A costs $400 per customer and produces $1,600 in lifetime gross contribution, giving a 4x ratio. Channel B costs $250 and produces $500, giving a 2x ratio.
Channel A has stronger lifetime economics despite its higher acquisition price. Choosing channel B only because its CAC is lower would miss the contribution difference.
Use a consistent customer acquisition cost calculation across channels, including the same categories of spending and the same customer-acquisition window.
Then check recovery timing. Under 12 months can serve as a planning rule of thumb for many self-serve products, but your actual limit should follow the cash you can commit, not an external target.
Verify what keeps the contribution coming
Compare customer retention curves, customer churn, and net revenue retention for each channel. NRR describes how an existing cohort's revenue changes, including expansion, while customer retention shows whether the underlying relationships survive.
If a channel loses many customers but a few large accounts expand, those measures can tell different stories. Inspect both before increasing the budget.
For organizing follow-up work across onboarding, renewal, and re-engagement, Stamina's customer lifecycle guide provides a useful companion framework. Move spending toward channels that meet your contribution target while recovering cash within the period your business can finance.
Calculate Your Customer Lifetime Value This Week
Start with a spreadsheet you can inspect. A small, clearly labeled model is more useful than a detailed forecast whose inputs you can't explain.
- Pull the operating inputs. Export average revenue per account and gross margin for the last 12 months as your initial working window. Keep account definitions and direct-cost categories consistent.
- Split the retention calculation. Calculate monthly customer churn by acquisition channel and plan. Keep recent and mature signup cohorts distinguishable.
- Run both estimates. Calculate margin-based and discounted LTV, recording the observation window, payment timing, and forecast assumptions beside each result.
- Check acquisition recovery. Divide pre-acquisition contribution by CAC, then calculate payback. Flag segments whose projected value depends on waiting longer than your available cash allows.
- Repeat each quarter. Compare cohorts at equivalent ages, retain previous forecasts, and check whether collected contribution is tracking toward your expectations.
Choose a repeatable reporting setup
A spreadsheet works when someone owns the definitions and updates. For teams without a dedicated analyst, Chartsy is another option: we show MRR, ARR, churn, LTV, and NRR, with an MRR breakdown calculated from your billing data, and list customers at risk.
We also credit each paying customer and their revenue to the marketing channel or campaign that brought them, so you can compare channels on MRR rather than clicks. Treat a dashboard's revenue-based LTV as a different layer from a margin-adjusted finance estimate.
Keep the segments, windows, and cost definitions visible whichever tool you use. Those choices determine how much confidence the number deserves.
Chartsy connects billing metrics with the marketing channels that bring paying customers, helping you examine LTV alongside recurring revenue and retention. Visit Chartsy to compare your acquisition channels, then use your margin and cash-recovery assumptions to decide which ones you can afford to fund.

Written by
Chartsy TeamAnalytics team at Chartsy
The Chartsy Team writes guides, product updates, and resources to help SaaS and eCommerce founders make sense of their metrics, without SQL or spreadsheets.
Chartsy