
Sales increased this month, but did recurring revenue grow? That's the question many SaaS founders face after opening Paddle and seeing a healthy stream of successful payments. An annual renewal, an upgrade, or a one-time charge can make the payment total look strong while the underlying subscription base tells a different story.
Paddle analytics is the practice of reading subscription movements, not merely counting transactions. It helps you separate new customers from returning customers, recurring revenue from one-time charges, and genuine expansion from temporary billing activity. Paddle's customer-facing material says its subscription benchmarking covers more than 40,000 SaaS subscription companies, a sign that subscription measurement has become a normal operating discipline rather than an advanced exercise (Paddle company and revenue overview).
For a broader foundation, this metrics guide for SaaS vendors is useful when you're deciding which recurring-revenue measures belong in your regular review.
This guide focuses on SaaS teams using Paddle Billing or Paddle Classic. The two products don't connect to analytics systems in exactly the same way, so keep their connection details distinct even when the business questions are similar.
Table of Contents
- Sales Went Up but Did Recurring Revenue Grow
- Payments Received Are Not the Same as MRR
- What Actually Moved MRR This Month
- Breaking Results Down by Plan Customer and Country
- What Paddle Reports Show and Where Chartsy Fits
- Joining Signups and Traffic to Paying Customers
- A Weekly Review Routine That Takes Thirty Minutes
- Getting Started and What to Verify First
Sales Went Up but Did Recurring Revenue Grow
Payments received and subscription growth are related, but they are not the same measurement. A strong Paddle payment total may include an annual renewal, a one-time charge, or an existing customer's plan change. Each event affects cash flow, yet only some events change the recurring subscription base.
A founder reviewing the month with a marketing lead may see new signups, several successful payments, and an apparently healthy sales result. The useful follow-up is more specific: which subscription movements changed MRR, and what brought those customers in? That question separates new MRR from churn, expansion from temporary billing activity, and durable acquisition from a short-lived spike.
The weekly review should connect three views: billing activity, subscription movements, and the signup or traffic sources behind them. A payment is the starting record, not the conclusion. Classify it before using it to explain recurring growth.
Practical rule: Treat every payment as a financial event first, then decide whether it belongs in recurring-revenue analysis.
Paddle was founded in 2012 and grew from a payment provider into a subscription platform. Its development reflects why careful measurement matters: billing data becomes useful for decisions only after it is organized around subscription changes. A company can process more payments without adding equivalent recurring value, just as a quiet payment week can still contain meaningful expansion or reactivation.
The metrics guide for saas vendors provides broader context for choosing recurring-revenue measures. Use that foundation alongside Paddle's native reporting, which exposes billing and subscription information. A separate analytics workflow can then join those records with signups, traffic, and acquisition sources.
Keep the product setup in view. Paddle Billing or Paddle Classic may offer different connection paths, even when the operating question remains the same: did recurring revenue grow, and which customer or acquisition movements explain the change?
Payments Received Are Not the Same as MRR
MRR, or monthly recurring revenue, is a normalized view of subscription value. It answers what the active subscription base represents in a typical month, rather than how much cash arrived on a particular day.
Take a clearly illustrative annual plan priced at $1,200. If a customer pays the full amount upfront, the payment record shows $1,200 received immediately. For monthly comparison, the subscription represents $100 of MRR, because the annual value is spread across twelve service months. The bank balance changes at once, but the recurring value is evaluated over the subscription period.
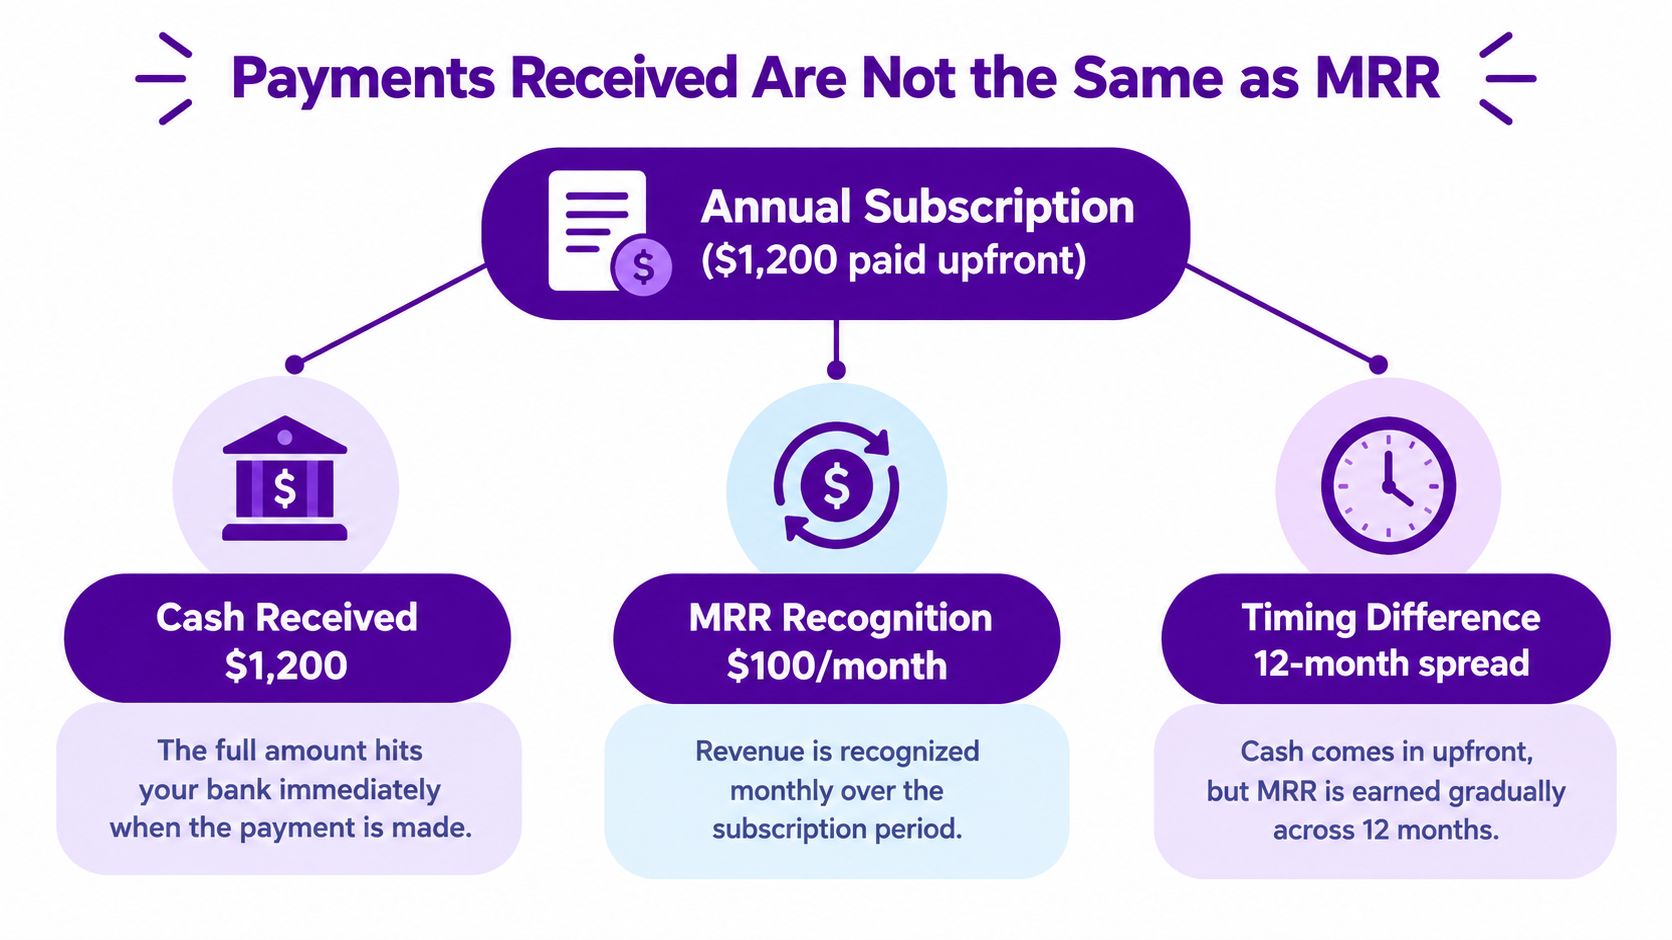
Paddle converts monthly, quarterly, and annual subscription periods into monthly values for MRR comparisons. It also treats returning customers as reactivations rather than new customers, so the timing of charges and the definition of new business shape the monthly figure (Paddle subscription metrics).
A simple classification process
Start with the subscription relationship. Ask what plan the customer has, what billing interval applies, and whether the subscription is active or scheduled to change. Then examine the transaction tied to that subscription and classify the financial event.
- Recurring subscription value: Include the normalized value of the ongoing subscription.
- One-time charge: Keep setup work, add-ons sold once, or other non-recurring items outside MRR.
- Usage or overage: Decide whether the charge represents a contractual recurring amount or variable consumption, then document the rule.
- Refund or adjustment: Preserve the event separately so the MRR view doesn't become a cash or net-receipts report without warning.
This is why MRR can fall while total payments rise. A large annual payment may increase cash received without creating an equivalent increase in monthly recurring value. Conversely, a month with modest cash collection can still contain meaningful MRR growth if several customers begin monthly subscriptions.
Paddle Billing links a subscription object to transactions that calculate and collect amounts for billing events. A reliable report therefore shouldn't count every subscription row as revenue. Join the subscription identifier to finalized transaction events, then apply your inclusion rules consistently.
What Actually Moved MRR This Month
A headline MRR change is only the result. The useful explanation comes from separating the movements that produced it:
- New MRR comes from first-time paying customers.
- Expansion MRR comes from upgrades or recurring add-ons.
- Contraction MRR comes from downgrades or reductions.
- Churned MRR comes from subscriptions that leave the paying base.
The required movement diagram uses an illustrative total of +$8,500, made up of +$5,200 in new MRR, +$1,800 in expansion, -$900 in contraction, and -$2,000 in churn. The values are a teaching example, not a benchmark or reported business result.
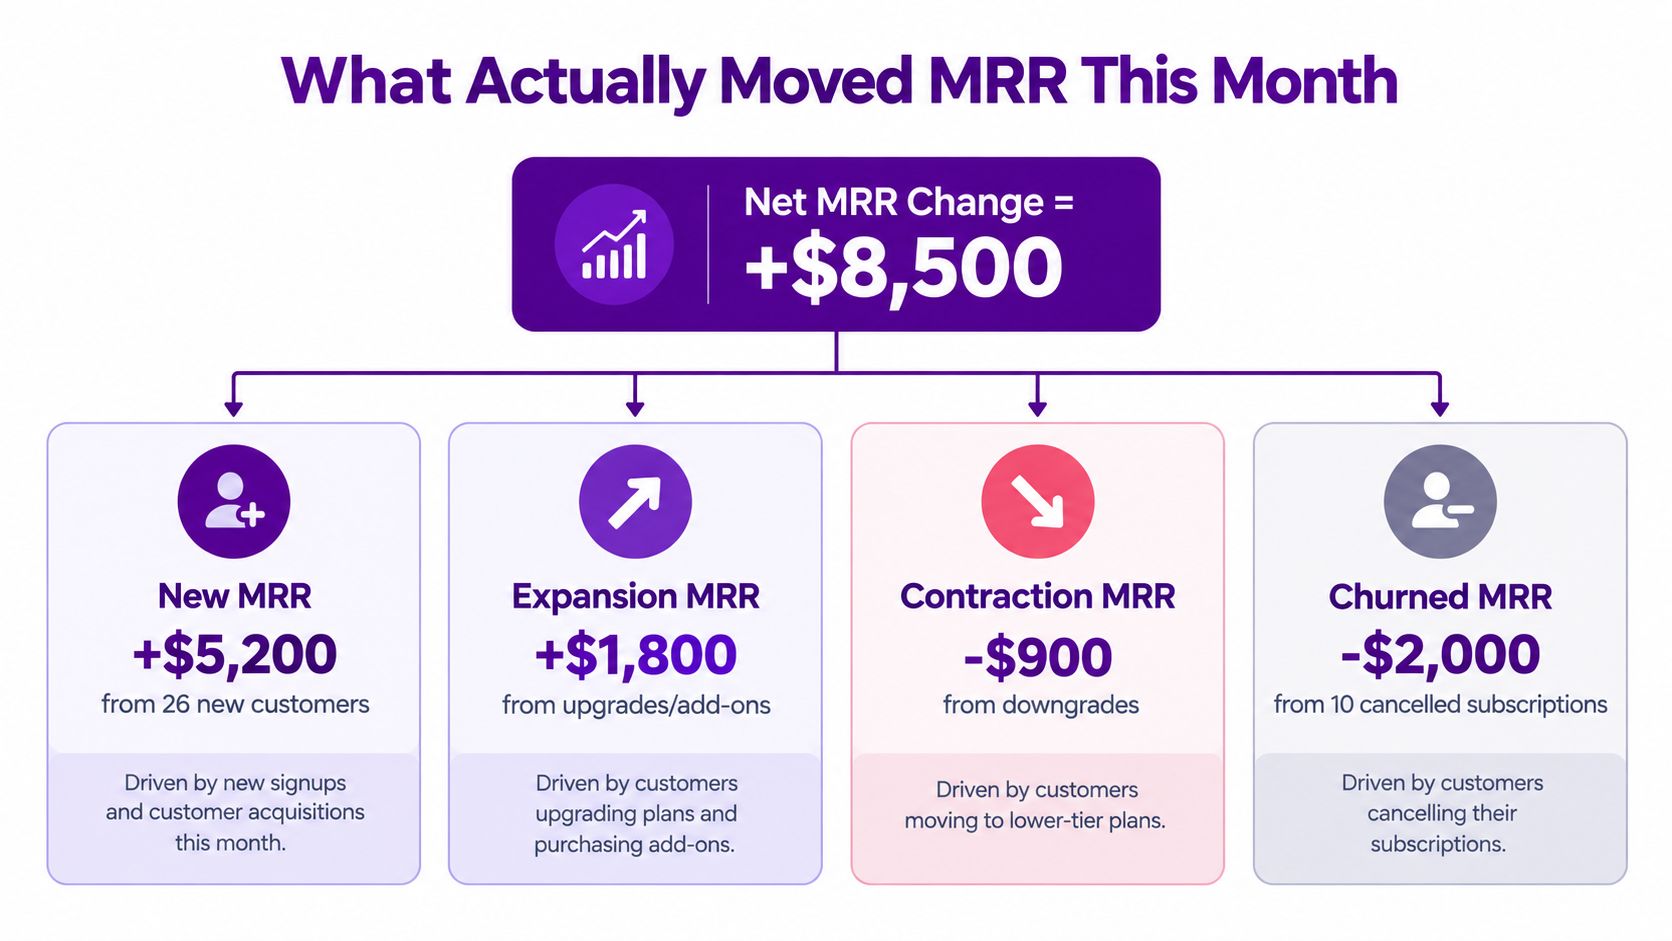
That breakdown changes the management decision. A business growing through expansion may have strong product adoption among existing customers. A business reaching the same net result mainly through new sales while losing substantial MRR to churn has a different risk profile. The total is identical, but the next action isn't.
Timing matters in Paddle
Paddle counts a customer as churned when the paid period ends, not when the customer clicks cancel (Paddle retention metrics). A customer who cancels while remaining active through the billing period is still active until that period expires. This rule prevents a scheduled cancellation from being treated as lost revenue before service access and paid coverage end.
Stripe uses its own definitions. Its MRR framework monthly-normalizes active and past-due subscriptions, excludes taxes, free plans, trials, and metered usage, and explains growth through new, reactivation, expansion, contraction, and churned MRR (Stripe subscription analytics). The movement categories are useful across providers, but the timing and inclusion rules need to be documented before you compare reports.
A weekly review should therefore ask:
- Did new MRR cover churned MRR?
- Were upgrades larger than downgrades?
- Did a plan change create immediate proration?
- Are cancellations scheduled for a later period or already expired?
- Did one-time transactions inflate the payment total without affecting MRR?
The point isn't to blame a channel or product based on one chart. It's to identify the movement that deserves investigation.
Breaking Results Down by Plan Customer and Country
Once you know which movement changed MRR, you need to locate it. A total can tell you that churn increased, but it can't tell you whether customers left one plan, one region, or a small group of accounts.
Paddle subscription reports are updated daily and show each subscription's current state. A canceled subscription appears as canceled regardless of its earlier status, and the reports can't be generated for a past date (Paddle subscription reports). That limitation makes early segmentation important. If you wait until the end of a quarter, a current-state export may no longer preserve the historical picture you needed.
| Lens | Questions it answers | When to use it |
|---|---|---|
| Plan | Which plans contributed most to MRR growth? Which plan recorded the most contraction? | Use it after a pricing, packaging, or onboarding change, or when expansion differs across tiers. |
| Customer | Which accounts expanded? How much recurring revenue did we lose to churn? Are several changes concentrated in a few customers? | Use it for retention follow-up, account reviews, and checking whether one large customer distorts the total. |
| Country | Which countries contribute the most recurring revenue? Where are cancellations or downgrades concentrated? | Use it when your SaaS sells internationally and pricing, currency, or tax treatment may affect interpretation. |
Plan analysis reveals product movement
Suppose a starter plan adds customers but loses MRR through downgrades, while a higher tier adds fewer accounts and produces most expansion. The plan count alone won't show that difference. Compare new, expansion, contraction, and churned MRR by plan, then inspect the customer records behind the movement.
Customer analysis makes retention actionable
Customer-level analysis isn't a prediction of who will cancel. It's a way to identify observed changes, such as a downgrade, an expired paid period, or a completed upgrade. A founder can then review product usage, support history, or cancellation feedback separately rather than claiming the billing data proves a reason.
Country analysis provides context
Country cuts can expose concentration that a home-market view hides. They also help you separate a subscription trend from a currency or pricing interpretation issue. Keep the currency normalization rule visible in the report, especially when comparing customers across markets.
This three-lens approach is more useful than repeatedly opening the same total. It turns “MRR is down” into a set of questions about products, accounts, and markets.
What Paddle Reports Show and Where Chartsy Fits
Paddle's native reporting is the system of record for Paddle billing activity. Paddle Billing documentation distinguishes a subscription, which represents the recurring billing relationship, from a transaction, which calculates the amount due and collects payment for a billing event (Paddle Billing subscriptions API). That distinction matters because a subscription row isn't automatically revenue, and a transaction isn't automatically recurring revenue.
Paddle provides reporting across areas such as transactions, adjustments, subscriptions, discounts, checkouts, and payout reconciliation. Its dashboard and API expose metrics including MRR and active subscribers. Those reports are useful for operational checks, but small teams often still need to connect three separate questions:
- What happened inside the subscription base?
- Which signup or traffic source is associated with the paying customer?
- What historical state explains the difference between two dates?
Native reporting and an analysis layer
Chartsy provides read-only connections for Paddle Billing and Paddle Classic. The connection details differ because the products expose billing data through different systems, so verify which Paddle product your account uses before configuring the connection. The purpose of the connection is to analyze billing data without modifying it.
Chartsy's MRR breakdown can organize movements into new revenue, upgrades, downgrades, and churn, while its plain-English analysis lets a founder ask questions without writing SQL. A saved dashboard can then keep the recurring review in one place. The workflow is additive, not a replacement for Paddle's own reports: use native billing records for transaction and payout checks, and use the analysis layer to investigate patterns across revenue and acquisition data.

A useful starting point is Chartsy's Paddle revenue attribution documentation. It describes the workflow for connecting billing activity with the acquisition context needed to understand which sources are associated with paying customers.
Chartsy doesn't modify Paddle billing data, provide predictive churn detection, or forecast future revenue. Its attribution views also shouldn't be treated as proof that a marketing source caused a signup or cancellation. They show observed relationships in the available data, which gives the team a focused place to investigate.
Joining Signups and Traffic to Paying Customers
Paddle can tell you that a customer paid and what subscription relationship is attached to the event. It usually won't answer the acquisition question by itself: which marketing source brought that customer to the product?
The useful chain is:
Website visit → signup → customer or subscription ID → completed recurring transaction → MRR movement
The stable customer or subscription ID is the join point. Retain the original acquisition source beside that identifier, then aggregate completed recurring transactions by cohort, plan, country, or channel. Paddle's webhook model includes events such as transaction.completed, subscription.created, and subscription.updated, which can support this state-reconciliation workflow (Paddle webhook documentation).

Ask a revenue question, not just a traffic question
A traffic report might show that organic search produced many visits. A signup report might show that a paid campaign generated registrations. The more useful analysis asks which of those sources are associated with completed recurring subscriptions and how much MRR those subscriptions represent.
For example, you might compare:
- Source A: many signups, limited completed recurring transactions.
- Source B: fewer signups, more customers who remain on paid subscriptions.
- Source C: customers who start on one plan and later expand.
Those observations can guide follow-up work, but they don't prove that a source caused a customer to pay. Attribution depends on tracking quality, identity matching, and the attribution model you use. Treat it as evidence for prioritization, not as an experiment result.
The workflow also works beyond native billing connections when you can send equivalent dated events. Chartsy's Custom API can bring in data from a custom billing system or another provider, but that requires actively sending normalized data to Chartsy. It isn't an automatic connection to every payment platform. For a practical implementation pattern, see signup to paid conversion tracking.
A Weekly Review Routine That Takes Thirty Minutes
A monthly revenue review is useful, but a short weekly check catches changes while the account history and customer context are still fresh. The routine below is designed for a founder or operations lead who needs a reliable view without maintaining a large spreadsheet.
First, read the movement summary
Open the MRR movement view and compare new, expansion, contraction, and churned MRR. Ask two direct questions: Did new MRR exceed churned MRR? And which movement explains most of the change?
Don't stop at the net number. A positive total can hide heavy churn, while a flat total can contain meaningful upgrades that were offset by cancellations.
Next, inspect the three useful cuts
Review the plan breakdown first. Ask, “Which plans contributed most to MRR growth?” Then check customer-level changes and ask, “How much recurring revenue did we lose to churn this week?” Finally, glance at country mix for concentration or unexpected movement.
If time is limited, skip detailed traffic exploration and start with the largest MRR movement. A single customer, plan, or country may explain enough of the total to determine the next investigation.
Finish with the plain-English summary
Read the AI-generated analysis for unusual changes, then verify important conclusions against the underlying Paddle records. The summary can help you formulate questions, but it shouldn't turn an observed correlation into a proven cause.
Keep the routine repeatable: The value comes from asking the same core questions each week and recording what needs follow-up.
By the end of the review, write down one or two actions. Examples include checking a downgrade with customer success, reviewing a plan change, validating a source identifier, or reconciling a transaction classification. Small teams don't need more dashboards for their own sake. They need a short loop that turns subscription movements into decisions.
Getting Started and What to Verify First
Start with the read-only Chartsy Paddle workflow and identify whether your business uses Paddle Billing or Paddle Classic. The Paddle data source documentation can help you confirm the connection path before you build a recurring report.
Before trusting the weekly view, verify the definitions that affect every result:
- Trials are excluded: Confirm that trial subscriptions aren't being treated as active paid MRR.
- One-time charges stay separate: Check that setup fees, one-off purchases, and other non-recurring events aren't included in recurring revenue.
- Currency treatment is consistent: Make sure comparisons across plans and countries use a documented normalization rule.
- Billing objects are joined correctly: Match subscription relationships to transaction events rather than counting subscription rows as revenue.
- Historical changes are preserved: Record effective dates for plan changes, pauses, refunds, chargebacks, and cancellations where your workflow supports them.
If you're reviewing pricing options for an adjacent SaaS experiment, a practical resource such as compare Otter A/B plans can help you keep plan definitions explicit before comparing performance.
Paddle analytics can show what changed, when it changed, and which available dimensions are associated with the movement. It can't prove why a customer canceled or establish that a marketing channel caused a conversion without supporting evidence. Use the numbers to choose the next investigation, then validate the explanation with product, customer, and campaign context.
Chartsy connects Paddle Billing and Paddle Classic data with signup and traffic information so small SaaS teams can review MRR, churn, plan movements, and attributed paying customers in one workflow. Set up the read-only connection, verify your revenue rules, and visit Chartsy to turn the next weekly Paddle review into a repeatable investigation.

Written by
Chartsy TeamAnalytics team at Chartsy
The Chartsy Team writes guides, product updates, and resources to help SaaS and eCommerce founders make sense of their metrics, without SQL or spreadsheets.
Chartsy
