
MRR by acquisition source means you credit the first month of recurring revenue to the original channel that created the customer, then compare that channel's contribution against spend, churn, and expansion over time. In a 2026 benchmark set covering 3,700+ tracked startups, the median MRR was $145, the 75th percentile was $894, and the mean was $4,298, which is about 30 times the median Big Ideas DB benchmark set.
When two channels produce the same signup count, why does one build durable revenue while the other fills your dashboard with low-value noise? That is the central question behind mrr by acquisition source, and it is the one most SaaS teams avoid until their growth numbers stop matching their bank balance.
Table of Contents
- Understanding the Core Problem with Source Attribution
- Building Your Data Foundation for Accurate Tracking
- Choosing the Right Attribution Model for Your Business
- Implementing Attribution with Chartsy for SaaS Teams
- Interpreting Results and Avoiding Common Mistakes
- Troubleshooting Attribution Gaps and Data Issues
Understanding the Core Problem with Source Attribution
Which acquisition source produces MRR that remains after the first payment, expands over time, and survives cancellation pressure? That question matters more than the original signup count. A channel can look strong in traffic reports while producing weak subscription revenue if the customers it brings in cancel quickly.
MRR by acquisition source works best as a lifecycle cohort question. The original source can receive credit for the first month of recurring revenue, while the same customer later produces expansion MRR, contraction MRR, or churned MRR. Those later movements belong in the source-level view when the goal is to understand a channel's net revenue contribution Cometly's explanation of MRR by acquisition channel.
Compare retained revenue, not signup volume
Traffic volume and revenue output describe different business events. Comparing them directly can push budget toward channels that generate attention without creating durable customers.
Practical rule: rank channels by the revenue they create and retain, not by the number of people who raised their hand.
A source that brings in fewer customers can still outperform a louder channel when those customers upgrade more often, churn less, or stay active longer. This comparison also exposes a common attribution error: treating every later revenue movement as new acquisition. Separate durable acquisition revenue from expansion and contraction after the initial conversion, then evaluate how each cohort develops.
The trade-off is attribution clarity versus operational simplicity. A single first-touch source is easy to report, but it cannot explain why two channels with similar signup counts produce different retention or expansion outcomes. A lifecycle view requires source continuity across billing events, yet it gives finance and marketing a shared basis for deciding which acquisition revenue deserves continued investment.
Why source-level MRR gets messy
Smaller SaaS teams often reduce attribution to a source field on the signup form. That field helps identify where a customer started, but it does not answer whether the resulting relationship continued generating MRR.
The original source must remain attached to later lifecycle events. Otherwise, expansion appears to be fresh acquisition, churn loses its connection to the channel that brought in the customer, and reports reward the wrong behavior. A shared framework for separating these events is available in Chartsy's attribution concepts. The aim is a cohort view that distinguishes acquisition revenue from what happens after acquisition.
Building Your Data Foundation for Accurate Tracking
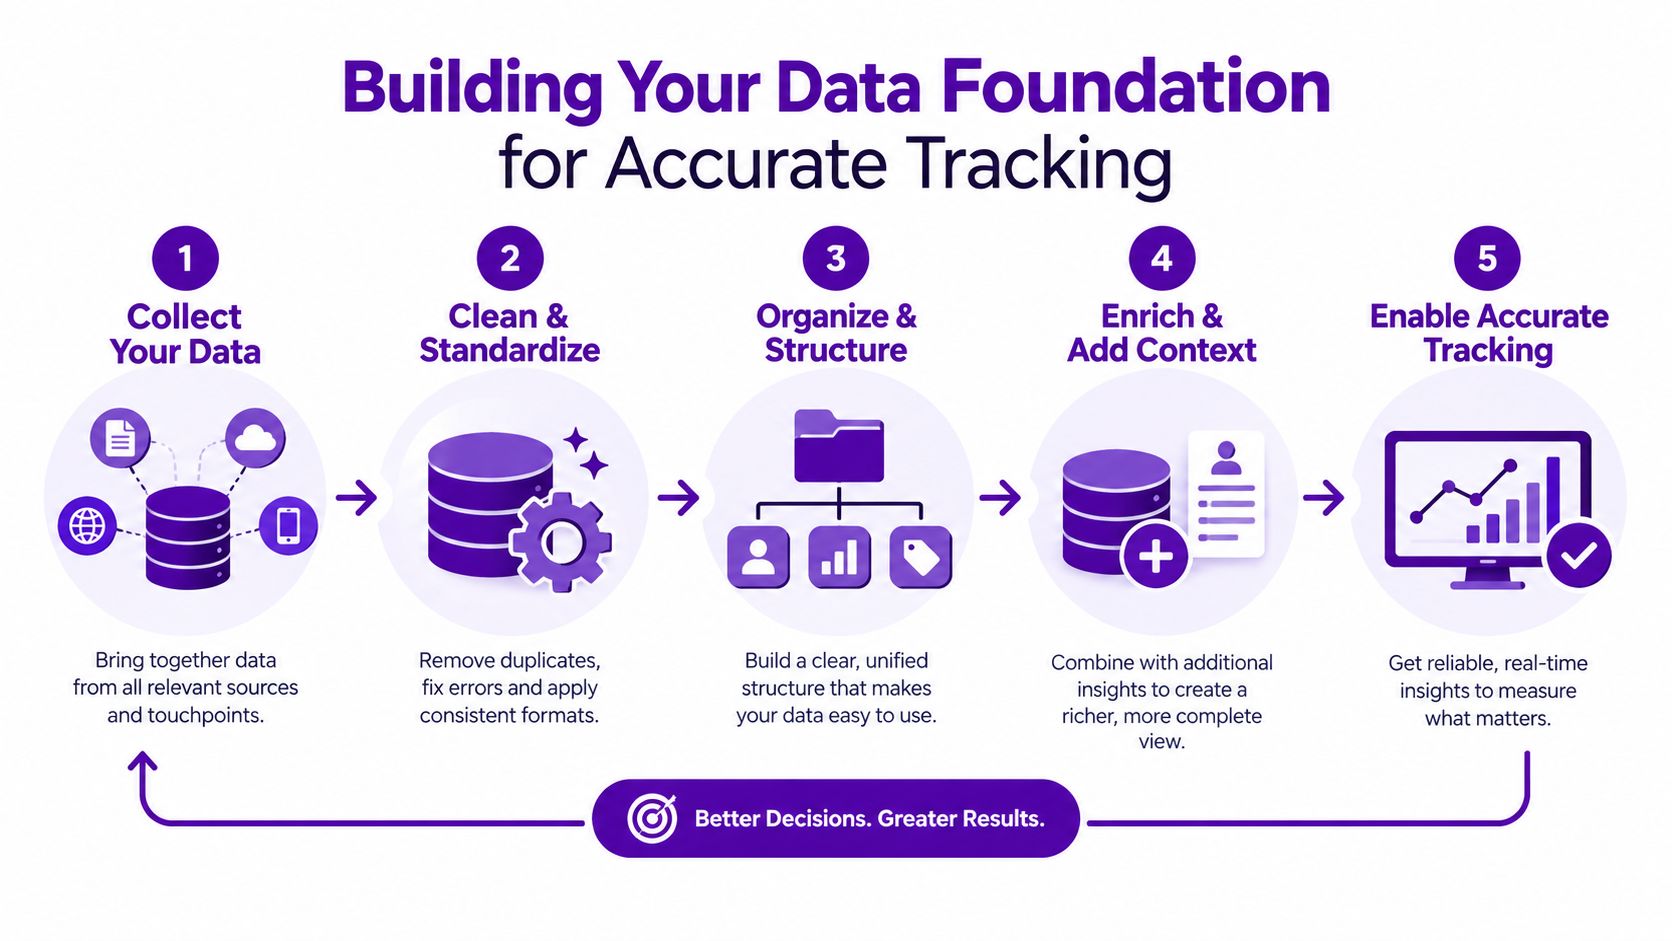
You can't trust source-level MRR if the underlying identity chain is broken. The practical setup starts at first visit, not at checkout, because the original source is easiest to lose once people bounce between devices, sessions, and billing flows.
The cleanest pattern is to capture UTM parameters, referrer data, and click IDs on the first touch, persist them through signup with a durable visitor or user identifier, and then join them to billing records server-side. The billing system has to stay the canonical source for paid status and MRR, while acquisition metadata acts as the attribution layer AdMaxxer on SaaS marketing attribution and MRR by channel.
What to store and where to store it
Start with the source data that survives contact with real users.
- First-touch source fields: Save the original UTM values, referrer, and click IDs as soon as the visitor lands.
- Durable identity: Carry those values through signup with one visitor or user identifier, not a brittle session-only tag.
- Billing join: Match that acquisition record to Stripe or Paddle billing events on the server side.
- Revenue truth: Let billing decide what counts as paid status and MRR.
- Lifecycle events: Track signups, trial starts, trial-to-paid conversion, and new MRR by source in one reporting layer.
A setup like this gives you a cohort-style workflow instead of a broken traffic report. You can see which source brought a signup, which source brought a payer, and which source brought recurring revenue that behaved well after conversion.
Why the billing system has to win
Marketing tools are useful, but they're not the source of truth for revenue. If ad-platform data and billing data disagree, billing should win every time. Otherwise you end up giving credit to clicks that never became revenue or missing renewals that the ad platform can't see.
For teams building that plumbing, Chartsy's UTM tracking guide for SaaS is a sensible reference point because it sits closer to the actual workflow than generic marketing advice. The important part isn't the tool itself, it's the discipline of keeping acquisition metadata separate from billing truth.
Choosing the Right Attribution Model for Your Business
First-touch attribution is simple, and that's why many SaaS teams use it. It gives all credit to the channel that created the customer, which works when your main question is, “Where do paying customers enter the funnel?”
The weakness is obvious once a customer journey gets longer. If someone discovers your product through content, comes back through community, then pays after a late-stage search click, the “source” label can hide the path that converted the buyer. The result is that upper-funnel channels can look too strong while late-stage demand capture looks too weak.
First-touch versus lifecycle cohort thinking
First-touch is useful, but it's not enough if you care about retained revenue. A lifecycle cohort view asks a more useful question for subscription businesses, which is how that source behaved after acquisition.
The useful question isn't which source won the click, it's which source produced durable subscription revenue.
That framing helps you separate new-business MRR from the rest of the revenue story. Expansion, contraction, and churn are still important, but they belong in lifecycle analysis, not in a clean claim about what acquisition channel created initial recurring value. The same customer can move through all of those states, and the source context should travel with them.
Why a single “best channel” number usually misleads
A single channel ranking hides maturation windows. One source may look weak in month one and better by month three because the buyers it attracts need more time to convert or expand. Another may produce fast signups but poor retained MRR because the plan mix is weak or the buyers are low intent.
That's why the more decision-useful view is cohort-based retained MRR, not a blunt headline metric. The goal isn't to crown one channel forever. It's to understand which sources create customers who keep paying, which ones expand, and which ones disappear after the first invoice WooCommerce documentation on subscription analytics attribution.
Implementing Attribution with Chartsy for SaaS Teams
For small SaaS teams, the easiest way to get from source data to revenue answers is to connect acquisition and billing in one place and keep the workflow simple. Chartsy is one option for that, since it connects website traffic and signups to subscription data from Stripe, Paddle Billing, and Paddle Classic, then lets you ask questions in plain English and turn them into charts and tables. The value isn't magic, it's reducing the manual work of stitching traffic and billing together.
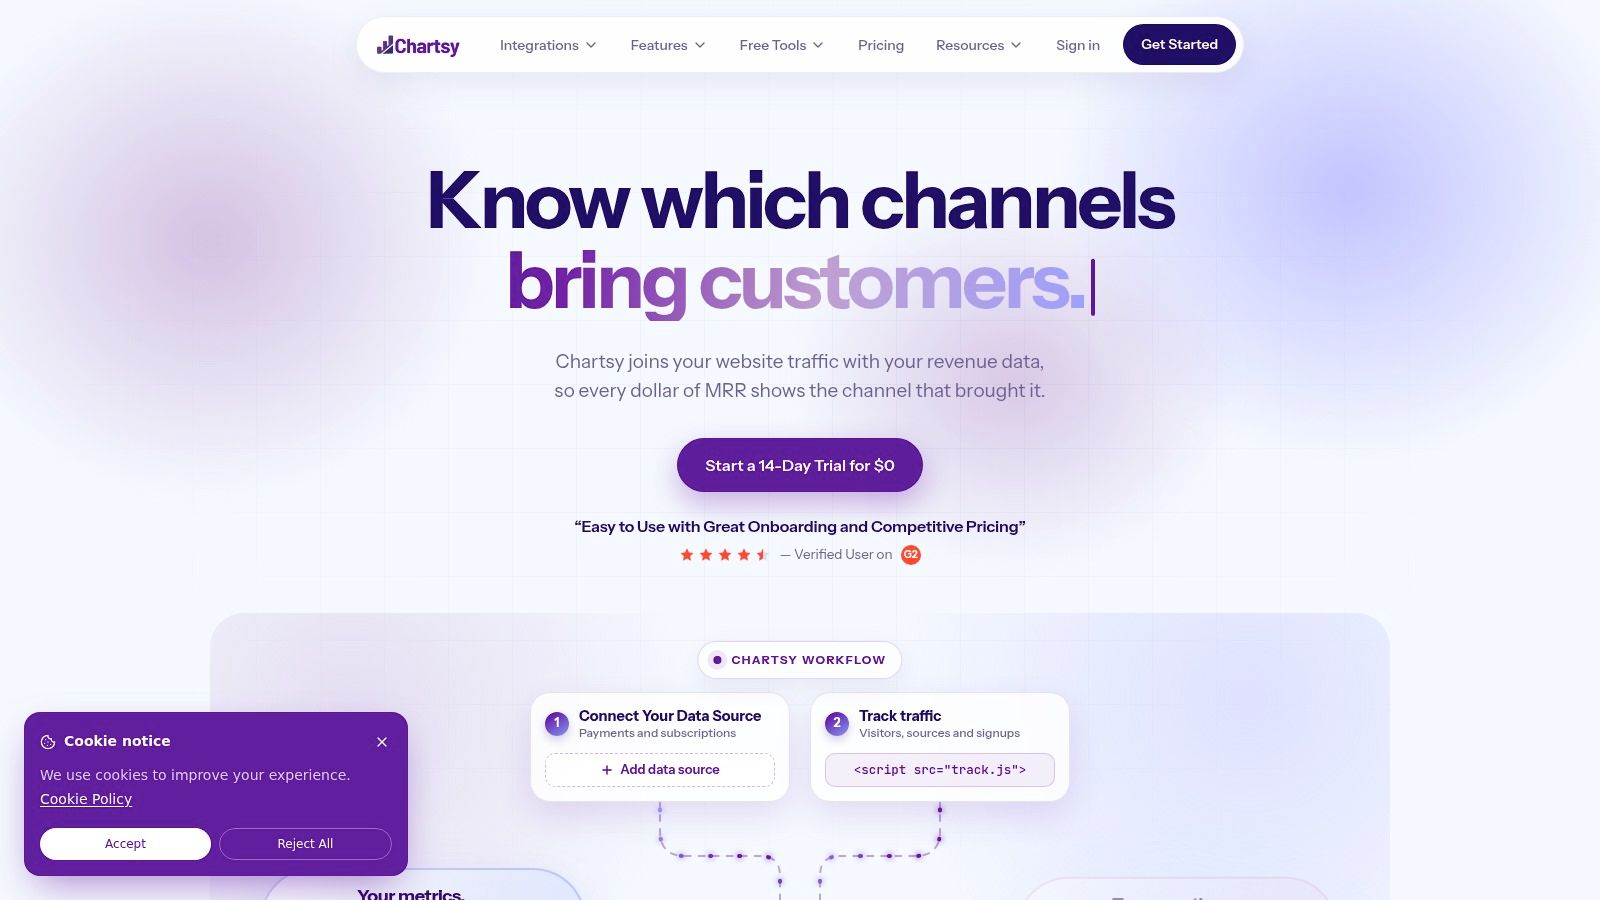
The practical setup starts with a read-only billing connection, then source tracking, then a dashboard that shows how acquisition affects revenue over time. If you're using Chartsy's revenue views, the relevant place to start is its MRR breakdown feature, because that's where new revenue, expansion, contraction, and churn become visible in one place.
A workable dashboard for a small team
A founder or ops lead doesn't need a warehouse project to answer the basic questions. They need a view that combines source-level revenue with spend and movement.
- New MRR by source: See which channels brought in first-time recurring revenue.
- Expansion MRR: Separate upgrade-driven revenue from acquisition.
- Contraction and churn: Track what the original source lost later.
- Spend context: Compare revenue contribution against budget, not just traffic.
- Plain-English analysis: Ask a question and get a readable summary instead of SQL output.
That setup helps when you don't have a dedicated analyst. It also makes it easier to spot when a source creates customers who keep paying versus customers who only inflate the top of funnel.
Why this workflow is better than spreadsheet glue
Spreadsheets can approximate the answer, but they break down once billing events multiply. One export for traffic, another for subscriptions, another for spend, then a pile of joins that only one person understands. That's fine for a one-off investigation, but it gets painful fast if you need the report every week.
A tool like Chartsy is a fit when you want a focused SaaS reporting layer, not a broad data engineering project. It's useful when the question is, “Which sources bring paying customers and how do they behave after they pay?” That's the exact workflow source-level MRR is supposed to support.
Interpreting Results and Avoiding Common Mistakes
A source-level report is only useful if you read it carefully. The cleanest benchmark is to compare paid conversions, new MRR, and spend inside a fixed attribution window, then watch revenue yield rather than lead count alone. One common practice is a 30-day window before subscription creation, which helps line up source data with the subscription event Improvado on Chargebee analytics.
That benchmark works because conversion volume and revenue quality are not the same thing. A source can produce plenty of paid customers and still underperform if those customers land on low-value plans, churn quickly, or never expand.
The five misreads that waste budget
- Counting signups as success: More signups don't mean more retained MRR.
- Treating attribution as causation: Source credit shows association, not proof of why a customer stayed or churned.
- Ignoring plan mix: Two channels can produce the same number of customers and very different MRR outcomes.
- Over-crediting retargeting: Last-touch logic often makes closing channels look stronger than they are.
- Skipping spend context: A source with decent revenue can still be inefficient if the cost base is high.
Watch the revenue shape, not just the credit assignment. A channel that looks good in the conversion report can still be poor in the MRR report.
The practical response is to compare source performance after conversion, not just at the signup line. If one channel consistently yields lower retained revenue, the issue may be customer intent, plan fit, or the type of problem that channel attracts. Attribution won't tell you the root cause by itself, but it will tell you where to look.
Troubleshooting Attribution Gaps and Data Issues
The first thing that breaks is usually last-touch logic. It tends to over-credit branded search and retargeting, while understating the sources that introduced the customer earlier in the journey. If your reports suddenly make late-stage traffic look like the hero, check whether you've lost the original source before signup.
The fix is usually straightforward. Preserve the first-touch source through signup, keep acquisition metadata separate from billing truth, and reconcile source labels against the billing records that define MRR.
Three failures to check first
-
Source got overwritten during signup.
The symptom is every customer looking like they came from the same campaign or the same final click. The correction is to persist the original source in a durable user record, not only in a landing-page session. -
Billing and acquisition data don't match.
The symptom is a dashboard that shows signups but can't explain revenue. The correction is to join against billing records server-side and use billing as the canonical source for paid status. -
Journeys change after the first visit.
The symptom is a source that disappears when users come back later from a different device or path. The correction is to treat the source label as a lifecycle cohort field, not a one-time traffic label.
Privacy changes and browser behavior make this harder, not easier. That's why the best maintenance habit is to test joins regularly, review missing-source rates, and compare source-level reports against the billing system before you trust the numbers. When the data layer is healthy, MRR by acquisition source becomes a decision tool instead of a reporting artifact.
If you want a practical way to connect acquisition source, billing, and MRR movement without building the whole stack yourself, visit Chartsy and check how it handles source-level revenue breakdowns for Stripe and Paddle. It's a good fit when you need plain-English analysis of which channels bring paying customers and how those customers affect recurring revenue, churn, and expansion.

Written by
Chartsy TeamAnalytics team at Chartsy
The Chartsy Team writes guides, product updates, and resources to help SaaS and eCommerce founders make sense of their metrics, without SQL or spreadsheets.
Chartsy
