
B2B SaaS attribution is the process of linking your marketing interactions to actual subscription revenue, not just signups, so you know which channels bring paying customers. A 2026 industry summary found that 47% of B2B teams had adopted multi-touch attribution, while 67% still relied on last-touch attribution (SaaS Hero).
You can see the problem in a familiar dashboard. Website traffic is rising, trial signups look healthy, and paid campaigns are generating leads. Then you open Stripe or Paddle and discover that recurring revenue hasn't grown at the same pace. The issue usually isn't a lack of data. It's that your marketing data and subscription data live in separate places.
A signup tells you that someone showed interest. It doesn't tell you whether they paid, remained subscribed, upgraded, downgraded, or canceled. Revenue-first attribution connects those events so you can judge acquisition by paying customers, MRR, and retention, not activity alone.
Table of Contents
- Why Your Marketing Looks Good But Your Revenue Doesn't
- Understanding the Core Attribution Models
- The Problem With Last-Touch in Long Sales Cycles
- How to Start with Basic Attribution Tracking
- Connecting Signups to Subscription Revenue
- Using Chartsy to Simplify Revenue Attribution
- Moving Forward With a Revenue-First Mindset
Why Your Marketing Looks Good But Your Revenue Doesn't
A founder reviews the monthly dashboard on a Monday morning. Organic traffic is up, a new guide is attracting visitors, and a paid campaign delivered a large number of trial registrations. The marketing report calls the month successful.
The billing report tells a different story. New subscriptions are modest, several customers have canceled, and the channel with the most signups has produced little recurring revenue. The founder now has to answer an uncomfortable question: did marketing create demand, or did it create activity?

Signups are an intermediate event
A signup matters, but it's only one step in a SaaS journey. A source can generate many registrations and still attract people who never activate, never start a paid subscription, or cancel soon after conversion. Another source may produce fewer signups while bringing customers who contribute more stable recurring revenue.
That distinction changes the questions you ask:
- Acquisition quality: Which sources bring paying customers rather than registrations?
- Revenue contribution: Which original sources are associated with current subscription revenue?
- Retention signals: Which sources appear alongside customers who remain active, expand, contract, or churn?
- Budget decisions: Which campaigns deserve more investigation, and which only look efficient because they generate cheap leads?
Last-touch reporting often hides these differences. It assigns the conversion to the final interaction, even when earlier search content, product education, or referral activity helped create the decision. B2B SaaS attribution has been moving toward multi-touch models, but adoption remains incomplete, which leaves many small teams making budget decisions from partial evidence (SaaS Hero).
Practical rule: Treat a signup as a milestone, not the business outcome. The outcome is subscription revenue that persists.
The right system doesn't claim that a source caused a purchase just because it appeared in the customer history. Attribution shows the relationship between tracked interactions and revenue events. You still need judgment, clean data, and controlled experiments before making a causal claim.
Understanding the Core Attribution Models
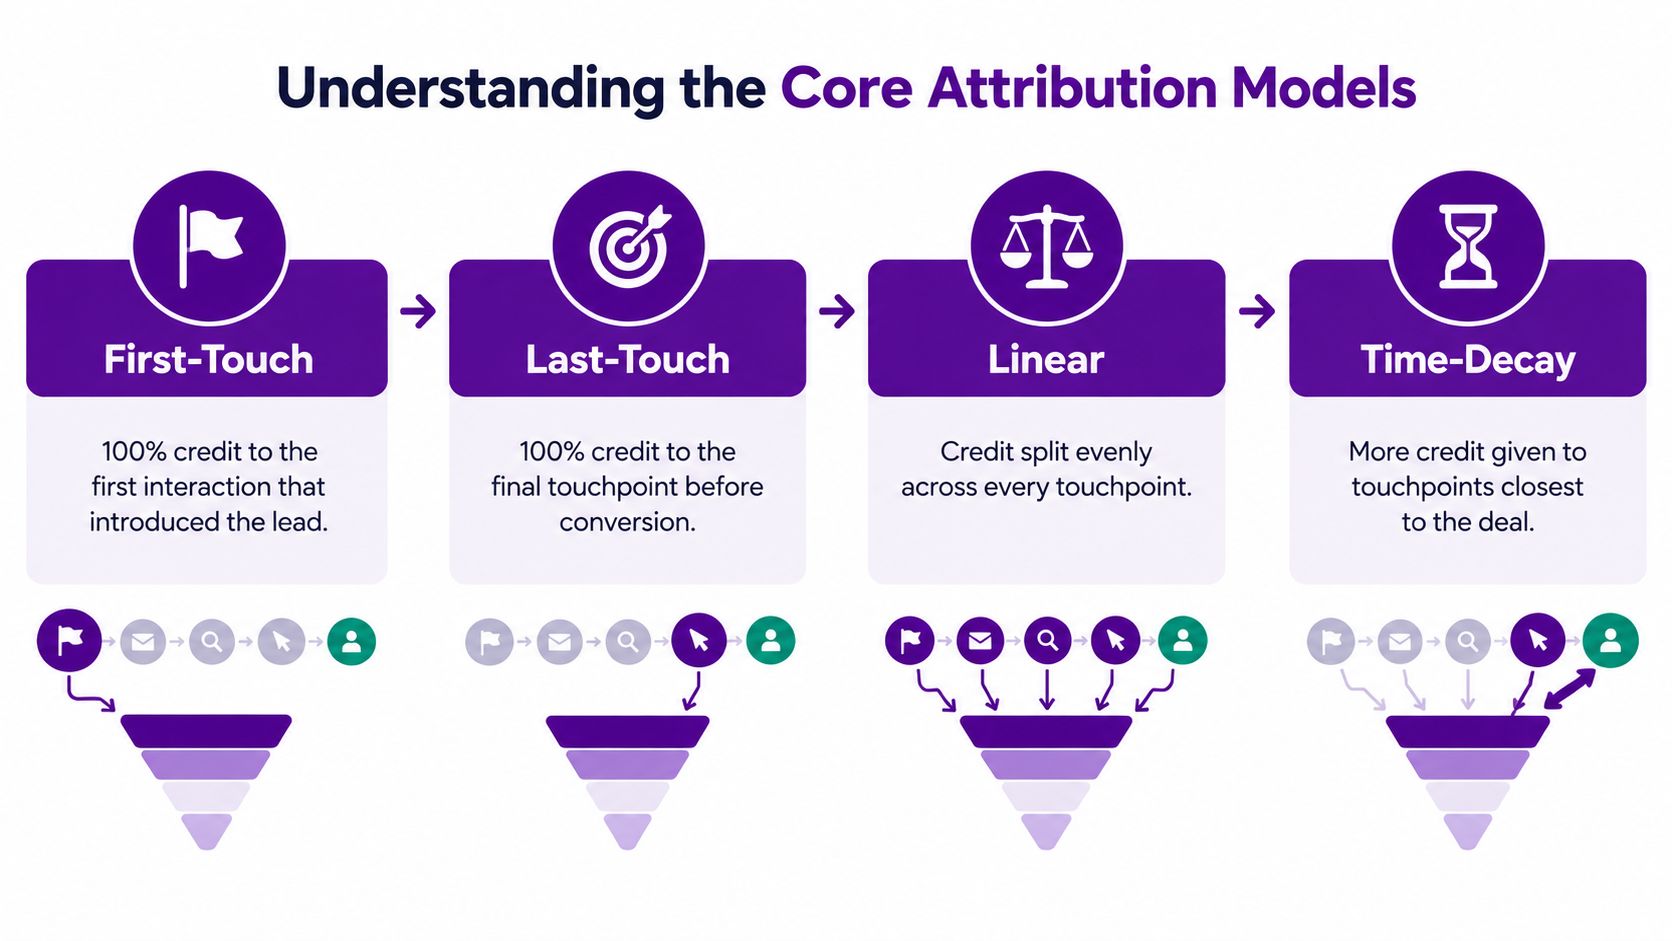
Attribution models answer one narrow question: how should credit be distributed across the interactions connected to a conversion? The model you choose can change which channel appears successful, even when the underlying customer journey stays the same.
Four common approaches
| Model | How credit is assigned | Useful for | Common weakness |
|---|---|---|---|
| First-touch | All credit goes to the first recorded interaction | Understanding which sources introduce prospects | Ignores the work that turns interest into a subscription |
| Last-touch | All credit goes to the final interaction before conversion | Measuring the immediate conversion path | Over-credits branded search, direct visits, or retargeting |
| Linear | Credit is split evenly across recorded interactions | Showing that several touches contributed | Treats a minor page visit like a decisive sales interaction |
| Time-decay | Later interactions receive more credit | Journeys where recent touches matter more | Can still undervalue early education and demand creation |
A first-touch model might credit an SEO article that introduced a visitor months before signup. That's helpful when you're evaluating demand creation, but it won't show whether a product demo, email sequence, or sales conversation helped close the account.
Last-touch has the opposite bias. Suppose a prospect first finds your comparison guide, returns through a webinar, speaks with sales, and later clicks a retargeting ad before subscribing. Last-touch may give the ad all the credit, although the ad was only the final recorded step.
Linear attribution avoids that extreme by sharing credit. Its weakness is false equivalence. Five passive page views shouldn't necessarily receive the same weight as a completed demo or a meaningful sales interaction.
Time-decay adds a useful recency assumption, but it remains a rule rather than proof. If the buyer needed early product education to understand the category, placing most credit near the final conversion can still distort your investment decisions.
The Chartsy attribution concepts documentation provides a useful reference for thinking about these models. For a small SaaS team, the best starting point is often to compare more than one model and look for patterns. If a source appears valuable only under one rule, treat that result as a prompt for investigation, not a final verdict.
The Problem With Last-Touch in Long Sales Cycles
Last-touch is popular because it's easy to explain. A customer subscribed after visiting a pricing page from branded search, so branded search gets the credit. The report is clean, but the customer may have discovered the company through content, community discussions, or a referral long before that final visit.
B2B SaaS journeys make this problem more serious. One 2026 benchmark summary reported an average closed-deal path of 211 days, 76 tracked touchpoints, 6.8 stakeholders, and 3.7 channels (Digital Applied). A final click cannot represent that entire path.
Assisted interactions still matter
A content channel may rarely appear immediately before a subscription. That doesn't mean it has no commercial value. Educational content can help a buyer recognize a problem, give an internal champion material to share, or help another stakeholder enter the evaluation later.
The same applies to channels that don't carry obvious conversion labels. A prospect may hear about a product in a peer community, search for it later, read several pages, and eventually type the brand name directly. The direct visit is visible. The original influence often isn't.
A useful report separates at least three views:
- Sourced revenue: Revenue associated with the first known source.
- Influenced revenue: Revenue connected to any meaningful tracked interaction.
- Final-touch revenue: Revenue associated with the last recorded interaction.
These aren't interchangeable metrics. Sourced revenue helps evaluate demand creation, final-touch revenue helps evaluate conversion activity, and influenced revenue shows the broader path. None proves that a channel caused the purchase.
Dark-funnel measurement makes the gap wider. Recent industry commentary estimates that 50% to 70% of the buying journey can happen off-platform, and another source says 30% to 40% of high-LTV SaaS traffic may be mislabeled as Direct (GrowthSpree). Those figures should make you cautious about declaring a channel ineffective because it doesn't receive a final click.
How to Start with Basic Attribution Tracking
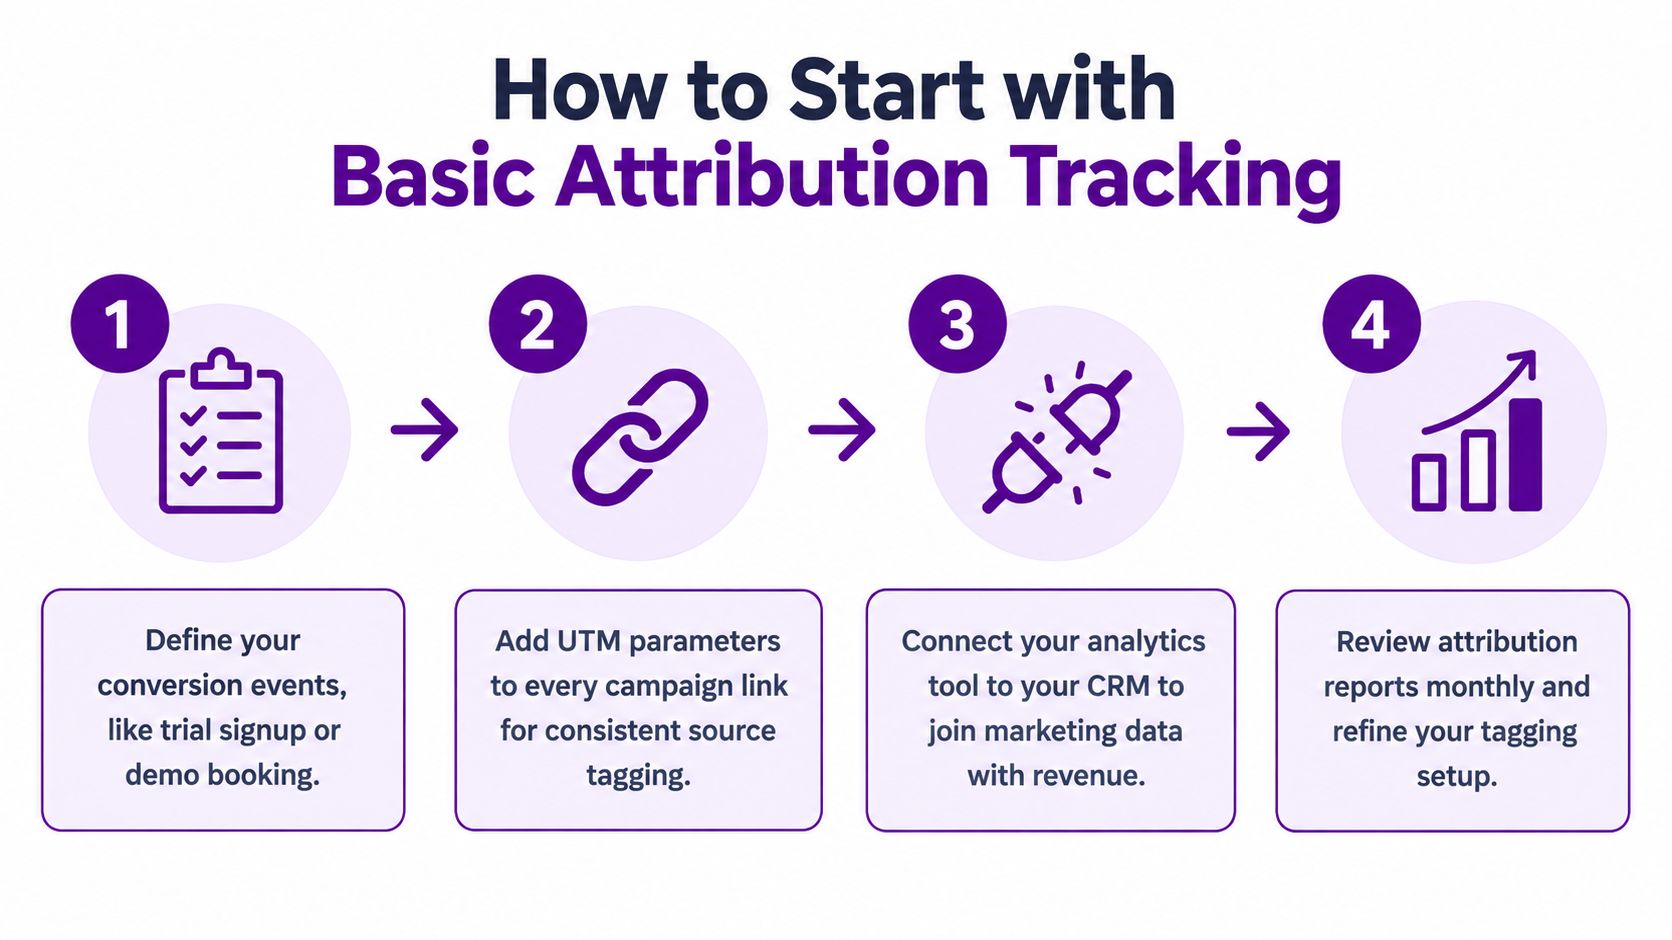
You don't need a warehouse or a dedicated analyst to improve your first attribution report. You need consistent source data, clearly defined conversion events, and a reliable way to connect the signup record to the customer record.
Start with the fields you can control
-
Define the conversion event. Decide whether your primary event is a trial signup, product activation, paid subscription, or demo booking. Keep the event name stable so reports remain comparable.
-
Standardize UTM parameters. Use consistent values for source, medium, and campaign. A LinkedIn campaign shouldn't appear under several spellings because different people created links independently.
-
Persist the source through signup. Store the original source and campaign with the user or account record. If the visitor returns later, preserve the first known source while also recording later interactions when your system supports them.
-
Match the signup to the outcome. Connect the signup record to the CRM opportunity or billing customer. A source that ends at a form submission isn't revenue attribution yet.
The SaaS UTM tracking guide for founders is useful when you're creating naming rules for campaigns, emails, and social posts. The important part isn't collecting every possible parameter. It's making sure the values mean the same thing across the tools you already use.
Create a small operating rhythm
Review the report regularly, but don't rebuild the model every time a result surprises you. First check whether the source was tagged correctly, whether the customer match is valid, and whether the billing event was recorded against the right account.
A practical monthly review can include:
- Source coverage: How many signups have a known source?
- Customer matching: How many paying customers can be connected to a signup?
- Revenue view: Which sources are associated with current recurring revenue?
- Movement view: Did MRR change because of new subscriptions, upgrades, downgrades, or cancellations?
- Data exceptions: Which records need manual review?
Start with a spreadsheet if that's what you can maintain. A simple, trusted report is more useful than an elaborate model nobody checks. Once the workflow becomes repetitive, automation can reduce manual joins and make the review easier to sustain.
Connecting Signups to Subscription Revenue
The valuable join isn't visitor to signup. It's source to signup to paying customer to recurring revenue. That join lets you ask whether a campaign produced customers who still contribute revenue, rather than stopping at the point where someone created an account.
For Stripe, MRR is the monthly-normalized value of active and past_due subscriptions. It excludes taxes, free plans, and metered usage-based products (Chartsy's Stripe MRR guide). Your reporting should document this definition before comparing sources, because a different revenue definition can produce a different answer.
Build the revenue view
Assume a hypothetical SaaS team has customers whose original signup sources are stored consistently. The team can group current subscription revenue by that original source, then compare it with customer movements during the reporting period.
The MRR movement should be separated into:
- New MRR: Revenue from first-time customers.
- Expansion MRR: Additional recurring revenue from upsells or add-ons.
- Contraction MRR: Revenue lost through downgrades.
- Churned MRR: Recurring revenue lost when customers cancel.
These categories explain the change rather than treating MRR as one unexplained total. Industry definitions use the same distinctions for SaaS revenue reporting (Tabs). Net MRR churn accounts for expansion when measuring revenue lost from existing customers, and a negative result means expansion exceeds churn and contraction (Geckoboard).
Paddle describes net revenue retention in a similar revenue-quality framework. It excludes new customers and combines starting recurring revenue with expansion, then subtracts revenue churn and contraction before dividing by the starting amount (Paddle).
Avoid false precision
A source can be associated with a customer who later upgrades, but that doesn't prove the campaign created the expansion. Likewise, a customer can churn after arriving through a channel without that source being the reason for cancellation.
Use attribution to identify patterns worth examining. Then check onboarding, product usage, pricing, support interactions, and customer feedback before deciding what changed.
This is also where LTV to CAC and payback become more useful than signup volume. You want to compare acquisition cost with the recurring revenue and retention behavior associated with customers, but only after you agree on the revenue window, cost definition, and customer matching rules. The signup-to-MRR conversion workflow gives small teams a practical structure for making that connection.
Using Chartsy to Simplify Revenue Attribution
Manual attribution usually fails for a predictable reason. The founder can connect a few records once, but maintaining website sources, signup events, billing customers, and MRR movements every month becomes another operational task.
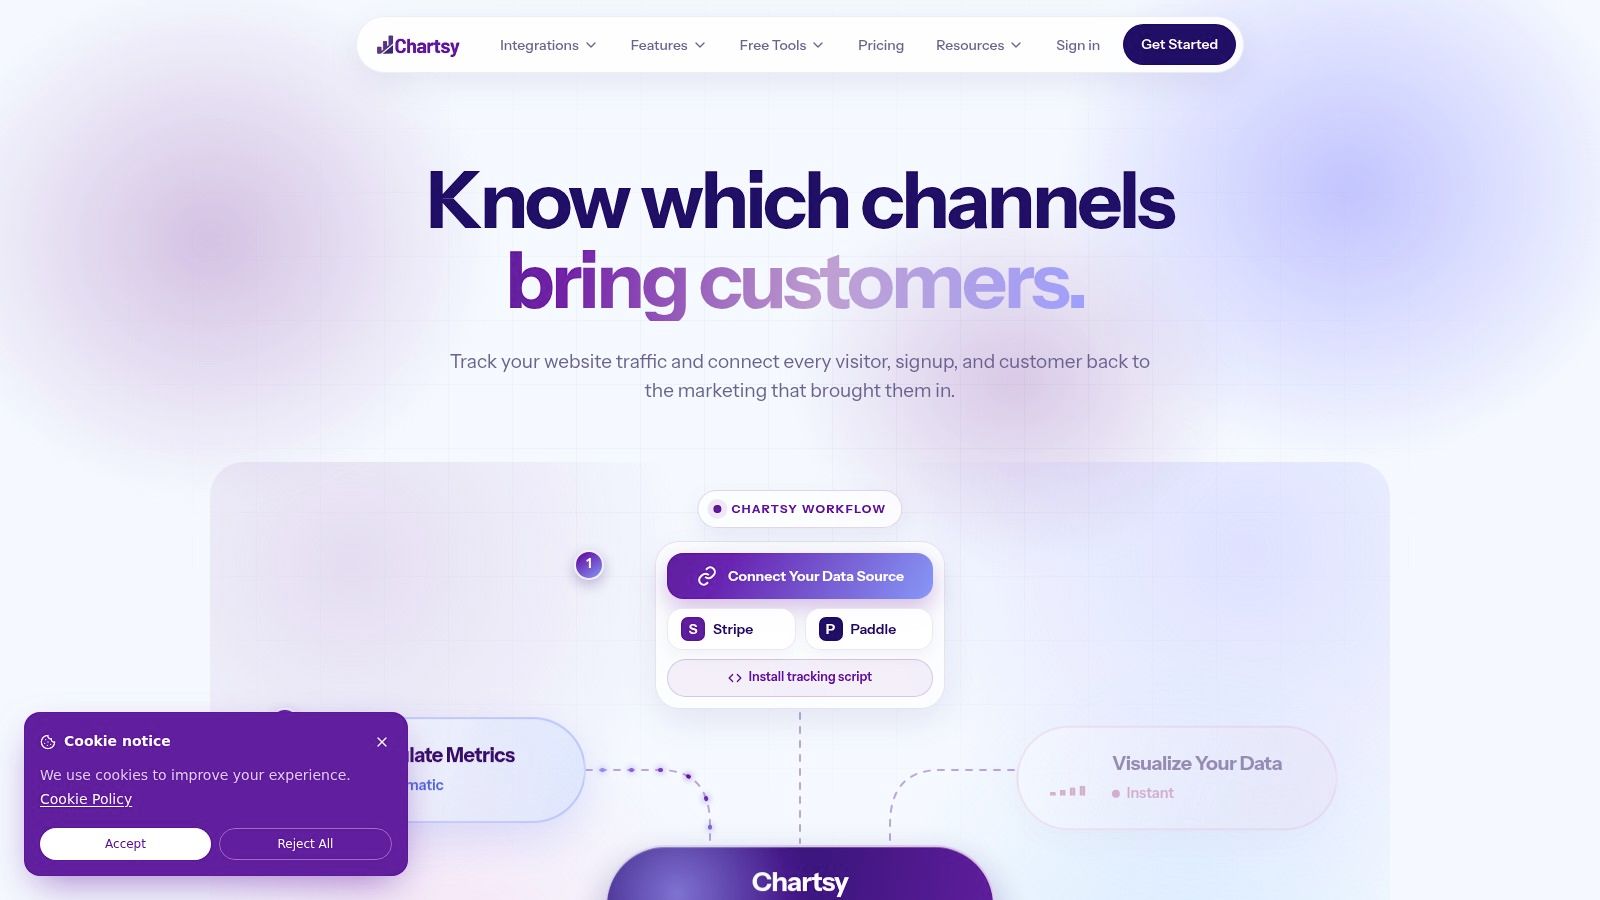
Chartsy is designed for SaaS founders and small marketing or operations teams that need to connect website traffic and signups with subscription outcomes without writing SQL. It can analyze billing data from Stripe, Paddle Billing, and Paddle Classic, then help teams examine customers, recurring revenue, growth, and churn in one workflow.
Use the revenue movements, not just the headline
A useful Chartsy workflow starts with a question that can change a decision:
- Which marketing sources are associated with paying customers?
- Which sources contribute the most current recurring revenue?
- What contributed to the MRR change this month?
- Are upgrades offsetting contraction and churn?
- Which plans, countries, or customer groups deserve a closer look?
The platform can break MRR changes into new revenue, upgrades, downgrades, and churn. That makes a decline easier to investigate because you can distinguish weak acquisition from losses in the existing customer base.
Its plain-English AI interface is useful when you don't want to write SQL for every question. You can explore performance, create charts and tables, and save relevant views to dashboards for recurring monitoring. The output still depends on the quality and coverage of the connected data, so it should support judgment rather than replace it.
The following product walkthrough shows how that type of analytics workflow can fit into a small SaaS operation:
Chartsy is a good fit when your immediate problem is the gap between acquisition reporting and subscription reporting. It isn't a substitute for a full data warehouse, causal experimentation, or a CRM process for logging every offline interaction. It is more practical when you need a shared view of sources, customers, MRR, and churn without building and maintaining those joins yourself.
Moving Forward With a Revenue-First Mindset
Good b2b SaaS attribution starts with a change in the question. Instead of asking which campaign generated the most leads, ask which sources are associated with paying customers and durable subscription revenue.
Then make the system dependable:
- Keep UTM naming consistent.
- Preserve source data through signup.
- Match signup records to billing customers.
- Define MRR clearly.
- Separate new, expansion, contraction, and churn movements.
- Review observed patterns without calling them proven causes.
You don't need perfect multi-touch attribution before making better decisions. You need enough trusted data to stop treating every signup as equal and to see whether marketing activity reaches the subscription ledger.
Audit your current path from first visit to signup to billing customer. Find the records that break, identify the MRR movements you can't explain, and decide whether a connected analytics workflow would remove the manual work.
Chartsy connects website traffic and signup sources with Stripe and Paddle subscription data, helping you analyze paying customers, MRR movements, and churn without maintaining complex spreadsheets. Visit Chartsy to see whether its revenue attribution workflow fits your SaaS reporting process.

Written by
Chartsy TeamAnalytics team at Chartsy
The Chartsy Team writes guides, product updates, and resources to help SaaS and eCommerce founders make sense of their metrics, without SQL or spreadsheets.
Chartsy
