
Your subscriber count is growing, but cancellations are increasing as well. You open the billing dashboard and still can't answer the question that matters: are recent customers leaving sooner, or do you have more customers who could cancel? One overall retention number won't separate those possibilities.
If you're asking what is cohort analysis, start with that problem. Instead of treating every customer as part of one changing crowd, you follow groups that started together and compare them at equivalent points in their customer journey.
Table of Contents
- What Cohort Analysis Means
- Reading a Cohort Table Row by Row
- Four Common Types of Cohorts
- Why Cohort Numbers Can Mislead
- Cohort Analysis Examples in Practice
- Run Your First Cohort Review This Week
What Cohort Analysis Means
Cohort analysis groups customers who share a starting event, such as signing up in the same month, and tracks each group at the same ages afterward. Say your subscription business acquires customers in January and February. You want to know whether February's customers stay as long as January's, not which group has more active subscriptions today.
Think of a cohort as a school class that started in the same year. You'd compare classes grade by grade, rather than comparing a first-grader with a senior. Customers need the same treatment because someone who joined recently hasn't had the same opportunity to renew or leave as someone who joined much earlier.
The useful comparison is equal time since entry, not equal calendar dates.
An overall retention average can hide a struggling newer group behind a large, established customer base. Separating customers by entry date lets you inspect that newer group without mixing it with customers who have already stayed for much longer.
Customer age isn't calendar time
The method has roots in demography, epidemiology, and population research, where investigators compared birth cohorts across ages and calendar years, as described in this Oxford Academic reference on cohort analysis. Its framework distinguishes age effects, changes as entities grow older; period effects, events affecting everyone during a calendar period; and cohort effects, experiences shared by a group entering together.
For business reporting, January and February signups are therefore compared at month 1, month 2, and month 3 after acquisition. A cohort table turns that principle into something you can read row by row.
Reading a Cohort Table Row by Row
Month-3 retention for two signup cohorts
| Cohort | Starting customers | Active at month 3 | Month-3 retention |
|---|---|---|---|
| January 2026 signups | 1,000 | 720 | 72% |
| February 2026 signups | 1,200 | 900 | 75% |
These are illustrative signup cohorts, not results from a named business. The calculation follows a fixed starting group over time, consistent with the cohort-measure approach described in the U.S. Census Bureau's subject definitions.
Start with the January row. The starting population is 1,000 customers, and 720 are still active after three months. Divide the active customers by the starting customers, then express the result as a percentage: 720 ÷ 1,000 = 72%.
February starts with a different number of customers, but the same calculation applies. Its 900 ÷ 1,200 = 75% describes retention at the same customer age. That makes the percentages comparable even though the groups reach that age in different calendar months.
Keep the denominator fixed
The denominator is the original starting group. Don't replace it with the customers remaining at the beginning of each later month, because that answers a different question: retention from one interval to the next rather than retention from entry.
Define active before doing the calculation. For a paid-subscription review, active might mean an account with a qualifying paid subscription at the measurement point. A login-based definition would measure engagement instead, so it wouldn't be interchangeable with customer retention based on payment status.
The table above isolates a single milestone. In a full cohort table, rows represent signup groups, columns represent elapsed periods, and cells hold the selected outcome.
- Read across a row to follow one group through its customer lifetime.
- Read down a column to compare different groups at the same age.
- Inspect blank cells before interpreting recent groups. An unobserved period isn't zero retention.
Recent rows have fewer completed observation periods, producing the familiar triangle shape. Don't fill those empty cells with estimates unless you clearly separate forecasts from observed results.
Decide what the cells mean
A cohort table doesn't have to contain customer percentages. You can track active-customer counts, recurring revenue, or revenue per account, provided the label and calculation match the question.
Before sharing any table, write down its entry event, observation interval, outcome, and denominator. Without those definitions, two people can read the same colored grid and believe they're discussing different business results.
Four Common Types of Cohorts
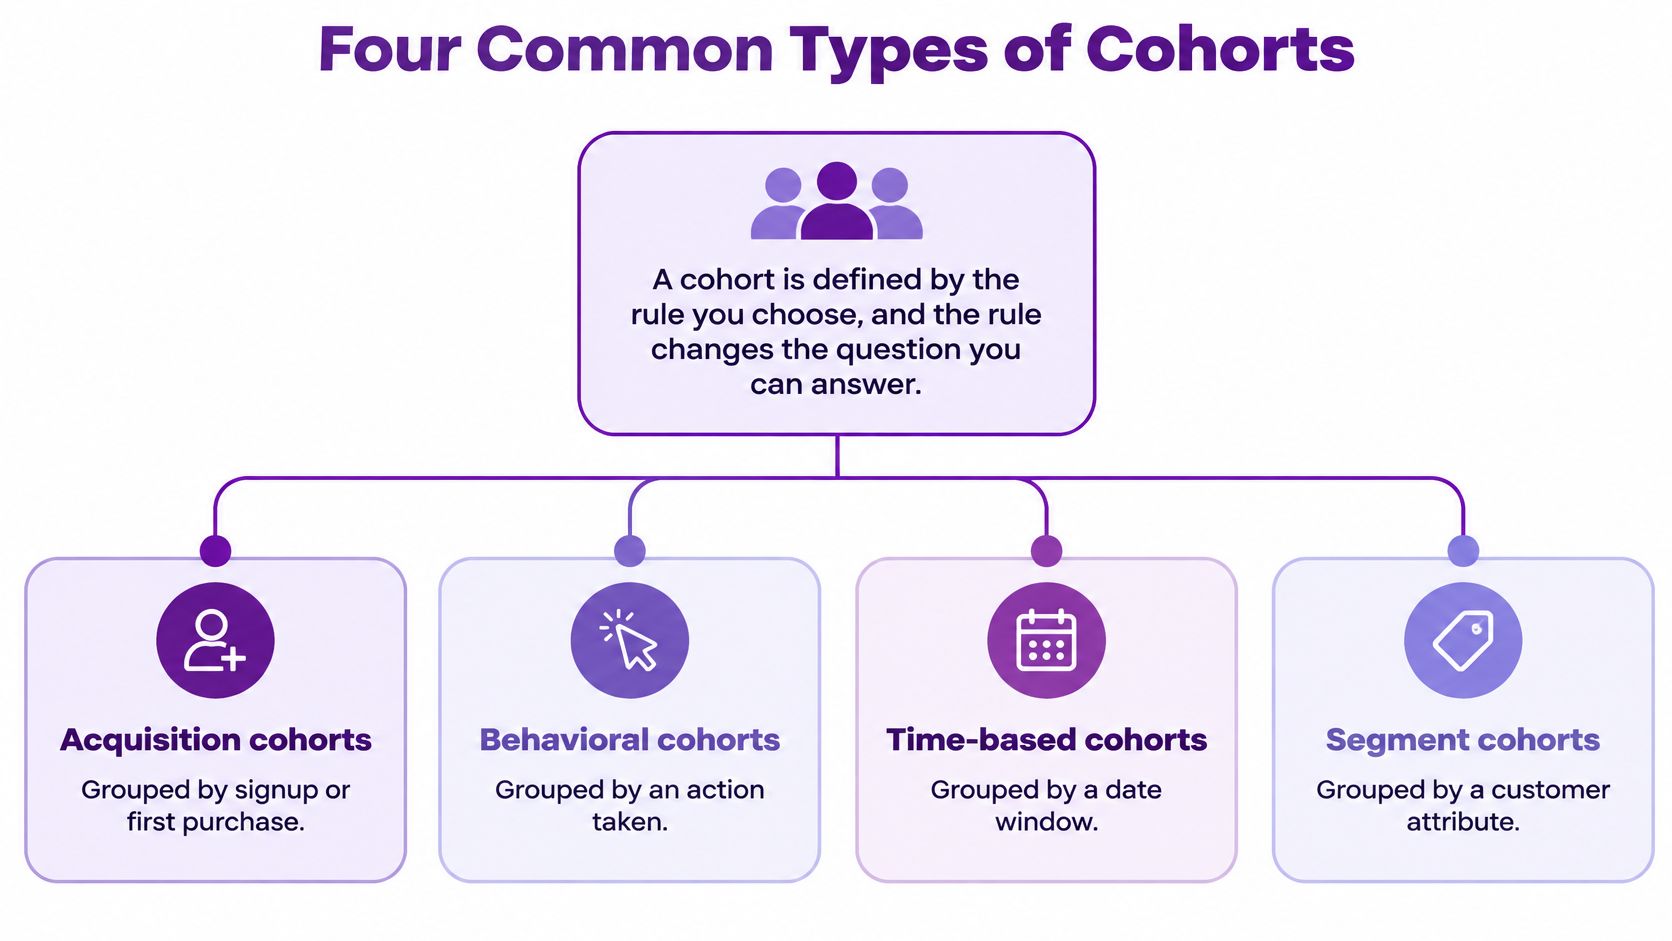
A cohort is defined by its grouping rule, and that rule changes the question you can answer. Joining in March, buying an annual plan, and inviting a teammate describe different starting conditions. Choose the condition that matches the decision you're trying to make.
Cohort types by grouping rule and question
| Cohort type | Grouping rule | Question it answers | Example |
|---|---|---|---|
| Acquisition cohort | Signup or first-purchase month | Do newer customers stay as long as older ones? | Customers who signed up in March |
| Behavioral cohort | Actions taken in the first week | Which early actions predict staying? | Users who invited a teammate in week one |
| Plan or billing cohort | Plan tier or billing cycle at start | Do annual subscribers renew more than monthly ones? | Annual plan buyers versus monthly plan buyers |
| Channel cohort | Acquisition source | Does a campaign bring customers who stay? | Customers from a February paid-search campaign |
These categories overlap rather than forming a universal classification. Acquisition cohorts are commonly time-based; plan and channel cohorts are examples of segment cohorts.
Choose the question before the grouping
Start with acquisition cohorts when you need a baseline. They let you examine whether customer outcomes differ by arrival period without first deciding which behavior or attribute might matter.
Behavioral cohorting, as used in product analytics, asks a different question: which early actions are associated with staying? The word predict in that context means an action may help distinguish later outcomes. It doesn't establish that prompting everyone to perform the action will improve retention.
Plan comparisons also need care. Annual and monthly subscribers face different renewal opportunities, so continuing access and completing a renewal aren't equivalent outcomes. Choose an outcome that gives both groups a meaningful opportunity to qualify.
For more detailed grouping decisions, use SaaS customer segmentation to identify the attribute worth adding, rather than splitting every table into every available category.
Add another grouping only when it answers a specific question. More slices aren't automatically more useful.
Preserve the original membership
For a historical comparison, record the plan or channel at entry. An upgrade shouldn't move a customer out of their original starting-plan group, and a later website visit shouldn't rewrite their acquisition classification.
Write the definition as a glossary entry, including the qualifying event and cutoff window. Chartsy's glossary defines attribution, cohorts, data models, events, metadata, and involuntary churn, each linked to a concept page. The same discipline belongs in your own reporting vocabulary: everyone should be able to determine who qualifies without guessing.
Why Cohort Numbers Can Mislead
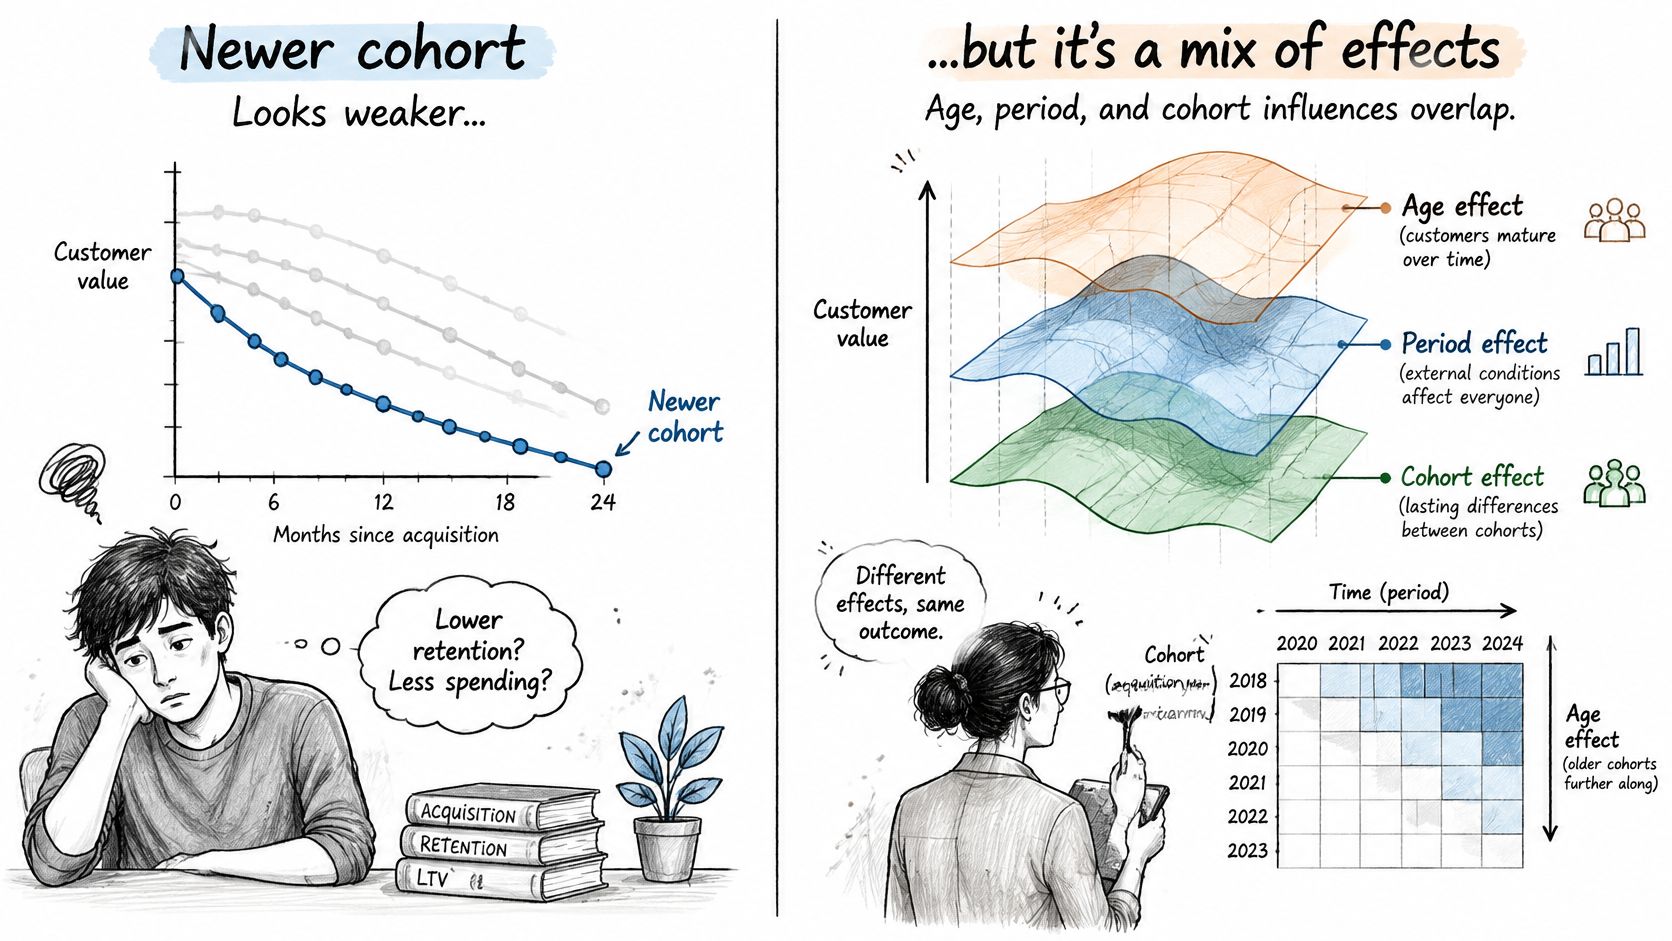
A newer cohort looks worse, so the team concludes that customer quality fell. That's a plausible hypothesis, but it isn't the only one. Weaker onboarding, seasonal acquisition mix, a pricing change, a recession, or a product incident could produce a similar pattern.
The central problem is that customer age, calendar period, and cohort membership are tangled together. UCLA's cohort-analysis paper explains that age, period, and cohort are linearly dependent, so observational data alone can't identify their separate effects without external assumptions.
Test the alternative explanations
Suppose a paid-search campaign appears to bring customers who leave sooner. Before reducing its budget, check whether it attracted customers on lower-priced plans, launched during a slow season, or has less completed follow-up than the channel you're comparing it with.
Ask where the deterioration appears. A weaker result concentrated in one entry group suggests a different investigation from a decline affecting established and recent customers during the same calendar period. Understanding cohort effects helps you separate those investigative paths without prematurely naming a cause.
Measurement changes deserve equal attention. A revised active-customer definition, delayed billing synchronization, or a changed account identifier can create an apparent behavioral shift that customers never made.
Channel credit isn't causal proof
Attribution adds another layer of uncertainty. A systematic review of marketing attribution identifies persistent problems with cross-channel integration, attribution bias, interpretability, and standardized evaluation, supporting treatment of channel credit as an analytical estimate, not perfect or 100% accurate attribution.
Likewise, Google's attribution research explains that first-click and last-click approaches can over-credit awareness or purchase touchpoints while under-crediting research and preference-building activity.
A retention chart shows where outcomes differ. It doesn't, by itself, prove that a campaign, price change, or onboarding intervention caused the difference.
Use this checklist before calling a decline a customer-quality problem:
- Fix cohort definitions. Keep eligibility rules and measurement logic consistent.
- Align tenure windows. Compare only observation periods both groups have completed.
- Annotate calendar events. Mark pricing changes, campaigns, outages, and releases.
- Check composition. Compare like-for-like plans and sources before judging the whole group.
- Wait for maturity. Leave unfinished periods blank and postpone conclusions about later retention.
- Investigate the result. Use customer conversations or a controlled test to evaluate the proposed explanation.
Cohort Analysis Examples in Practice
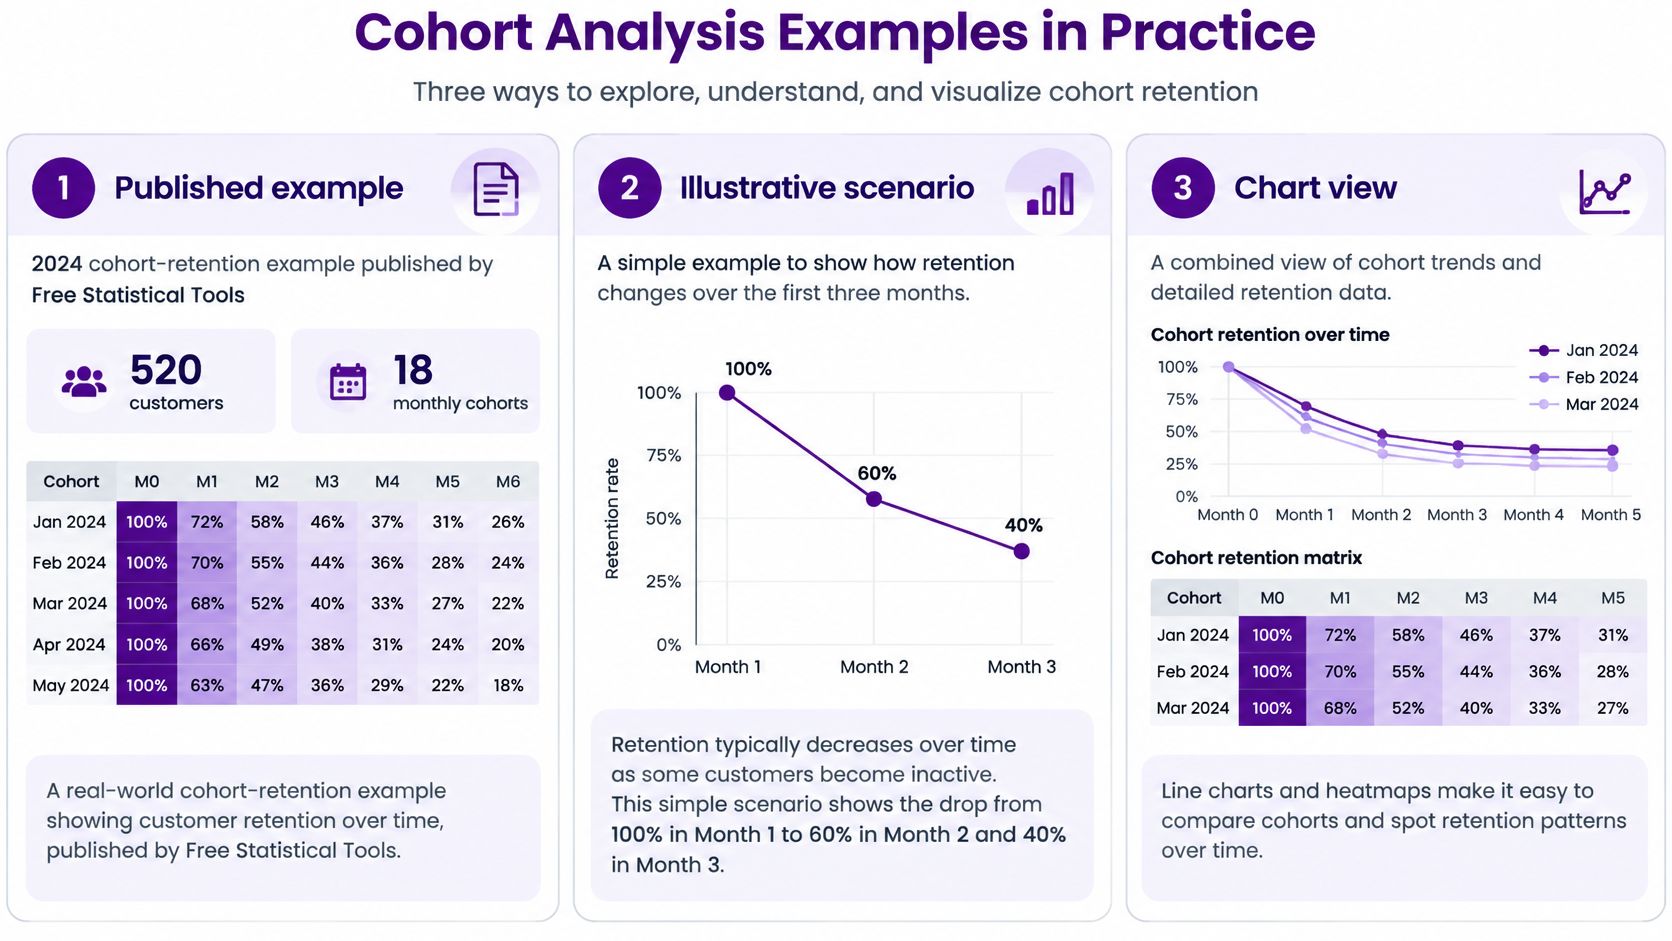
A 2024 cohort-retention example published by Free Statistical Tools covered 520 customers across 18 monthly cohorts; 44.8% made another purchase in the month after their first purchase, while 24.6% remained active after six months. These figures describe that example, not a target your subscription business should automatically adopt.
Cohort-retention example from Free Statistical Tools
| Measure | Value |
|---|---|
| Customers | 520 |
| Monthly cohorts | 18 |
| Purchased again in the month after first purchase | 44.8% |
| Still active after six months | 24.6% |
A total customer count wouldn't tell you whether customers returned after their initial purchase. Tracking the original groups lets you examine repeat behavior rather than confusing continued acquisition with continued participation.
A hypothetical subscription-app investigation
Consider an illustrative scenario: a subscription app's March signup cohort retains about 10 percentage points below February at month 2. Those numbers are hypothetical, used to demonstrate an investigation rather than report a business result.
Begin by confirming that both cohorts have completed the milestone and that the outcome means the same thing for each. In this scenario, the outcome is the share of original signups with a paid subscription at the measurement point, so trial users belong in the starting population.
Next, split each signup cohort by entry plan and trial status. Then inspect the calendar for a March price change or campaign. Suppose the campaign brought a larger free-trial group whose members converted less often, while comparable paid-entry customers performed similarly across the signup periods.
That finding gives you a composition-based explanation worth testing. It doesn't justify labeling every March customer as lower quality.
Read the chart as an investigation
In your chart view, plot elapsed customer age horizontally and the defined retention measure vertically. Use these labeled curves:
- February signups provide the comparison group.
- All March signups show the combined outcome after the acquisition mix changed.
- March free-trial signups isolate the subgroup associated with weaker conversion.
Keep the free-trial subgroup's curve visually distinct because those customers are also included in the all-March curve. These aren't independent populations.
The practical response depends on the diagnosis. For trial users, inspect qualification and trial-to-paid onboarding; for previously paying customers who have lapsed, FOMOchat's guide to win-back campaigns for lapsed subscribers offers a useful starting point for planning outreach.
The first view identifies the affected group. The second cut narrows the explanation, giving you a specific question to validate rather than a broad instruction to fix retention.
Run Your First Cohort Review This Week
You don't need a complicated reporting setup to begin. A spreadsheet works well for a small account, provided you can trace each customer back to the billing record and reproduce the calculation.
Build a review you can repeat
-
Pick one entry event. Use the first paid invoice if your question concerns paying-customer retention. This keeps free signups from entering a denominator intended to represent buyers.
-
Choose a cohort period. Start with monthly entry groups from the past 12 months as a practical working window, not a statistical requirement. If the groups are too sparse to interpret, widen the grouping period rather than treating unstable percentages as firm evidence.
-
Pull actual billing records. Count distinct paying customers, not invoice rows or estimated subscriptions. Reconcile duplicate accounts, refunds, and payment status so the starting population matches your written rule.
-
Build the triangle. Put cohorts in rows and months 0 through 6 in columns for an initial worksheet. Keep future cells empty, and decide whether each column represents a completed elapsed interval or a point-in-time observation.
-
Inspect comparable milestones. Read month 1, month 3, and month 6 down their respective columns. Flag departures from your own established pattern, then check the underlying customer counts before deciding which deserves attention.
-
Add the business timeline. Annotate pricing, campaign, and product dates, then inspect the affected customer groups. This gives you concrete events to investigate instead of attributing every difference to the people you acquired.
Keep the useful question visible
Chartsy is one option for building cohort retention charts from invoice data rather than subscription estimates. Use the chatbot for a one-off question, pin a chart for a question you'll ask again, and build a dashboard for a recurring review.

Before saving the review, add a short note containing the metric definition, the suspected explanation, and the next check. That note makes the next review an investigation rather than another glance at a chart.
Start with one cohort and one question: do March signups still pay at month 3?
Chartsy offers invoice-based cohort retention reporting, plan breakdowns, and reusable dashboards for subscription businesses. Visit Chartsy to build a cohort view around your first retention question, then pin the chart when it becomes a question you need to answer regularly.

Written by
Chartsy TeamAnalytics team at Chartsy
The Chartsy Team writes guides, product updates, and resources to help SaaS and eCommerce founders make sense of their metrics, without SQL or spreadsheets.
Chartsy