
Two numbers sit in the founder's spreadsheet. One says the average customer is worth $640 in gross profit. The other says the last paid campaign brought customers in at $300 each. The gap looks like permission to spend, so the budget goes up, and two quarters later the bank account tells a different story than the model did.
The arithmetic isn't the problem. The problem is that a single lifetime value figure is several calculations wearing one coat. Customers on annual plans behave nothing like customers on weekly ones. A card that fails is not the same event as a customer who cancels on purpose. Someone who leaves in March and comes back in June belongs in a different bucket from someone who never returns. Lifetime value analysis is the work of separating those paths and pricing each one.
What follows is the formula, walked through with real numbers, then the places where it misleads.
Table of Contents
- Lifetime Value Formula and Worked Example
- Churn and ARPU Inputs That Move Your LTV
- Separating Voluntary, Involuntary and Returning Churn
- Cohort and Acquisition Channel Breakdowns
- Interpretation Mistakes That Distort LTV
- Setting Acquisition Cost Limits With LTV
- Set Up a Monthly LTV Review
Lifetime Value Formula and Worked Example
Start where the founder is. A plan bills $40 a month, churn runs at 5% a month, and acquisition has crept up to $300 per customer. The question on the table is whether $300 is affordable, and the answer depends entirely on which version of lifetime value you compute.
Lifetime value is the revenue, or preferably the gross profit, that a typical customer is expected to produce between signing up and leaving. The fastest version divides average revenue per user by the monthly churn rate. Churn is a monthly probability of leaving, so dividing by it returns the average number of months a customer stays, and multiplying that by revenue per month gives the total.
The worked example: $40 ARPU ÷ 0.05 monthly churn = $800 of lifetime revenue. At an 80% gross margin, the same customer delivers $640 of gross profit.
Keep both figures and know which one you're using. The $800 answers a revenue question, such as how much of next year's top line the current base can support. The $640 answers a spending question, because acquisition comes out of gross profit, not revenue. Comparing a revenue-based lifetime value against a cash acquisition cost is the most common way a founder talks themselves into a channel that never pays back.
Four ways to calculate the same customer
Each method below answers a different question, and the disagreement between them is where useful information lives.
| Method | Formula | Best for | Main blind spot |
|---|---|---|---|
| Simple ARPU model | ARPU ÷ monthly churn rate | Fast first estimate | Ignores gross margin and expansion |
| Margin-adjusted | ARPU × gross margin ÷ monthly churn rate | Pricing and acquisition cost decisions | Assumes churn stays flat over time |
| Cohort realized | Revenue collected per customer in a cohort to date | Proving what has actually been earned | Incomplete for young cohorts |
| Projected with expansion | Cohort revenue plus expansion, projected forward at forecast churn | Planning and forecasting | Depends on assumptions that need checking |
Realized LTV describes money a cohort has already paid. It needs no forecast, only a clean billing history, and it's the number you can defend in a board meeting. Projected LTV needs a churn assumption carried forward, which means every weakness in that assumption ends up inside the answer.
Three inputs to collect before you calculate
Don't open the spreadsheet until you have these, because each one comes from a different system and they must cover the same window.
- ARPU from issued invoices. Not list price, not the plan tier on the pricing page. Sum what was billed and divide by paying customers.
- Churn measured over the identical period. Same months, same customer definition, cancellations divided by customers at the start.
- Gross margin from the cost of serving the subscription. Hosting, support, payment fees and third-party API costs per account, subtracted from revenue.
Then run a stability test. Recalculate with churn one percentage point higher. If the result swings by more than a fifth, the estimate is too fragile to build a budget on and you need more billing history, not a bigger spreadsheet.
Churn and ARPU Inputs That Move Your LTV
The formula has two inputs and only one of them punishes sloppiness severely. Churn sits in the denominator, so small errors there scale into large errors in the answer. Getting the period right is the first discipline.
Converting annual retention into a monthly rate
Annual retention of 60% means 40% annual churn. Dividing that 40% by twelve gives about 3.3% monthly churn, and that is where many LTV sheets first go wrong, because retention compounds rather than disappearing in equal slices. Raise the annual retention figure to the power of one twelfth: 0.6^1/12 is about 0.9583, so true monthly churn is about 4.2%. The shortcut understates churn by roughly a fifth, and mixing an annual figure into a monthly formula produces an answer that means nothing at all.
Plan length changes the shape of the same risk. A monthly plan exposes churn every month, while an annual plan concentrates the decision into one renewal date and can make the intervening months look deceptively stable. A customer who pauses, downgrades, fails a payment and later reactivates can also enter the calculation as several small events or one larger loss, depending on how the billing history is grouped.
At $40 ARPU, the range of plausible outcomes is wide enough to change decisions.
| Monthly churn rate | Average customer lifetime | Revenue LTV at $40 ARPU |
|---|---|---|
| 2% | 50 months | $2,000 |
| 4% | 25 months | $1,000 |
| 6% | about 17 months | about $667 |
| 8% | 12.5 months | $500 |
| 10% | 10 months | $400 |
Move churn from 4% to 8% and lifetime value halves, from $1,000 to $500. That gap is not a rounding problem. It is the difference between a channel you can afford and one you cannot, produced by four percentage points of measurement error, which is entirely plausible after a price change, a billing migration or a shift in plan mix.
ARPU comes from invoices, not the price list
List price overstates revenue per user whenever customers receive discounts, change plan mid-cycle, pause, downgrade, or have a failed payment retried. Pull the amount issued on invoices and net out discounts, partial refunds, prorations and failed charges before dividing by paying accounts. If the per-seat and per-plan definitions blur together, this walkthrough of how ARPU is calculated from real billing data covers the variants and when each applies.
For the retention side of the same problem, the CLV guide for B2B SaaS founders from Big Moves Marketing goes deeper on which levers extend customer life rather than just flattering the number.
A four-step measurement routine
- Pull the window. Extract monthly paying customers and cancellations for at least three consecutive months of billing history.
- Divide cancellations by opening customers. Use customers at the start of the window as the denominator, because the average can hide a fast-growing or shrinking base.
- Compute ARPU from the same window. Invoice totals net of adjustments, divided by paying accounts, checked against the same months.
- Test the result at churn plus one point. If the LTV moves more than you would tolerate, extend the window or wait for cleaner data.
Three months minimum matters because a single month can carry a billing migration, a price change or a seasonal dip, and any of those will set your churn figure to something that is not real. Two clean months and one strange one tell you more than one clean month alone ever will.
Separating Voluntary, Involuntary and Returning Churn
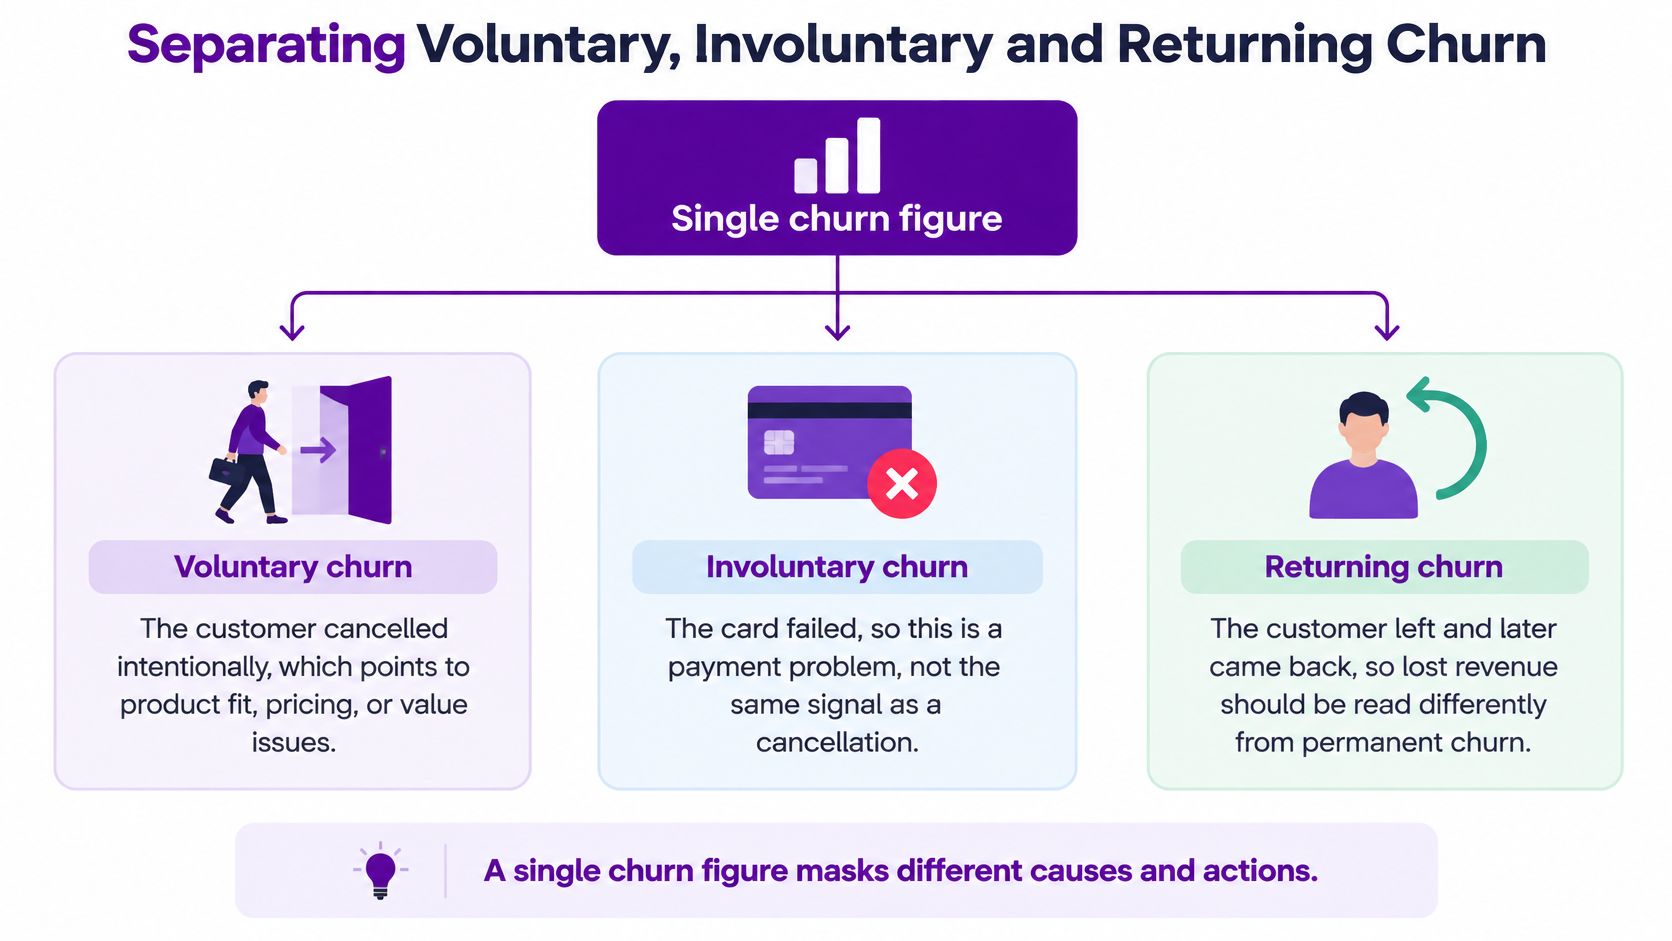
A customer whose card expired and a customer who clicked cancel both land in the same churn column on most dashboards. They are not the same event. The first is a billing problem you can often fix with a retry schedule, a dunning email and a grace period. The second is a judgement about your product, your price, or whether the customer needed you at all.
Five states instead of one churn figure
Replace the single exit event with five states, tagged at the moment the customer leaves or lapses: active retention, temporary pause, failed-payment recovery, voluntary churn and reactivation. Each has a different cost to reverse and a different implication for the business.
The Mastercard subscription economy report quantifies how much this matters. It reports that 31% of consumers frequently cancel and resubscribe, that more than half of U.S. businesses say at least 10% of subscribers are inactive, and that 54% say over 20% of their churn is involuntary. The same body of subscription research reports that pause features retained 51.7% of at-risk customers, with return acquisition rates of 24.3% in digital media and 22.9% in travel, hospitality and entertainment.
Reading a 100-customer month
Say 100 customers leave in a month. Twenty leave because a payment failed. Eighty choose to go. Of those eighty, eight come back within 60 days and start paying again.
A single churn figure records 100 departures and stops there. A classified count records 20 billing failures, 72 voluntary exits and 8 reactivations, and that last group is revenue you'd have written off entirely under the old model. The 20 billing failures are the cheapest to attack, because a retry ladder and a card-update prompt recover some of them with no product work at all.
Practical rule: report post-churn revenue as its own line. Cancellation is a state, not a verdict.
Here's a short walkthrough of the mechanics if you prefer to see the flows drawn out.
Four steps that put recovery into the model
- Tag every leaver by state at exit. A cancellation reason field with five fixed options beats free text, because free text can't be counted.
- Report realized LTV by cohort, including post-churn revenue. Anything a returning customer pays belongs to the original cohort, or you'll double count acquisition.
- Build scenario LTV where recovery succeeds at a stated rate. If payment retries recover 40% of failed charges, model that explicitly rather than hoping.
- Remove recovery and compare. The gap between the two scenarios is the share of your LTV that depends on winning customers back, which tells you whether to fund dunning or fund retention.
Cohort and Acquisition Channel Breakdowns
Two customers can pay you the same amount this month and be worth completely different sums over their lifetimes. One signed up annually through a referral, the other monthly through a paid ad. Averaging them produces a figure that describes neither. Splitting lifetime value by plan length, signup month and acquisition channel turns one flattering number into a set of decisions.
Why annual plans look better than they are
Plan duration changes retention dramatically. Data from RevenueCat's State of Subscription Apps 2025 shows nearly 30% of annual subscriptions were cancelled in the first month, yet at twelve months the same report shows a wide spread by plan type: annual plans held 44.1% of subscribers, monthly plans held 17.0%, and weekly plans generally finished below 6.5%.
Read that gap carefully. Part of the annual advantage comes from commitment and from how the billing structure frames the renewal decision: an annual customer faces one stay-or-leave moment per year, while a monthly customer faces twelve. A high annual LTV can be an artifact of payment terms, so treat the plan-length premium as a hypothesis to test in your own cohort data before you count it as a product improvement.
Gross LTV and expansion-adjusted LTV
Expansion among surviving accounts can offset contraction and churn entirely, which is how a customer base can shrink by count while growing by revenue.
Gross LTV excludes expansion and shows what the base pays before anyone upgrades. Expansion-adjusted LTV includes it. Report both, because net revenue retention above 100% can hide weak logo retention when a handful of accounts grow quickly while the rest drift away. If your expansion-adjusted figure is strong but gross LTV is flat, your growth depends on upgrades from a narrowing group, and that dependency deserves its own line in every review.
| Slice | Question it answers | What to watch |
|---|---|---|
| Signup month | Are newer cohorts retaining better or worse? | Cohorts under six months old are still maturing |
| Plan length | Does annual billing change retention? | Annual commitment can inflate LTV without product improvement |
| Acquisition channel | Which channels bring customers who stay and expand? | First-conversion attribution can favor low-intent signups |
| Price tier | Do higher-priced customers churn less? | Count churn and revenue churn can move in opposite directions |
Channel quality hides inside the average
Attribution that stops at first conversion rewards whichever channel produces the cheapest signups, and some of those signups never intended to pay. A retention-adjusted view often favors a channel that delivers fewer customers who stay twice as long, even when that channel looks expensive on a cost-per-trial basis. Platforms that join billing records to traffic data make this readable without manual stitching; Chartsy, for instance, links each customer journey from first visit through signup to paying customer. The SaaS cohort analysis guide covers how to build the retention view that makes this comparison possible.
Compare cohorts at the same age
A six-month-old cohort and an eighteen-month-old cohort are not comparable at their current totals. Hold age constant: read every cohort at month three or month twelve, whichever both have reached, and put a confidence range around any cohort still adding months.
A young cohort that beats an older one at the same age is a genuine signal. One that beats it only because you compared month two against month twenty is arithmetic dressed up as insight.
Interpretation Mistakes That Distort LTV
The costliest error is also the easiest to make. Trials get counted as customers. Once free trials sit in the denominator of churn and the numerator of revenue per user, every downstream figure describes a population that includes people who never paid you.
The fix is unglamorous. Report trial-to-paid conversion as its own metric, and compute lifetime value only on accounts that have issued at least one invoice. Your churn rate will rise, your lifetime value will rise, and both will finally describe the same group of people.
Three more errors show up constantly, each with a cheap correction.
- Averages that hide concentration. In ecommerce, the top 5% of customers generated an estimated 35% of total store revenue, according to Smile.io's 2025 State of Ecommerce Customer Loyalty report, which analyzed 585 million orders across more than 100,000 merchants in 148 countries. Subscription businesses show the same shape. Report the median customer and the share of MRR held by your top accounts beside the mean, so a handful of large accounts can't define your economics.
- List price instead of collected revenue. Discounts, refunds, credits and failed payments all reduce the cash that arrived. Net them out before the division, not after you've made the decision.
- Projections presented as history. Label every figure as realized, projected or scenario-based. When a founder can't tell which is which, a forecast becomes a fact in the next deck.
The habit that prevents all four is writing the assumptions next to the number. Window, churn definition, margin treatment, refund policy. When the figure moves next quarter, the note tells you which input changed and whether that change is real.
Setting Acquisition Cost Limits With LTV
Lifetime value earns its keep when it sets a spending ceiling. Take the margin-adjusted $640 from the worked example and pick a target ratio of 3:1. The maximum you can pay per customer is $640 ÷ 3, or about $213. At $300 per customer, the campaign above the ceiling isn't buying growth, it's buying customers at roughly 2.1:1, which leaves little room for error.
Payback matters more than the ratio for a bootstrapped business. Monthly gross profit per customer here is $40 × 0.8, or $32. At a $213 acquisition cost, payback takes $213 ÷ $32, or roughly 6.7 months. Stretch that to eighteen months and the ratio can look wonderful while your cash sits in a customer who hasn't repaid the cost of winning them.
| LTV to CAC ratio | What it usually signals | Decision it supports |
|---|---|---|
| Below 1:1 | Each customer costs more to acquire than they return | Pause paid spend and review pricing or retention |
| About 1:1 | Acquisition roughly breaks even before overheads | Keep only if payback is very fast |
| 3:1 | Common rule of thumb for healthy growth | Scale spend while checking payback period |
| 5:1 or higher | Strong economics, or possibly under-investing | Test whether more spend can be absorbed |
Benchmarks shift with price point, margin and market, so treat the ratio as a starting point rather than a verdict. A low-margin business needs a higher ratio to reach the same payback, and a business with strong annual prepayment can tolerate a lower one.
Comparing channels comes down to four steps. Calculate realized LTV per channel at matched cohort age. Divide each channel's cost per paying customer by that LTV. Compare payback months rather than ratios alone. Then shift budget only where payback fits inside your cash runway. If part of that spend goes to search, a plain explanation of what SEM means in marketing from Polish is a useful primer before you attribute paid search results to the wrong line. The mechanics of the cost side are covered in this guide to how to calculate customer acquisition cost.
Set Up a Monthly LTV Review
Lifetime value analysis decays. Cohorts age, prices change, a channel stops working, and last quarter's model describes a business that no longer exists. A short monthly review keeps the figures current without turning into a reporting project.
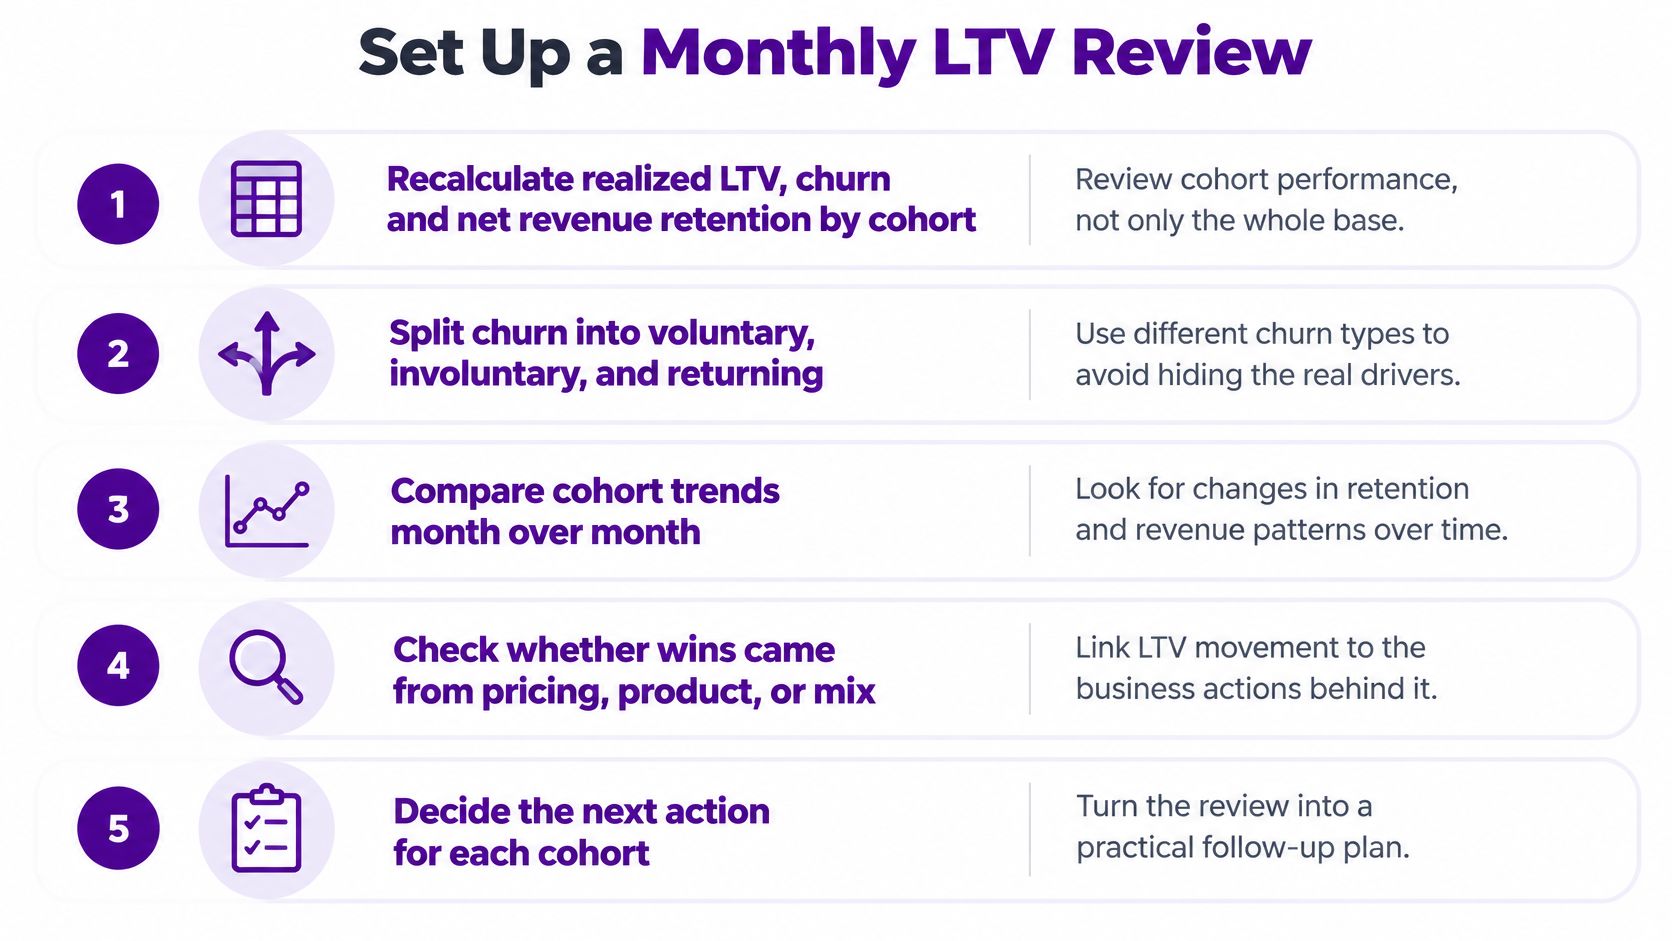
- Recalculate realized LTV, churn and net revenue retention by cohort, not only for the whole base.
- Split churn into voluntary, involuntary, paused and reactivated buckets, so a drop in one doesn't hide inside a flat total.
- Record the assumptions beside each figure. Window, margin, refund treatment, churn definition.
- Compare channels only at matched cohort ages, with a confidence range on young cohorts.
- Check LTV to CAC and payback before changing any budget line, not after.
The review runs in a spreadsheet, as long as billing data, cancellation reasons and acquisition source stay joined per customer. Chartsy reports churn rate, LTV and net revenue retention straight from invoice data and lists the customers at risk, which gives the routine a starting point without a rebuild each month.
Separate noise from signal by watching persistence. A shift in one bucket that survives two monthly reviews is worth acting on. A single-month swing is usually a measurement effect, a migration, or one large account changing plan.
This week, pick one cohort. Calculate its realized LTV by acquisition channel at a matched age, set the acquisition cost ceiling from that figure, and hold the next budget change against it.
Chartsy connects your billing data to the traffic that produced it, so you can see which channels create customers who stay and which ones only create signups. Churn, lifetime value and net revenue retention are calculated from your issued invoices, with movement split into new, expansion, contraction and churned revenue. If you'd rather read lifetime value analysis from your own numbers than from a template, take a look at Chartsy and start with your top two acquisition channels.

Written by
Chartsy TeamAnalytics team at Chartsy
The Chartsy Team writes guides, product updates, and resources to help SaaS and eCommerce founders make sense of their metrics, without SQL or spreadsheets.
Chartsy