
You can have a dashboard full of numbers and still not know whether your SaaS is healthy. One payment lands, another renewal fails, a yearly plan renews, and a lifetime license gets booked alongside subscriptions. By the end of the week, the revenue graph has moved, but the reason still feels fuzzy.
That's the daily reality for many founders and solo builders using Freemius. The data is there, but the hard part is turning raw billing events into a clear read on recurring revenue, retention, and marketing performance. Without that framework, it's easy to confuse cash movement with MRR, or customer count with real growth.
Table of Contents
- Why Recurring Revenue Feels Like a Mystery
- Understanding the Core Subscription Metrics
- The Hidden Complexity of Freemius Billing Data
- Built-In Tools Versus Advanced Attribution
- Setting Up Chartsy for Subscription Tracking
- Building a Weekly Revenue Review Routine
Why Recurring Revenue Feels Like a Mystery
A founder opens the dashboard after a strong sales month. Cash is up, yet the business may not have gained the same amount of recurring revenue. An annual renewal, a lifetime purchase, a new subscription, and a failed payment can all appear in the same period while representing very different future value.
That mix makes Freemius billing data difficult to read without a clear framework. A lifetime purchase creates cash but no renewal. An annual plan creates recurring value that must be spread across its billing period. A failed payment may leave an account visible while putting expected revenue at risk. One top-line total can therefore hide several opposing movements.
Freemius made an early attempt to connect commercial results with product behavior through Freemius Insights, introduced in 2015 for WordPress plugin and theme developers who previously lacked easy access to product-usage data. In beta, it recorded about 500,000 tracked events, 14,000 captured users, and 15,000 captured domains (Freemius Insights announcement). Those figures illustrate how much customer activity can sit behind a single sales number.
The real question behind the chart
A revenue increase might reflect new customer acquisition, several upgrades, or annual renewals arriving in the current month instead of the previous one. A decline might indicate cancellations, failed payments, or billing timing. The chart shows the result, so your review must identify the event behind it.
Practical rule: treat every revenue change as a question, not an answer. Check whether it came from new customers, plan changes, renewals, or cancellations before deciding what to fix.
Freemius separates sales analytics from audience analytics, a useful structure for plugin and theme businesses. One view covers commercial performance; the other covers installation and usage behavior. Together, they connect acquisition to engagement and then to recurring monetization.
The SaaS metrics guide provides a broader vocabulary for linking growth, retention, and revenue. Use that framework to decide whether a good month reflects durable subscription growth or a temporary billing event.
Understanding the Core Subscription Metrics
MRR means Monthly Recurring Revenue, which is the monthly-normalized value of active subscriptions. If a plan bills annually, divide the recurring value across twelve months. If a sale is lifetime, it's not MRR at all, because it doesn't recur.
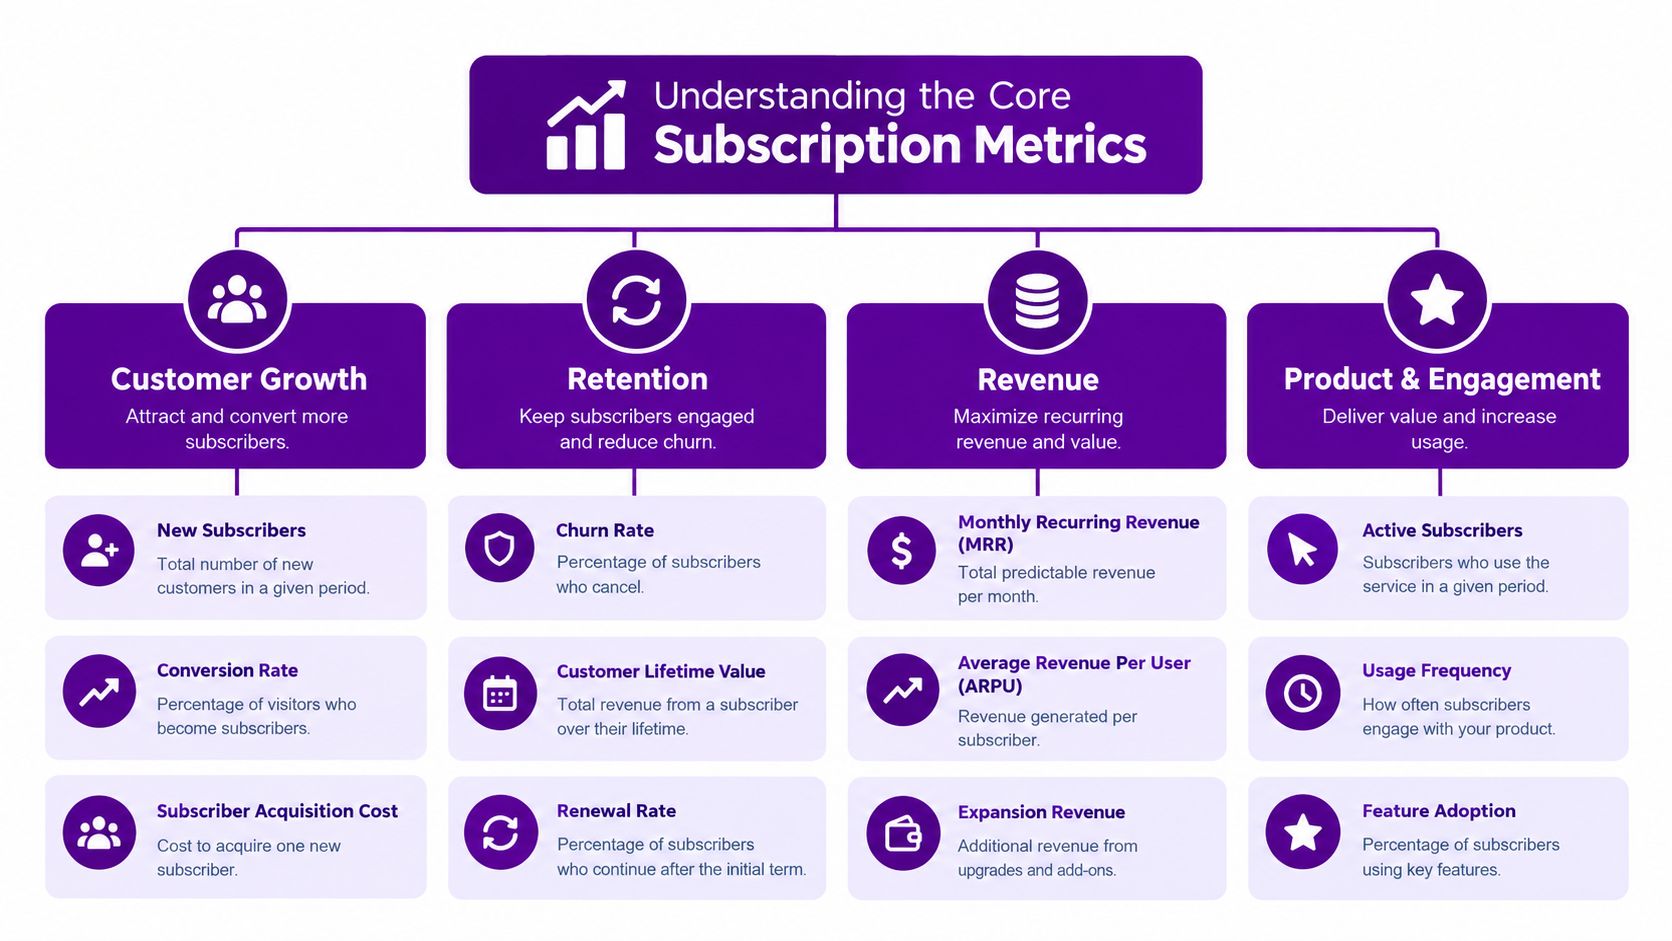
The cleanest way to think about MRR is to break it into movement. New revenue comes from new subscriptions. Expansion revenue comes from upgrades. Contraction revenue comes from downgrades. Churned revenue comes from cancellations.
A simple hypothetical example makes the math easier to see. If ten new monthly subscribers join, five existing customers upgrade, and two downgrade, the business can grow even if total subscriber count barely changes. That's why subscriber count alone is a weak proxy for revenue health.
Recurring revenue is not the same as cash received
A founder who sells an annual plan gets cash up front, but the monthly recurring value still needs to be normalized. A founder who sells lifetime access gets cash too, but that sale should live outside MRR because it doesn't renew. The same goes for taxes, which can inflate a naive invoice total without changing recurring economics.
For a useful external reference on the vocabulary around these metrics, SaaS financial metrics 2026 is a solid read. It helps anchor the difference between revenue, retention, and growth without mixing the terms together.
A dashboard that only totals subscriptions can make a flat business look like it's growing, or a healthy business look stuck. Normalize the billing cycle first, then ask what changed.
That distinction matters even more when you have annual plans and lifetime offers in the same catalog. A larger customer count can coexist with flat MRR if more people choose cheaper plans, or if one-time sales crowd out recurring revenue in the mix.
The Hidden Complexity of Freemius Billing Data
A Freemius account can contain monthly subscriptions, annual plans, trials, discounts, and lifetime purchases at the same time. That mix makes a simple subscription total unreliable. Each offer contributes to cash flow differently, so the first job is to classify the transaction before measuring recurring revenue.
The API exposes fields including initial_amount, renewal_amount, amount_per_cycle, total_gross, tax rate, renewal discounts, failed-payment counts, outstanding balances, and trial end dates (Freemius subscriptions API). These fields describe different parts of the customer relationship. Checkout value is the amount charged at purchase, while recurring value represents what the customer is expected to renew. Using one as a substitute for the other can inflate MRR.
The lifetime purchase trap
Freemius defines billing_cycle in months. A value of 1 indicates a monthly plan, 12 an annual plan, and 0 typically indicates a lifetime purchase, as described in the Freemius subscriptions API documentation. The zero is the key distinction: lifetime revenue belongs in one-time sales and cash reporting, not recurring revenue. Adding it to MRR makes a temporary sales spike look like durable growth.
Annual plans need a different treatment. Their upfront payment belongs in cash reporting when collected, but the recurring model should spread the plan across its renewal period. This keeps a large annual invoice from distorting the monthly view.
Revenue, MRR, and cash received answer different questions. Revenue analysis focuses on the economics of the sale. MRR estimates recurring value. Cash reporting shows liquidity. Treating them like interchangeable labels makes the business harder to diagnose.
Failed payments and outstanding balances change the picture
Failed-payment counts and outstanding balances add another layer. A subscription may remain active while Freemius attempts payment recovery, so its contract status may look healthier than collected cash. The reverse can also happen when a customer has paid upfront but contributes no recurring value.
Good practice: report recurring revenue, one-time sales, and collected cash separately. Combining them removes the signal needed to understand growth.
A practical Freemius MRR model starts by excluding lifetime purchases, normalizing annual plans, deciding whether tax is included, and reconciling the result with payment events. Once those rules are consistent, the figures become easier to audit and trust.
Built-In Tools Versus Advanced Attribution
Freemius gives a founder a useful billing view without requiring a separate analytics stack. Freemius Insights added product-usage visibility, while the platform's dashboard separates sales activity from audience and installation behavior (Freemius Insights announcement). That covers practical questions such as who paid, which plan they bought, and how they use the product.
The limitation appears when you connect billing with the path that produced the customer. Freemius can record a subscription, renewal, or failed payment. It cannot, by itself, explain whether an article, advertisement, partner link, or newsletter influenced that purchase. Billing data shows the transaction. Attribution adds the customer's route to it.

The distinction matters for recurring revenue. A lifetime purchase may produce a large payment while adding nothing to future MRR. An annual customer may create a substantial cash event but renew on a different schedule. A failed payment may leave the subscription active while collected cash falls behind. Attribution cannot correct those billing definitions, so the revenue model must classify each event before channel performance is compared.
For a broader view of source tracking, attribution tools for performance marketers provide useful examples of how teams connect campaigns with conversions. Native billing analytics are easier to configure and maintain. Cross-source attribution requires more setup, including consistent campaign tags, signup records, and customer identifiers, but it can show which channels produce customers who continue paying.
What changes when you add attribution
The question becomes, “Which source produced customers who stayed, renewed, or failed to pay?” That connects marketing activity with the quality of recurring revenue rather than stopping at signup volume. You can compare plans, customer segments, and revenue events by source, provided lifetime sales, annual commitments, and payment failures remain separate measures.
Chartsy's attribution concept guide explains how traffic, signups, and revenue can fit into one observed customer path. Treat that path as evidence for investigation, not proof of causation. A customer may see several sources before purchasing.
The more useful comparison isn't “native analytics or attribution.” It is whether you need a report that records what happened or a working model that helps explain why the numbers changed. Early-stage teams may manage well with native reports. As channels multiply and recurring revenue becomes more important than raw traffic, source-aware analysis gives weekly revenue reviews a clearer operating signal.
Setting Up Chartsy for Subscription Tracking
A practical setup starts with the billing connection. Chartsy now has a native Freemius integration, so you can connect your Freemius billing data for analysis without building a custom API pipeline. Freemius does not require Chartsy's Custom API, because that separate option is for other billing systems.
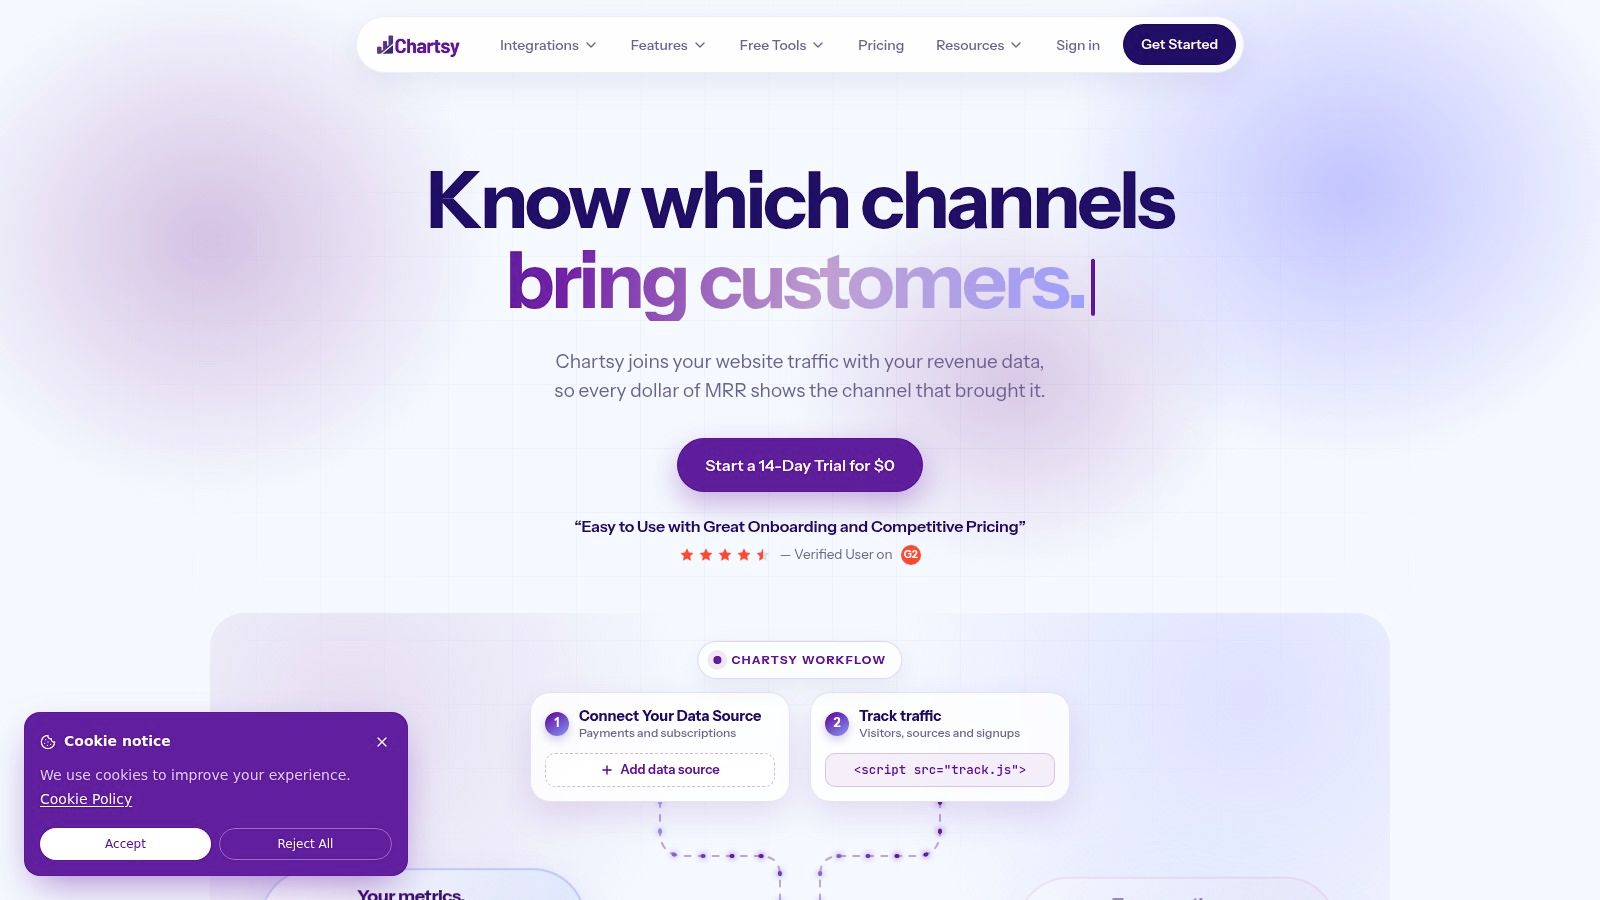
Start by linking the billing source, then review the first import for plan names, subscription status, renewal behavior, and the mix between recurring and one-time revenue. After that, ask plain-English questions about the data instead of building spreadsheets first. Questions like “How has my MRR changed over the last six months?” and “Break down my recurring revenue by plan” are good starting points.
A simple workflow that works for busy founders
- Connect Freemius billing data. Use the native integration and confirm the imported records match your active plans and billing history.
- Check the recurring split. Separate monthly, annual, and lifetime activity so you're not treating one-time sales as MRR.
- Ask narrow questions. Look at plan mix, customer growth, renewals, and churn before widening the lens.
- Save the useful charts. Keep the views you'll want to revisit every week instead of rebuilding them.
If you also want marketing attribution, you'll need tracking on the website side so traffic and signup sources can be tied to billing data. That extra step is what turns a billing report into a source-to-revenue workflow.
The fastest way to get value is to ask one question per chart. If you ask too much at once, you'll get a nice-looking answer and still not know what to do next.
For setup specifics, the Freemius data source help page is the place to check the current connection details. Once the data is in, the main work is not importing. It's reviewing the numbers in a way that matches how subscription revenue behaves.
Building a Weekly Revenue Review Routine
A weekly review doesn't need to be fancy. Open your saved dashboards, check MRR movement, and scan for changes in plan mix, churn, and new revenue. If something moved, ask whether it was a new customer source, a pricing change, a feature launch, or just billing timing.
Look at the same questions each week so you can spot pattern shifts, not just isolated spikes. Which plans are gaining share? Which sources bring paying customers instead of just leads? Which subscriptions renewed, downgraded, or disappeared?
A simple founder checklist
- MRR direction: Is recurring revenue rising, flat, or slipping compared with last week?
- Source quality: Which marketing channels are producing paying customers, not just signups?
- Plan movement: Are customers moving toward higher-value plans or away from them?
- Retention signals: Are cancellations concentrated in one segment, one plan, or one acquisition source?
The goal isn't to prove a single cause from one chart. It's to narrow the list of likely causes so you know where to look next. That's the difference between staring at a dashboard and running the business.
If you want a clearer view of what's driving your recurring revenue, connect Freemius to Chartsy and start asking the questions behind the numbers. You'll be able to review MRR, churn, plan mix, and customer sources in one place without living in spreadsheets. For founders who need to understand which channels bring paying customers and which subscriptions keep renewing, that's the fastest path to better decisions.

Written by
Chartsy TeamAnalytics team at Chartsy
The Chartsy Team writes guides, product updates, and resources to help SaaS and eCommerce founders make sense of their metrics, without SQL or spreadsheets.
Chartsy
