
Picking a winning channel isn't a data problem so much as a decision problem: once you can see visitors, signups, paying customers, and MRR by source, you still need a framework for comparing channels that don't behave alike — a paid campaign with a two-day sales cycle against a content channel that pays off in month four. Here are nine tools that surface that comparison, with the best fit and tradeoffs for each, plus a framework at the end for weighing the results.
Table of Contents
- Chartsy, Connect acquisition sources to Stripe and Paddle revenue
- Google Analytics 4, A free starting point for basic attribution
- Ruler Analytics, Closed-loop attribution for lean marketing teams
- Dreamdata, B2B SaaS revenue attribution across long buying journeys
- HockeyStack, Revenue analytics for B2B SaaS go-to-market teams
- HubSpot Attribution, A usable choice for HubSpot-centered teams
- Rockerbox, Multi-channel measurement with CRM and offline data
- Northbeam, Hybrid attribution for enterprise omnichannel campaigns
- AdBeacon, Real-time attribution insights for multi-channel marketing teams
- Compare the best tools for tracking paying customers by marketing channel
- What to look for when choosing a marketing attribution tool
- FAQ
- Conclusion
1. Chartsy, Connect acquisition sources to Stripe and Paddle revenue
Chartsy connects website acquisition data with Stripe and Paddle subscription data. It is built for small SaaS teams that need to see which sources produce paying customers, not only which sources bring visits.
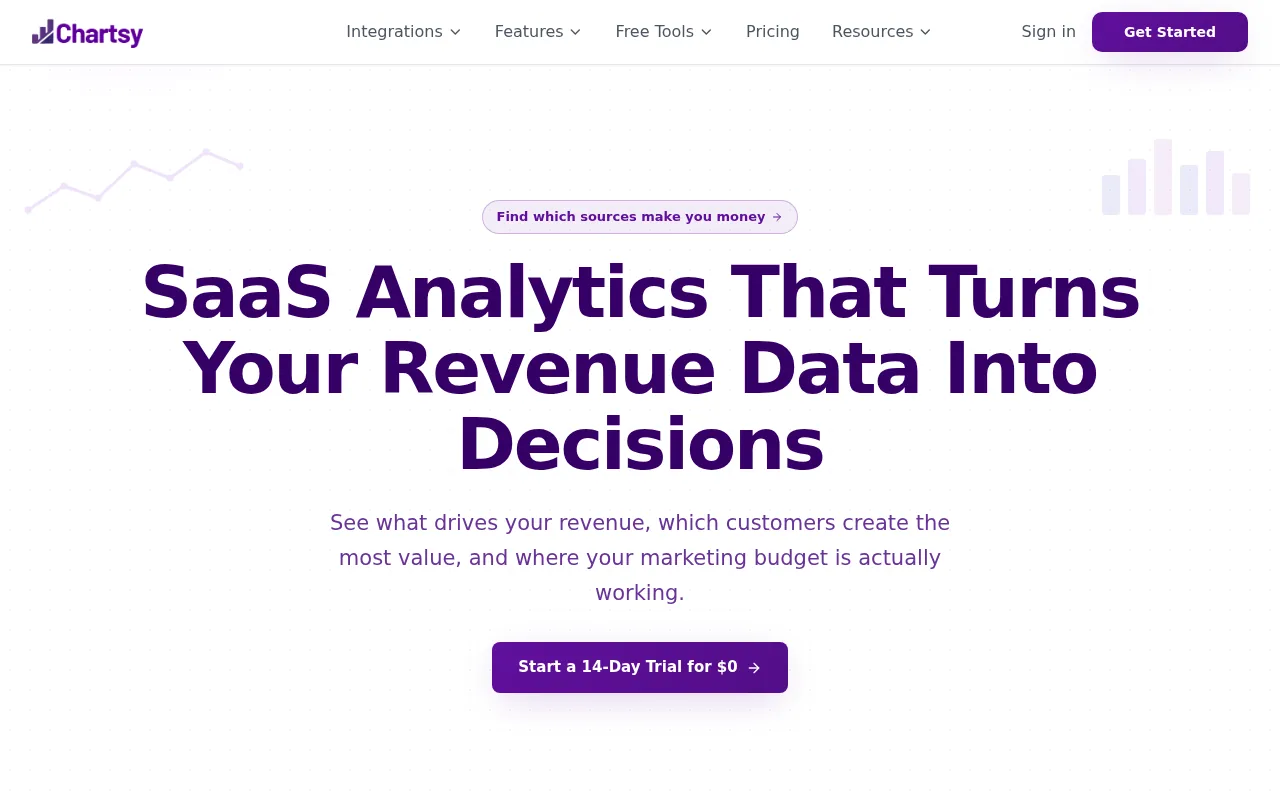
Chartsy tracks UTM values, click IDs, and referral sources. A signup keeps its first-touch source, then Chartsy matches that signup with the related subscription and transaction data. You can compare visitors, signups, paying customers, new MRR, lifetime revenue, and churn by source.
That joined view solves a common reporting gap. Website analytics may show that one campaign brought 2,000 visitors. Billing data may show another source brought ten customers who stayed active. Chartsy lets you compare those outcomes in one place instead of joining spreadsheets by hand.
It also supports natural-language questions about subscription and acquisition data. A founder can ask which source added the most MRR or which channel has the highest churn, then inspect the chart behind the answer.
The limit is scope. Chartsy is aimed at subscription businesses, so it may not fit a large retail brand that needs broad media mix modeling across television and physical stores. For a SaaS founder who wants acquisition and billing data together, that narrow focus is useful.
See the Growth view for channel revenue attribution to see how the source-to-MRR path is laid out.
2. Google Analytics 4, A free starting point for basic attribution
Google Analytics 4 is a free starting point for teams that want to track which marketing channel drives paying customers without buying a dedicated attribution product.

GA4 can collect events such as page views, form submissions, signups, and purchases. It also supports data-driven attribution, which uses available event data to assign credit across touchpoints. Google explains how its attribution settings work in its official Analytics attribution documentation.
For a small team, that can be enough to answer early questions. Which landing page gets signups? Which campaign leads to a trial start? Which source appears before a conversion? You can also build explorations that compare acquisition channels across a selected date range.
GA4 is strongest when your conversion path is short and your event setup is clean. Set up separate events for the first call to action, signup completion, trial start, and paid conversion. If every action is treated as one generic conversion, the report won't explain where people drop out.
The tradeoff is that GA4 does not automatically become a SaaS revenue ledger. You still need to connect customer identity with billing records if you want MRR, lifetime revenue, refunds, or churn by acquisition source. Its interface can also feel hard to read when a founder only wants three numbers: visitors, revenue, and revenue per visitor.
Use GA4 when budget is the main constraint and your team can maintain event tracking. Move to a revenue-focused tool when manual joins start slowing down decisions.
3. Ruler Analytics, Closed-loop attribution for lean marketing teams
Ruler Analytics is aimed at teams beginning their attribution work or operating with limited budgets. Its main idea is closed-loop attribution, which connects marketing touchpoints with later lead or customer outcomes.

The tool is grounded in the gap between a form fill and a sale. A campaign may generate leads, but the sales team decides which leads become customers. Closed-loop reporting tries to carry the original source into that later stage so marketing can judge revenue rather than lead volume.
The setup depends on clean source fields and a reliable handoff between the website, CRM, and sales process.
It can suit a B2B company where a customer talks with sales before buying. The team can compare the source of leads with the source of closed deals, then review the gap. A channel that produces many low-quality leads may look very different once closed revenue becomes the measure.
The caveat is implementation work. CRM attribution breaks when records are duplicated, campaign names change, or sales reps skip source fields. It also may not be the best fit for a self-serve SaaS company that needs subscription changes and churn tied to each source.
Pick Ruler Analytics when your main question is which marketing sources turn into sales outcomes inside a CRM.
4. Dreamdata, B2B SaaS revenue attribution across long buying journeys
Dreamdata is positioned for B2B SaaS revenue attribution. It fits teams with longer buying journeys, several people involved in one account, and more than one marketing touch before a deal closes.
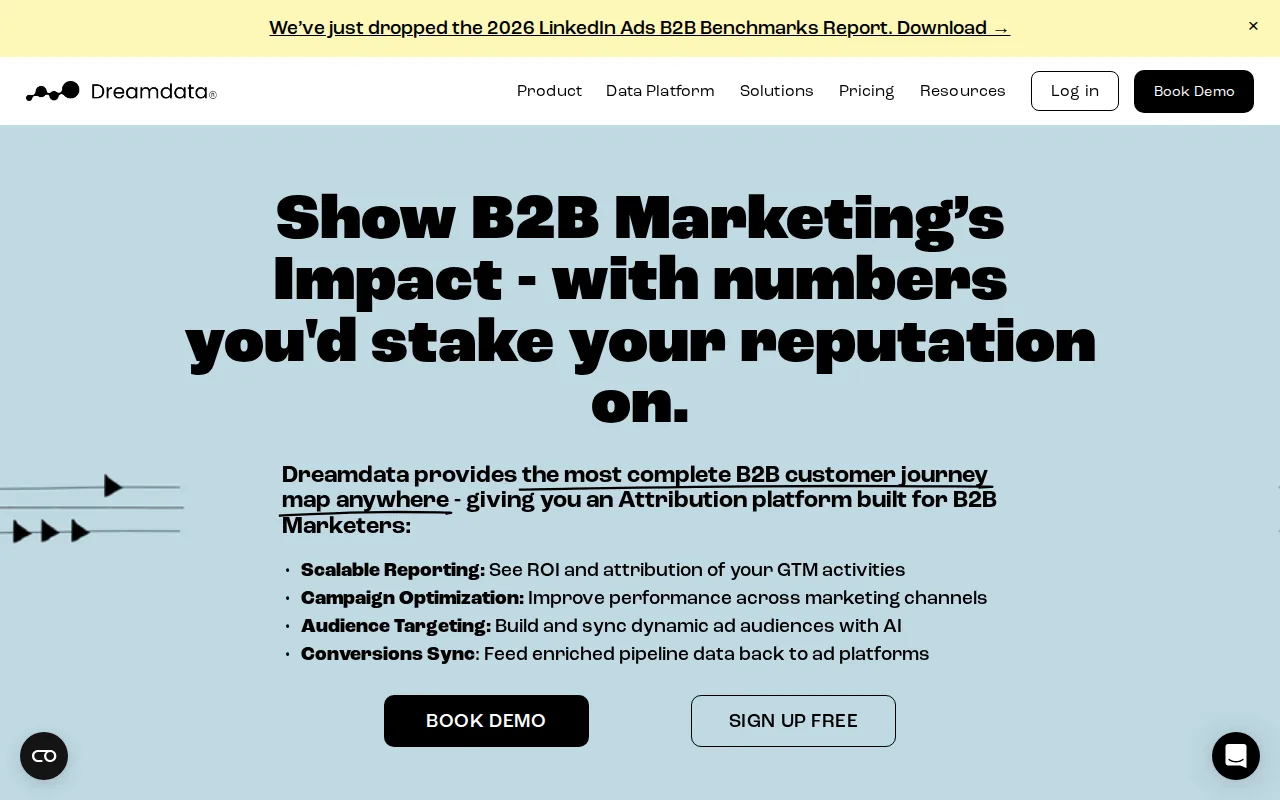
That matters because a B2B account rarely behaves like a single click followed by an instant payment. Someone may read a report, return through search, join a webinar, speak with sales, and bring in two other people before the account buys. A tool designed around account-level revenue can give that journey more context than a last-click report.
Dreamdata is best considered when the business needs to connect marketing activity with pipeline and revenue. The useful output is not simply “this campaign got credit.” It is a view of which accounts moved forward and which sources appeared across those account journeys.
Long journeys bring a measurement problem, though. More touchpoints mean more chances to count the same influence twice. Your team needs a stated attribution rule, a shared definition of sourced pipeline, and a review habit that checks account data against closed revenue.
Dreamdata is a better match for account-based B2B teams than for a solo founder who only needs source-to-subscription reporting. The more complex the buying path, the more useful an account view can become.
5. HockeyStack, Revenue analytics for B2B SaaS go-to-market teams
HockeyStack is positioned as a revenue platform for B2B SaaS go-to-market teams. It belongs on a shortlist when marketing, sales, and revenue operations need a shared view of the customer journey.

The B2B use case is about more than finding the last page someone visited. Teams need to see how campaigns relate to account movement, pipeline, and closed revenue. That gives marketing a better basis for budget talks than raw impressions or page sessions.
HockeyStack can make sense for a company with several teams reviewing the same funnel. Marketing may ask which program influenced an account. Sales may ask what content appeared before a meeting. Revenue operations may want to compare those records with the final deal value.
That shared view comes with a cost in setup and governance. The team has to agree on account names, campaign rules, stage definitions, and the point at which an opportunity counts as influenced. If each department uses a different definition, the dashboard will show disagreement in chart form.
It is also more than many small SaaS teams need. A self-serve product with a short signup path may get faster answers from a lighter tool that joins website sources to billing data.
Choose HockeyStack when the central question is how marketing activity relates to B2B revenue across a go-to-market process.
6. HubSpot Attribution, A usable choice for HubSpot-centered teams
HubSpot Attribution is a sensible choice for teams that already run their marketing, CRM, and sales work in HubSpot. It uses a multi-touch approach within that system.
The main benefit is fewer handoffs between tools. Campaign activity and contact records sit in the same general workspace, so a team can connect marketing interactions with later lifecycle stages. That is useful when the question is which source influenced a lead, opportunity, or customer.
It can also help a marketing manager spot a weak landing page. Suppose a paid campaign sends steady visits but few form submissions. A report that includes the landing-page event can point the team toward the page rather than prompting an immediate budget cut.
Good setup still matters. Add clear conversion events for form completion, demo requests, trial starts, and paid conversion. Use consistent campaign names. Keep a record of which attribution model the team uses, because changing the model can change the reported winner without changing customer behavior.
The limitation is the center of gravity. HubSpot Attribution works best when HubSpot holds the key customer and marketing records. A subscription business that needs Stripe or Paddle revenue, plan changes, failed payments, and churn by source may need a separate revenue analytics layer.
Pick this option when your existing HubSpot data is complete and the team wants attribution inside its current workflow.
7. Rockerbox, Multi-channel measurement with CRM and offline data
Rockerbox is aimed at B2B companies that need attribution tied to CRM revenue. Its listed data sources include marketing platforms, data warehouses, CRM systems, television, radio, and direct mail.
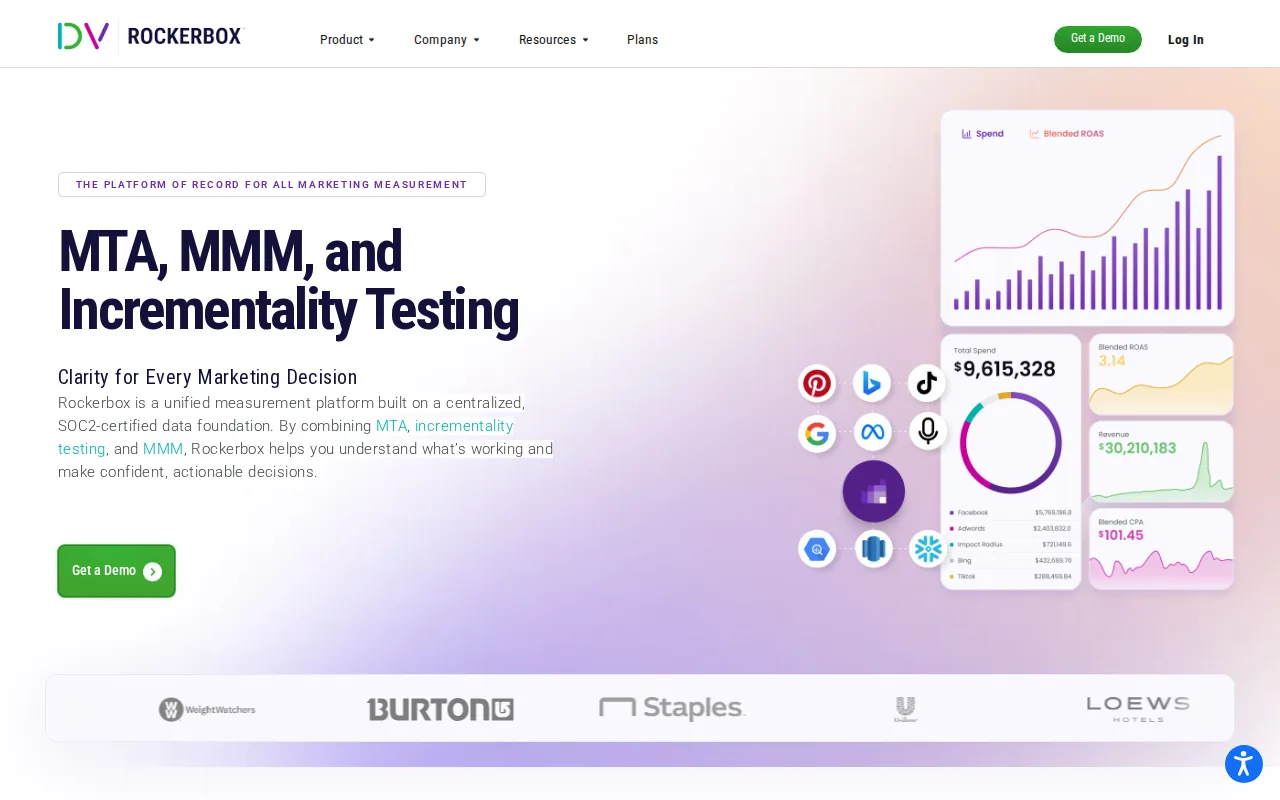
That broad source mix matters when digital clicks are only one part of demand generation. A company may run a paid campaign beside a trade event, direct mail push, or broadcast ad. If the reporting system only sees web clicks, it may assign too much credit to the channels that are easiest to track.
Think of the choice this way. Person-level attribution asks which tracked journey preceded a conversion. Media mix modeling asks how changes in channel investment relate to changes in overall results. The two views can answer different questions.
The drawback is data work. Offline channels need dates, spend records, geographic scope, and a business outcome that can be compared over time. Without those fields, the model may produce a polished chart with weak inputs.
Rockerbox suits a company with a mixed media plan. It is likely too broad for a founder who only needs to connect a website signup with a subscription record.
8. Northbeam, Hybrid attribution for enterprise omnichannel campaigns
Northbeam is positioned for enterprise companies running omnichannel marketing campaigns. Its listed method combines hybrid multi-touch attribution with media mix modeling.
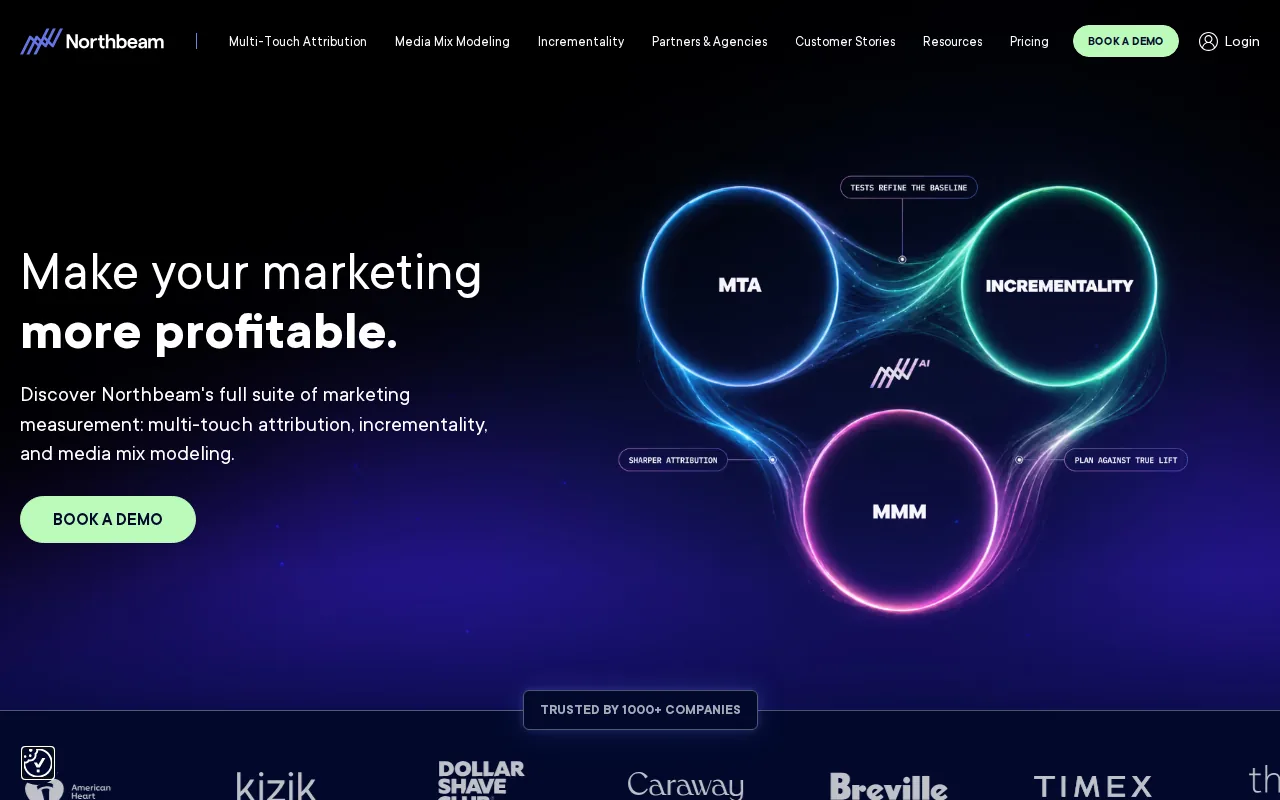
That combination gives an enterprise two views of performance. Multi-touch reporting can inspect tracked interactions. Media mix modeling can help assess channels where person-level data is limited or where many exposures happen outside a direct click path.
Northbeam also lists machine learning insights. That may help a large team spot patterns across many campaigns, but AI does not remove the need for sound inputs. If spend data is late or campaign names are inconsistent, automated suggestions still rest on weak records.
Northbeam is therefore best for an enterprise team with enough data volume to support more than one measurement method. Smaller teams may spend more time maintaining the system than acting on its findings.
Use it when your campaign mix crosses channels and your finance, marketing, and analytics teams need both granular and aggregate views.
9. AdBeacon, Real-time attribution insights for multi-channel marketing teams
Real-time reporting can help during an active campaign. A team can watch whether a new source is generating visits, conversions, or revenue signals instead of waiting for a month-end report. That is most useful when someone has the authority to change the campaign while it is running.

The live view also needs careful interpretation. Early data often contains visits without enough paid conversions to judge customer quality. A channel can look weak on day three, then produce strong customers after a longer trial period.
AdBeacon may fit an agency or multi-brand marketing team better than a solo SaaS founder.
The wider category adds a caveat: real-time reporting is uncommon among attribution tools generally, and vendors define "real time" inconsistently, so ask how often data actually refreshes and which sources update immediately before you rely on it mid-campaign.
Choose AdBeacon if fast campaign feedback is more important than a billing-first view of subscription retention.
Compare the best tools for tracking paying customers by marketing channel
The right choice depends on where your trusted revenue record lives and how long the buying journey lasts. This table focuses on the decision point, not on a feature count.
| Tool | Best fit | Strongest question | Main watch-out |
|---|---|---|---|
| Chartsy | Small SaaS teams using Stripe or Paddle | Which source produced MRR and retained revenue? | Focused on subscription businesses |
| Google Analytics 4 | Teams starting with a free option | Which events and sources precede conversion? | Billing joins need extra setup |
| Ruler Analytics | Lean teams with CRM-led sales | Which sources become closed revenue? | CRM hygiene affects results |
| Dreamdata | B2B SaaS with long account journeys | Which account touchpoints relate to revenue? | More touchpoints mean more model choices |
| HockeyStack | B2B SaaS go-to-market teams | How does marketing relate to pipeline? | May be too broad for self-serve SaaS |
| HubSpot Attribution | HubSpot-centered teams | Which interactions influence lifecycle stages? | Works best with HubSpot as the main record |
| Rockerbox | B2B teams with offline and digital media | How do mixed channels relate to revenue? | Offline data takes planning |
| Northbeam | Enterprise omnichannel teams | What do granular and aggregate models show? | Higher data and setup demands |
| AdBeacon | Multi-channel teams needing fast feedback | What is changing during a live campaign? | Real-time data may arrive before revenue matures |
For a SaaS founder, the strongest first test is simple: can the tool connect the acquisition source to a real customer record and then to recurring revenue? If the answer stops at clicks or leads, you still have a reporting gap.
What to look for when choosing a marketing attribution tool
Start with the outcome you need to explain. “Which campaign got the most traffic?” is a different question from “Which source added the most MRR after churn?” Pick a tool that stores the fields needed for your answer.
Once the data is in front of you, the actual comparison across channels needs its own rule, not just a sorted table. A fast paid-search campaign and a slow-building SEO article will look wildly uneven if you compare them at the same point in their lifecycle — the search campaign has already produced most of the MRR it ever will, while the article's best months are still ahead. Normalize by channel maturity (how long each source has had to convert and retain) before declaring a winner, and re-run the comparison at 30, 60, and 90 days rather than deciding off week-one numbers.
- Source capture: Check support for UTMs, click IDs, referrers, and direct traffic.
- Identity: Confirm how a first visit stays linked to a signup across subdomains.
- Revenue join: For SaaS, check whether subscriptions and transactions can connect to the customer source.
- Model clarity: Know whether the report uses first-touch, last-touch, linear, time-decay, position-based, or data-driven attribution.
- Time window: Match the lookback period to your sales cycle and trial length.
- Retention: Check whether the tool can compare churn or retained revenue by source.
- Privacy: Review consent, cookie rules, access controls, and data retention before tracking person-level journeys.
First-touch attribution is useful for learning what created awareness. Last-touch helps identify what preceded the final action. Linear attribution spreads credit across touchpoints, while time-decay gives more weight to recent interactions. Position-based models usually give greater weight to the first and last touch.
Don't treat any model as proof that one channel caused a purchase. Attribution is a measurement rule applied to tracked behavior. Use it to form a budget hypothesis, then test that hypothesis with a focused campaign change.
Key Takeaway: Judge every channel at four points: paying customers, new MRR, retained revenue, and acquisition cost. Traffic alone can't tell you which source deserves more budget.
For a SaaS business, Chartsy puts this decision chain in one view by connecting website sources with Stripe or Paddle outcomes. Its SaaS revenue attribution feature is most relevant when the payment record is the source of truth.
FAQ
How do I track which marketing channel drives paying customers?
Track a visitor's source, connect that source to the signup, then match the signup with the later payment record. Use UTMs for campaigns and preserve the first-touch value through the signup flow. For SaaS, add MRR, lifetime revenue, and churn so you can judge customer quality instead of counting leads alone.
What is the best attribution model for paying customers?
There is no single best model for every business. First-touch helps measure awareness, while last-touch shows what preceded conversion. Linear, time-decay, position-based, and data-driven models answer different questions. Compare at least two views, then use customer revenue and retention to check whether the reported winner is worth more budget.
Can Google Analytics track revenue by marketing channel?
Google Analytics can track conversion events and assign source information, but SaaS revenue attribution may need extra work. You must connect the analytics identity with the billing customer if you want MRR, refunds, plan changes, or churn by source. GA4 works well as a starting layer, especially when the team can maintain its event setup.
Why is revenue per visitor useful for channel attribution?
Revenue per visitor shows the value created by each site visitor from a source. A channel with many visits may produce less revenue than a smaller source with stronger conversion or retention. Compare revenue per visitor beside total customers and MRR, since a small sample can look unusually strong before enough customers have paid.
How do I track offline marketing channels?
Track offline channels by adding campaign dates, spend, geography, audience, and a matching customer or revenue outcome. CRM fields can connect a direct-mail response or event lead to later revenue. Aggregate methods such as media mix modeling can help when person-level tracking is unavailable, but the result depends on complete and consistent input data.
Conclusion
Choose the tool that reaches the deepest trustworthy point in your funnel. For a small SaaS team, start with a source-to-signup-to-Stripe or Paddle view, then compare MRR and retention by channel. Set up three or four key sources first, test the data with a sample signup, and review the result before changing your budget.

Written by
Chartsy TeamThe Chartsy Team writes guides, product updates, and resources to help SaaS and eCommerce founders make sense of their metrics, without SQL or spreadsheets.
Chartsy