
Traffic, product behavior, subscription revenue, and multi-touch B2B attribution are different analytical jobs. The popular advice to choose the tool with the longest feature list usually creates a more expensive version of the same blind spot. A founder who needs to know which source produced paying customers doesn't necessarily need a product analytics suite, while a product team investigating activation may learn little from an MRR dashboard.
The useful comparison is more practical. Can the tool connect marketing sources and signups to paying customers? Can it explain new revenue, expansion, contraction, and churn? Does it support Stripe, Paddle Billing, or Paddle Classic? How much technical instrumentation does it require? Is pricing understandable, and can a small team use the reports without a dedicated analyst?
Attribution also needs careful wording. It identifies relationships in tracked data, not guaranteed causation. A source associated with a signup and later payment may deserve investigation, but the data doesn't prove that source alone caused the purchase. This distinction matters even more when privacy changes, consent rejection, cookies, or incomplete event coverage leave gaps in source tracking, as discussed in this guide to B2B SaaS analytics tools.
The list below compares SaaS analytics tools by the business question they answer, not by the number of charts they advertise. For a broader view of accessible analysis, see this guide to AI data analytics for non-technical users.
Table of Contents
- 1. Chartsy
- 2. ChartMogul
- 3. Baremetrics
- 4. ProfitWell Metrics by Paddle
- 5. Mixpanel
- 6. Amplitude
- 7. PostHog
- 8. Heap
- 9. Dreamdata
- 10. HockeyStack
- Top 10 SaaS Analytics Tools Comparison
- Choose the Smallest Tool That Answers Your Question
1. Chartsy
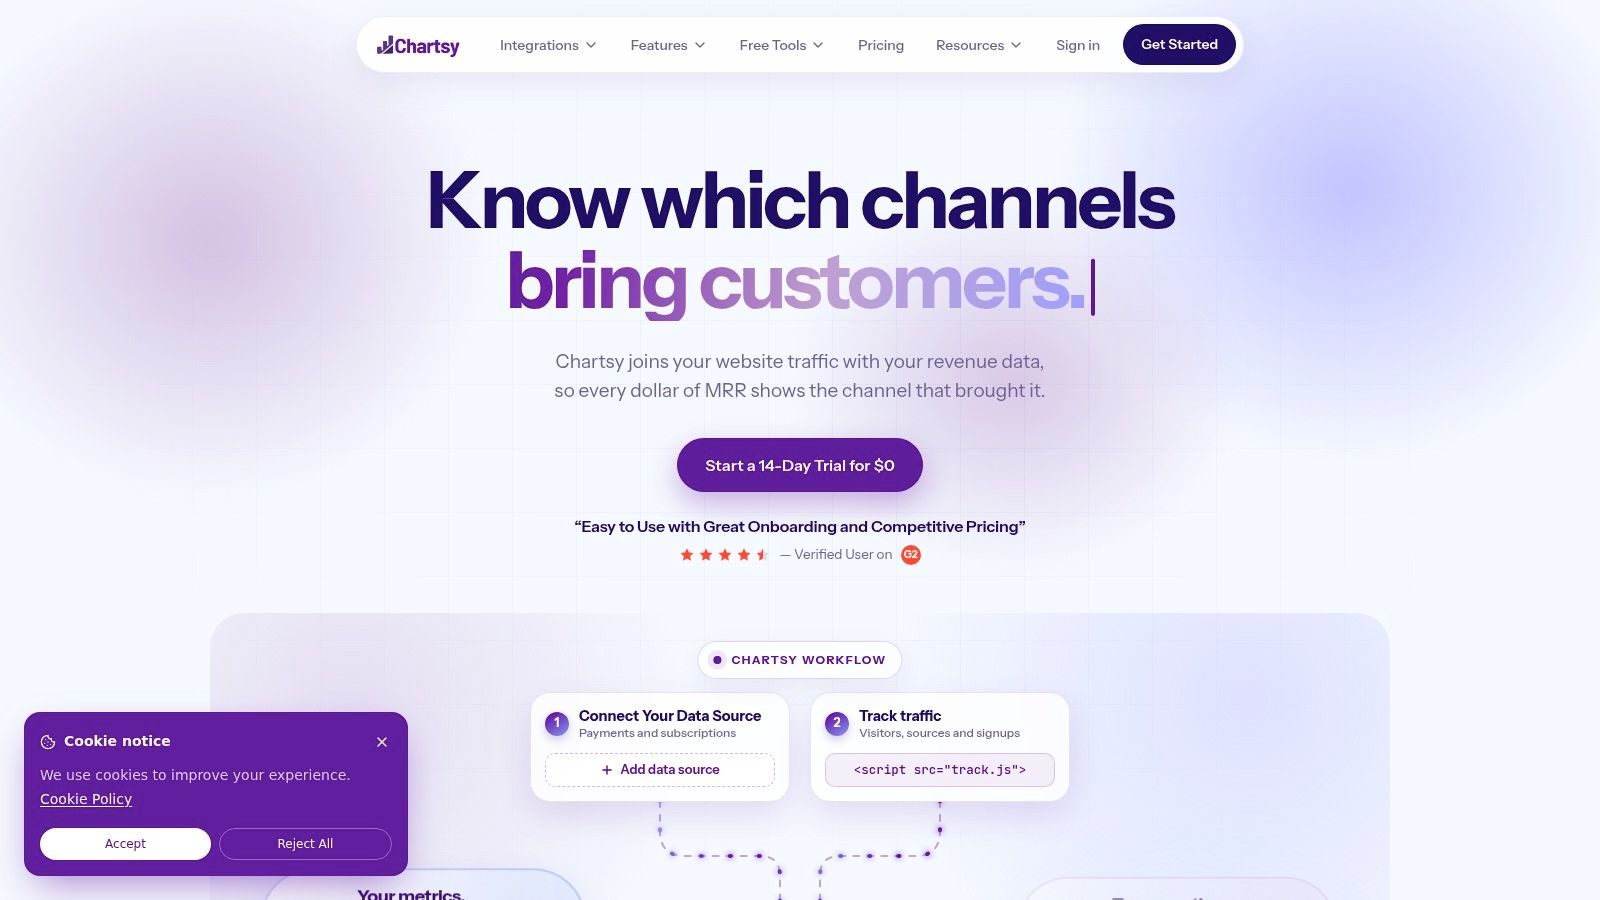
Best for: founders and small SaaS teams that need to connect acquisition activity with subscription revenue.
Chartsy answers a question that many analytics stacks leave unresolved: which marketing sources bring paying customers and recurring revenue? It joins website visits and signup tracking with billing data from Stripe, Paddle Billing, and Paddle Classic, giving a small team a path from source to signup, paying customer, and subscription revenue.
That makes it different from a billing dashboard that starts after conversion, and from a product analytics tool that may show extensive in-app behavior without explaining which sources produce revenue. Chartsy also breaks MRR movement into new revenue, expansion, contraction, and churn, so a change in MRR becomes a set of movements to investigate rather than one unexplained line.
Why small teams choose it
The setup is designed to avoid a heavy BI project. A lightweight tracking script captures sources and signups, billing connections are read-only, and custom dashboards let teams keep the reports they use. Its AI assistant accepts plain-English questions and can create charts and explanations without SQL, which is useful when the person investigating growth is also running marketing, operations, or customer support.
A hypothetical example makes the distinction clear. If signups from a newsletter rise and MRR falls, Chartsy can help compare those signups with paying customers and examine whether the movement came from new subscriptions, downgrades, or churn. It can't prove that the newsletter caused the outcome, and it can't know why a customer cancelled unless that reason exists in the connected data.
Practical rule: Treat attribution as a way to prioritize investigation, not as proof that one channel caused revenue.
Chartsy offers a demo without signup and a 14-day free trial at $0 with no card required, according to its stated product information. The trade-off is scope. Billing support is centered on Stripe and Paddle, and teams using another billing platform should confirm compatibility. Enterprise teams that need highly customized BI or complex data modeling may also outgrow its lightweight approach.
For founders, the central advantage is coherence. Acquisition, signups, MRR, customer growth, and churn sit in one workflow, with plain-English analysis available to people who don't write SQL.
2. ChartMogul
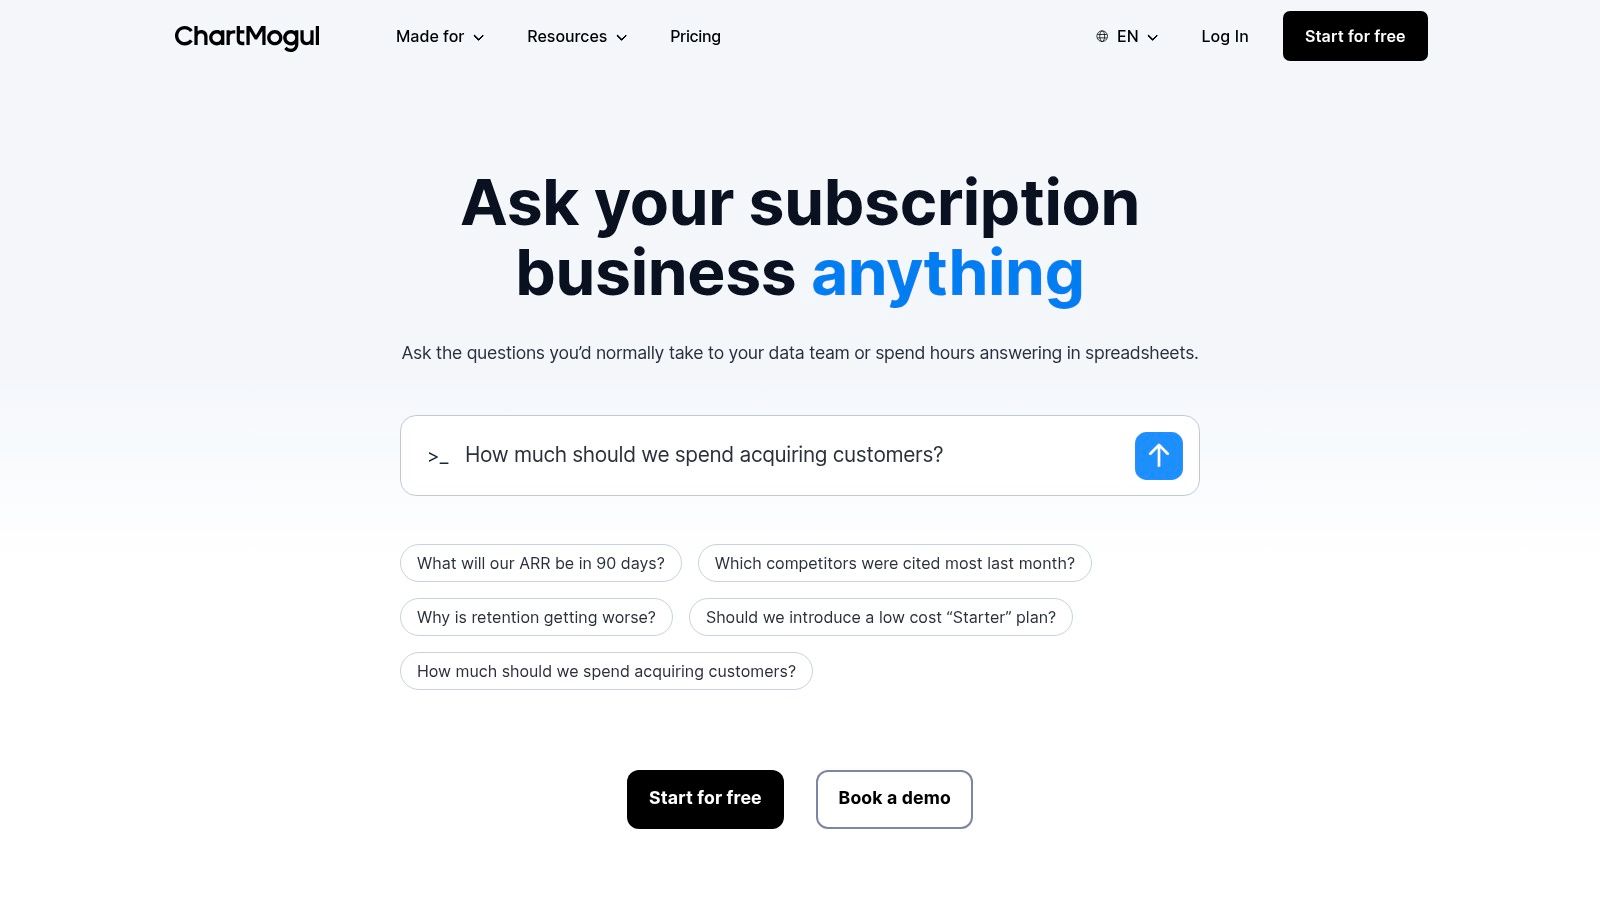
Best for: teams whose main question is how subscription revenue is changing across plans, cohorts, and billing sources.
ChartMogul is purpose-built for subscription analytics. It standardizes metrics such as MRR, ARR, churn, LTV, and cohorts across billing systems including Stripe, Paddle, Chargebee, and Recurly. Its strongest use case is not first-touch marketing attribution. It's building a reliable subscription revenue view when billing data is spread across sources or includes more complex plan structures.
The platform supports subscription movement analysis, including new, expansion, contraction, and churn. That decomposition is valuable because total MRR can hide opposing movements. New customers may be adding revenue while downgrades reduce it, or overall growth may look stable while churn worsens among a particular cohort.
The trade-off for acquisition teams
ChartMogul has a flexible data model and API-backed options for custom sources. It also supports enrichment and workflows through applications such as its Stripe App, Slack, and Zendesk connections. Those capabilities suit finance and revenue operations teams that need subscription KPIs without assembling the calculations themselves.
The limitation is analytical starting point. If your first question is “which content source produced this paying customer?”, ChartMogul may need to be paired with website or marketing attribution software. If your first question is “what changed in recurring revenue, and which customer segments explain it?”, its focus is much closer to the problem.
Pricing based on tracked ARR can be sensible for a revenue-focused business, but the cost basis deserves attention as the company grows. A founder should compare not only the initial subscription price, but also how the pricing model behaves as more recurring revenue enters the system.
Read this Chartsy versus ChartMogul comparison if the decision comes down to acquisition-to-revenue attribution versus deeper subscription reporting.
3. Baremetrics
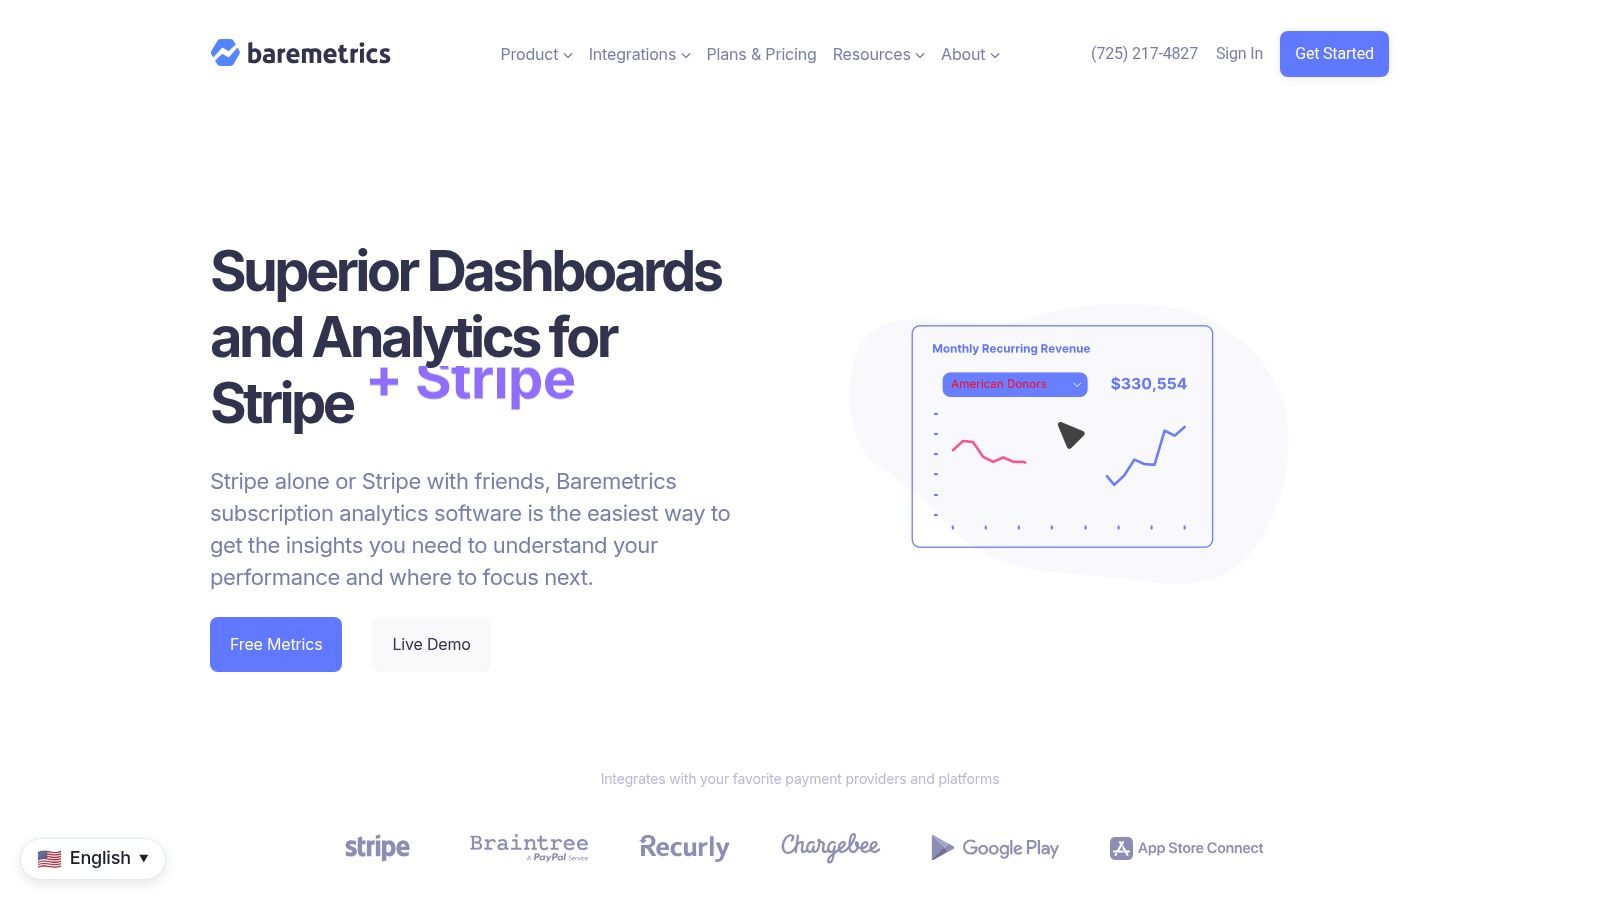
Best for: Stripe-centered SaaS businesses that want subscription dashboards and payment recovery in the same product family.
Baremetrics focuses on subscription reporting, with core metrics, cohorts, segmentation, and dashboards designed for SaaS operators. Its Payment Recovery add-on gives it a distinct angle. Rather than only reporting that failed payments contributed to churn, the product also supports a dunning and recovery workflow tied to payment outcomes.
That distinction matters because revenue churn can have different observed paths. A customer may voluntarily cancel, or a payment may fail and eventually become unpaid. Billing-linked analytics can distinguish these movements more effectively than website analytics because it sees subscription and payment status.
Where it fits
Baremetrics is attractive when a Stripe-based team wants a quick route to MRR and churn reporting without building a general BI model. Its integrations include Stripe, App Stores, Recurly, Shopify, and an API for custom billing sources. For this article's SaaS focus, the relevant question is whether the team's billing setup is primarily supported by Stripe or another compatible source.
The product is less suitable as a complete accounting or enterprise data model. Complex multi-entity reporting may require another system, and teams using Paddle should confirm the current integration path rather than assume native support. It also doesn't solve every acquisition question. A dashboard can show revenue by customer segment, but source-to-paying-customer attribution depends on what marketing and signup data the team sends into the wider stack.
A payment recovery tool can show that failed payments are part of revenue loss. It can't, by itself, explain every customer motivation behind cancellation.
The main choice is therefore between revenue recovery plus subscription reporting and a broader acquisition view. Founders who already trust their Stripe data and need to reduce payment-related leakage may prefer Baremetrics. Teams trying to connect website source, signup, customer, and MRR in one view should compare the required tracking work before committing. This Chartsy versus Baremetrics comparison addresses that specific difference.
4. ProfitWell Metrics by Paddle
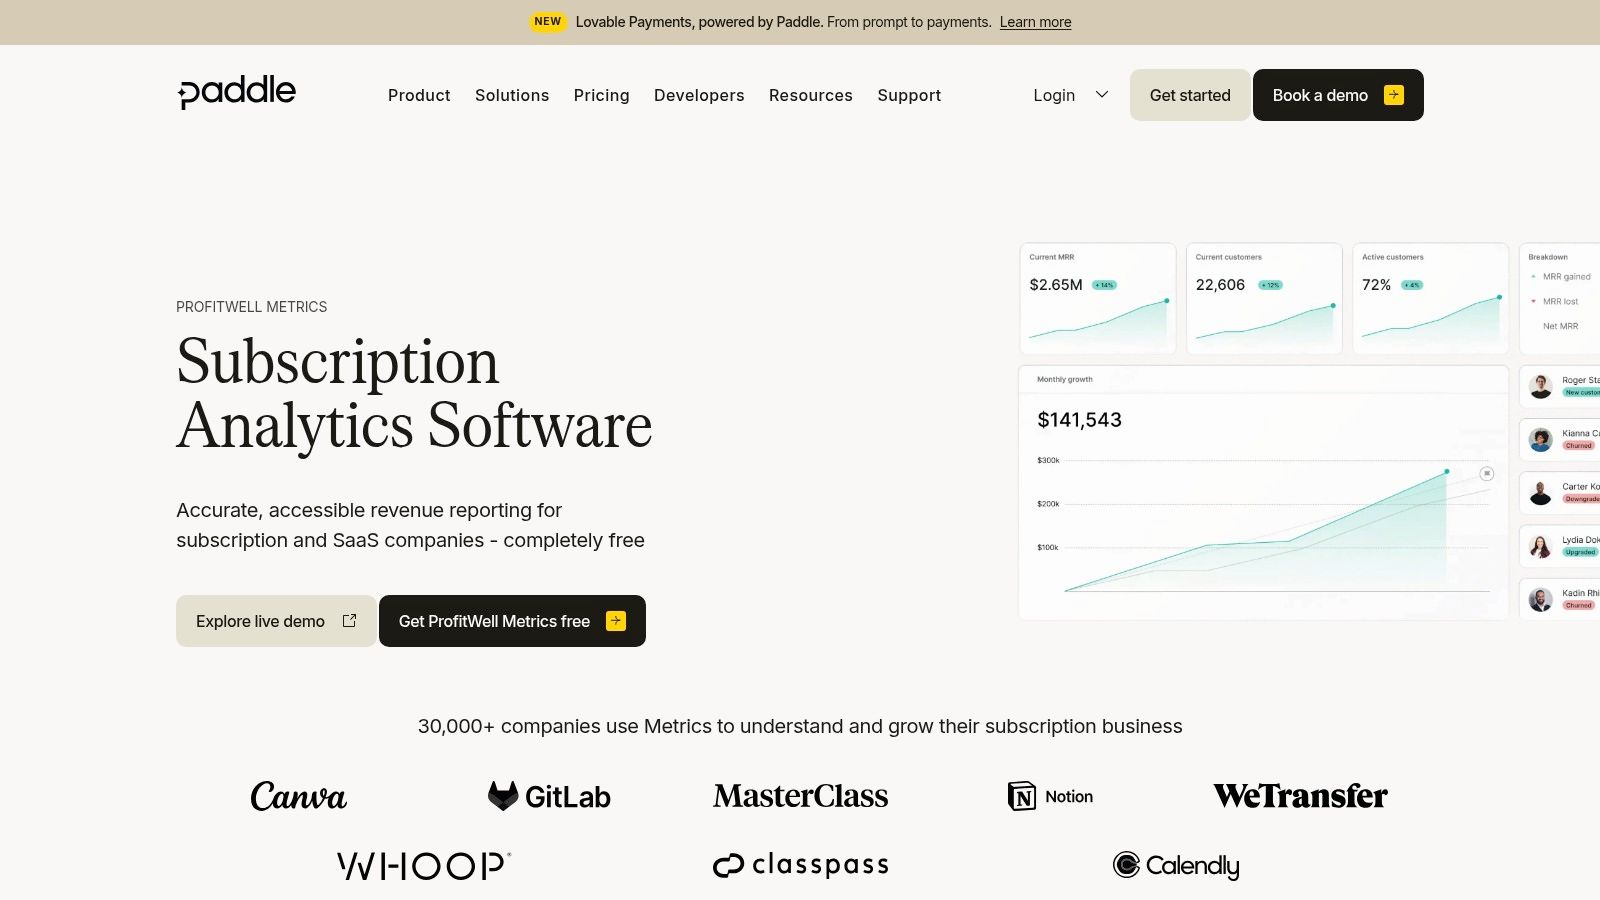
For a Paddle-based team, ProfitWell Metrics is often the cheapest first step for subscription reporting. Its fit is clearest for small SaaS companies that need a billing baseline without building a data warehouse or adopting a larger analytics platform.
ProfitWell Metrics is Paddle's subscription analytics product. Paddle's integration materials state that Metrics is included with Paddle Billing, while its support materials describe it as a free product covering MRR, churn, upgrades, downgrades, customer lifetime value, active customers, and revenue per customer.
That combination gives Paddle customers a low-friction starting point. The billing relationship already exists in the same ecosystem, so the setup burden should be lower than assembling separate billing exports, identity rules, and reporting logic. Its pricing is also easier for a small team to assess because the product is described as free, although the relevant question remains whether its supported model matches the company's reporting needs.
The business question it answers
ProfitWell Metrics answers, “How is recurring revenue changing?” It can expose MRR movements and customer-level subscription indicators, helping a founder examine churn, expansion, contraction, and customer value from billing data.
It does not, by itself, answer, “Which acquisition source produced these paying customers?” Connecting marketing source, signup activity, customer identity, and later revenue requires additional tracking and attribution work. Teams on Stripe, or teams with billing data outside Paddle's supported path, should confirm compatibility before treating it as a ready-made reporting layer.
Paddle's own Metrics and billing integration information is the right place to check how the current product connects with Paddle Billing. Teams using Paddle Classic should verify their setup before planning a reporting workflow.
Choose ProfitWell Metrics for a free, billing-first view of subscription performance. Choose Chartsy when acquisition-to-revenue attribution is the larger question. This Chartsy versus ProfitWell comparison provides a side-by-side breakdown. The trade-off is setup simplicity versus a wider view of how acquisition activity relates to paying customers and recurring revenue.
5. Mixpanel

Best for: product teams investigating funnels, retention, cohorts, and in-app behavior.
Mixpanel starts with events rather than billing. Its funnels, retention reports, cohort analysis, templates, and integrations help product teams understand what users do inside a SaaS application. Questions such as “where do new users abandon onboarding?” or “which actions are associated with continued usage?” fit its model well.
That makes Mixpanel a complement to revenue analytics, not a direct substitute. A product event can show that a customer used a feature before renewing, but it doesn't automatically establish the marketing source that brought that customer or the MRR movement that followed.
The instrumentation decision
Mixpanel's event-based model rewards teams that define important events and properties carefully. The technical requirement isn't just installing a script. Teams need naming conventions, identity rules, ownership, and ongoing governance, otherwise a growing event catalog can become difficult to trust.
Its Growth and Enterprise plans, online checkout, and usage calculators make the buying process more self-serve than quote-only products. However, event volume affects the commercial decision, so a small team should estimate the events it needs rather than assume the entry point will remain the long-term cost.
A useful division of labor looks like this:
- Product questions: use Mixpanel for activation, feature adoption, funnels, and retention behavior.
- Revenue questions: use a billing-linked tool for MRR movements, upgrades, downgrades, and churn.
- Acquisition questions: use source and signup tracking that can connect with customer identity.
Mixpanel is a strong choice when product behavior is the main blind spot and someone can maintain instrumentation. It is a weaker first purchase for a founder whose immediate question is which acquisition sources produce paying customers.
6. Amplitude
Best for: teams that need advanced product analytics alongside activation and experimentation capabilities.
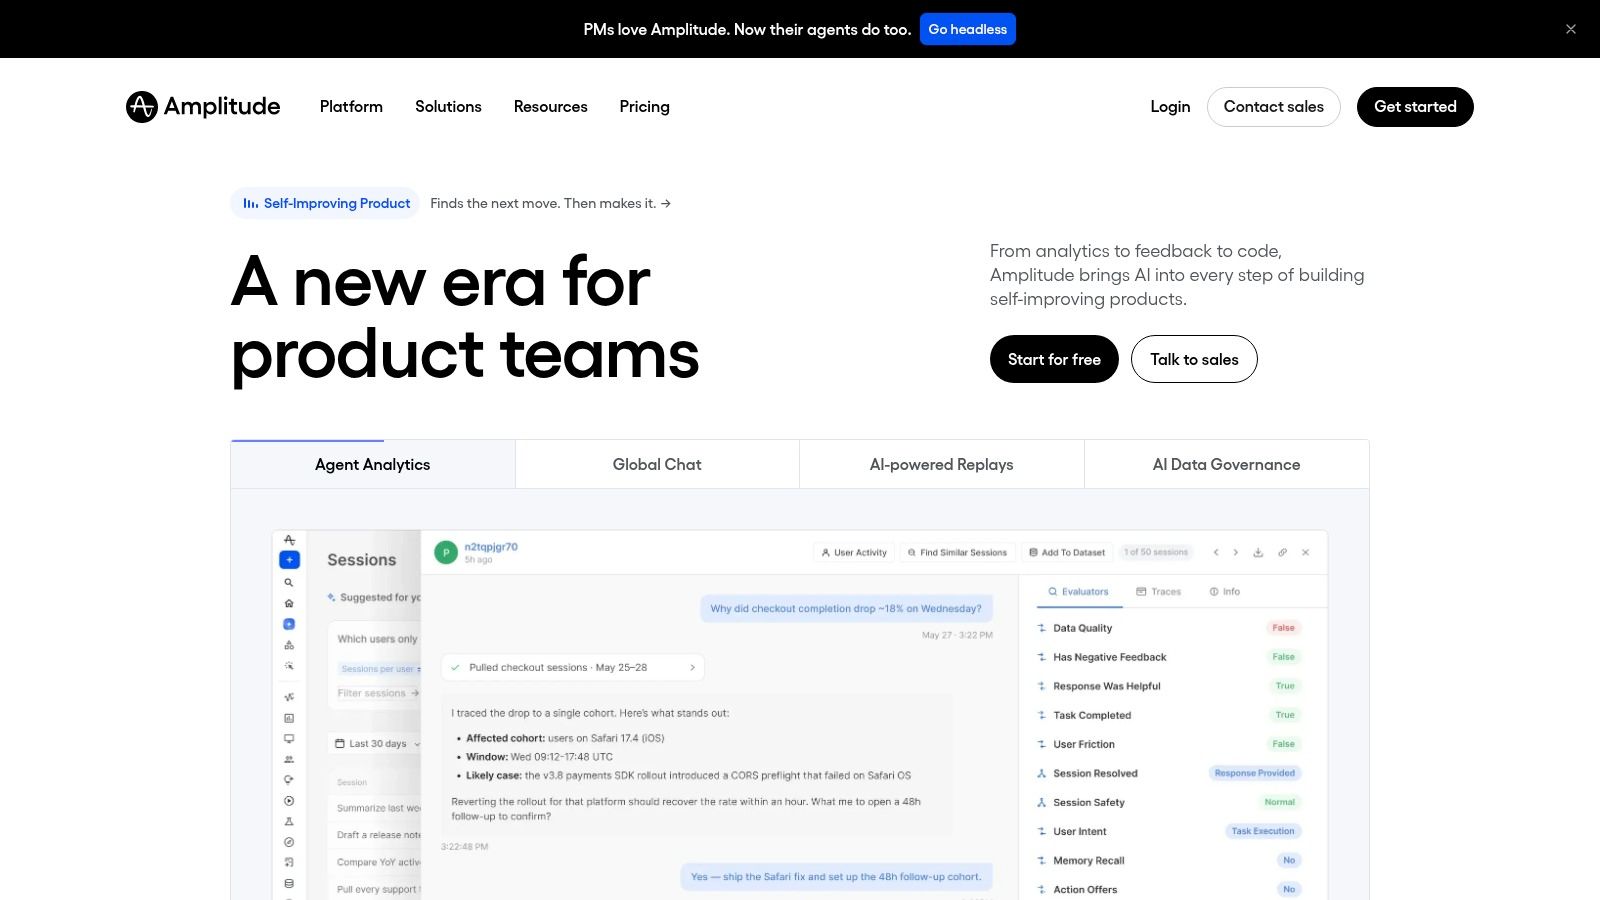
Amplitude offers a broad product analytics environment with behavioral cohorts, funnels, retention analysis, experimentation, activation capabilities, and an AI layer. It suits teams that want to understand product usage and then connect those insights to changes in the product experience.
The platform becomes especially useful when the question is behavioral and comparative. A product manager might investigate how different cohorts move through an onboarding flow, compare behavior after a release, or evaluate an experiment. Those are different from asking whether a paid campaign generated recurring revenue.
Depth comes with overhead
Amplitude offers multiple plans, including Free, Plus, Growth, and Enterprise, with add-ons available. It also promotes a startup program that can provide a free first year for eligible companies. These options can lower the initial barrier, but the relevant long-term issue is still usage, event volume, and the features a team needs.
Higher-tier capabilities, such as a behavioral cohorts API and advanced computations, can be valuable for teams with stronger data practices. They may be unnecessary for a solo founder who needs a small set of revenue and acquisition reports. A complex interface can create an ownership problem if nobody has time to maintain the underlying event definitions.
Amplitude is therefore a product intelligence choice, not automatically a company-wide revenue system. It can tell you what users did and help test changes, while Stripe or Paddle analytics tells you what happened to subscription revenue. To connect the two, the team must define identity and data relationships deliberately.
Choose it when activation, experimentation, and behavioral depth justify the setup. Don't choose it only because it has more analytical capabilities than a focused revenue tool.
7. PostHog
Best for: engineering-led SaaS teams that want product analytics, experimentation, and development tooling together.
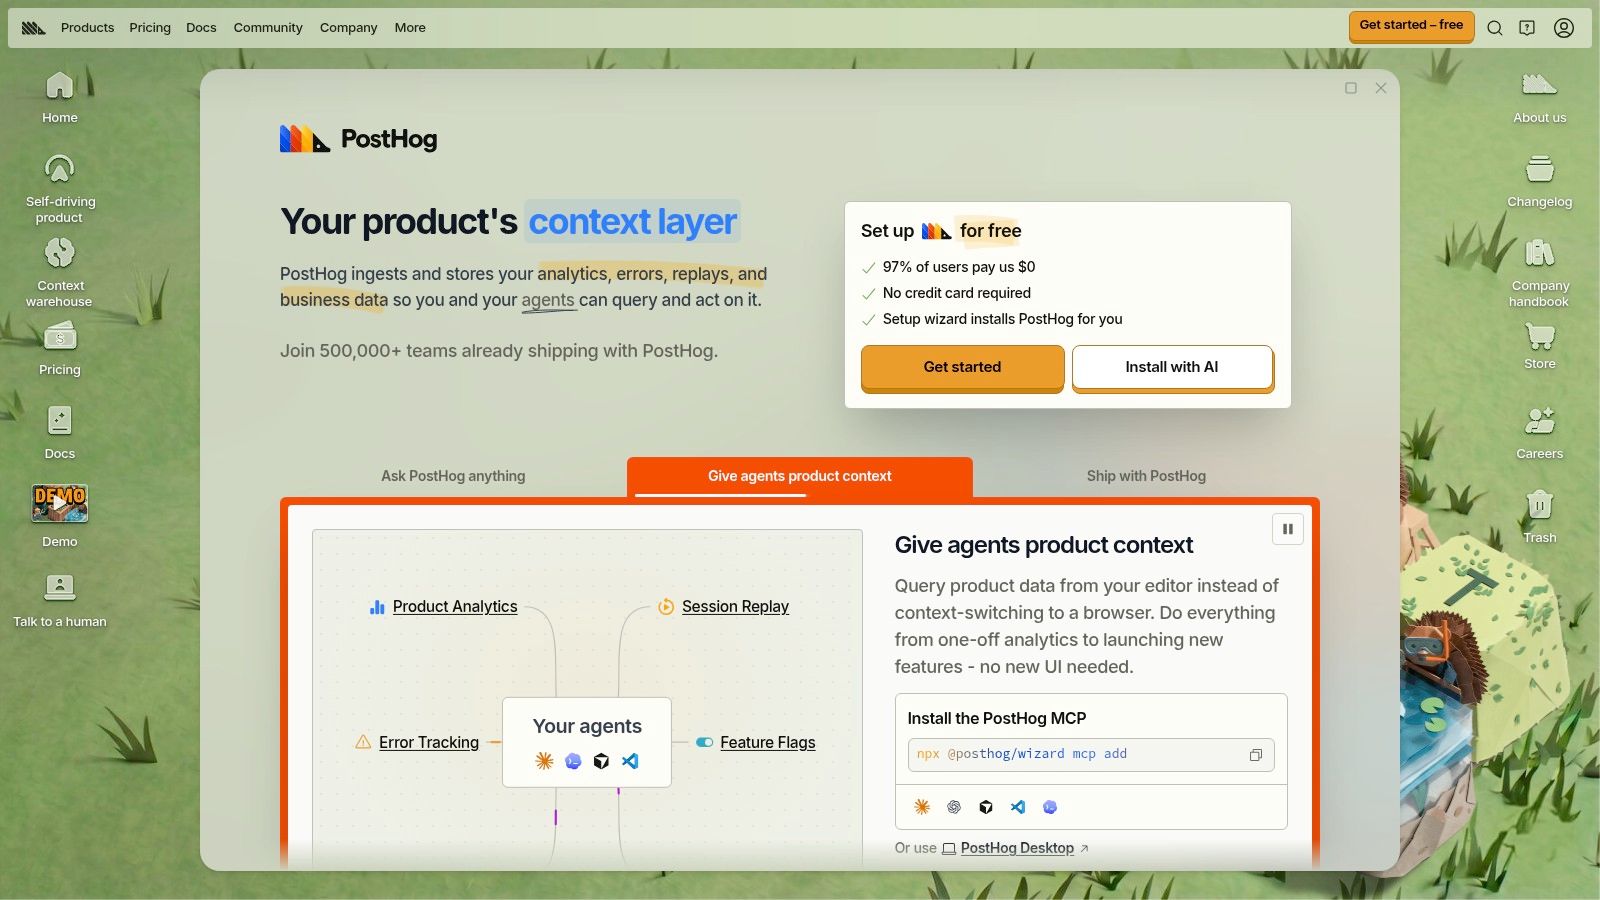
PostHog combines product analytics with feature flags, A/B testing, session replays, and error tracking. Its cloud and open-source deployment options appeal to teams that want control over how the stack is operated, while usage-based pricing and a generous free tier make it possible to start without committing to a large fixed contract.
The all-in-one approach changes the buying question. Instead of asking only whether PostHog has good funnels, an engineering team can ask whether consolidating product behavior, rollout controls, replay, and errors reduces the number of systems it must maintain.
A broad stack is still a stack
PostHog's breadth can create its own complexity. Each module needs sensible configuration, and teams must decide which events, properties, identities, and environments should be trusted. Open-source flexibility may also require more technical ownership than a small marketing or operations team wants to provide.
PostHog isn't purpose-built for subscription revenue analytics. It can help explain product behavior around a conversion or cancellation workflow, but MRR movement analysis still needs a billing-linked data source. Pairing it with Stripe or Paddle reporting may be appropriate when product behavior is the central question and revenue is a supporting one.
The commercial trade-off is between consolidation and focus. Engineering-led companies may value the ability to put several development and analytics workflows in one platform. A founder who only needs source-to-paying-customer attribution and subscription movement reports may be paying in complexity for capabilities that don't address the first decision.
PostHog is a good fit when the product team owns analytics implementation. It is less suitable as the only SaaS analytics tool for a non-technical team responsible for MRR and marketing reporting.
8. Heap
Best for: teams that want faster behavioral data capture and visual context from session replays.
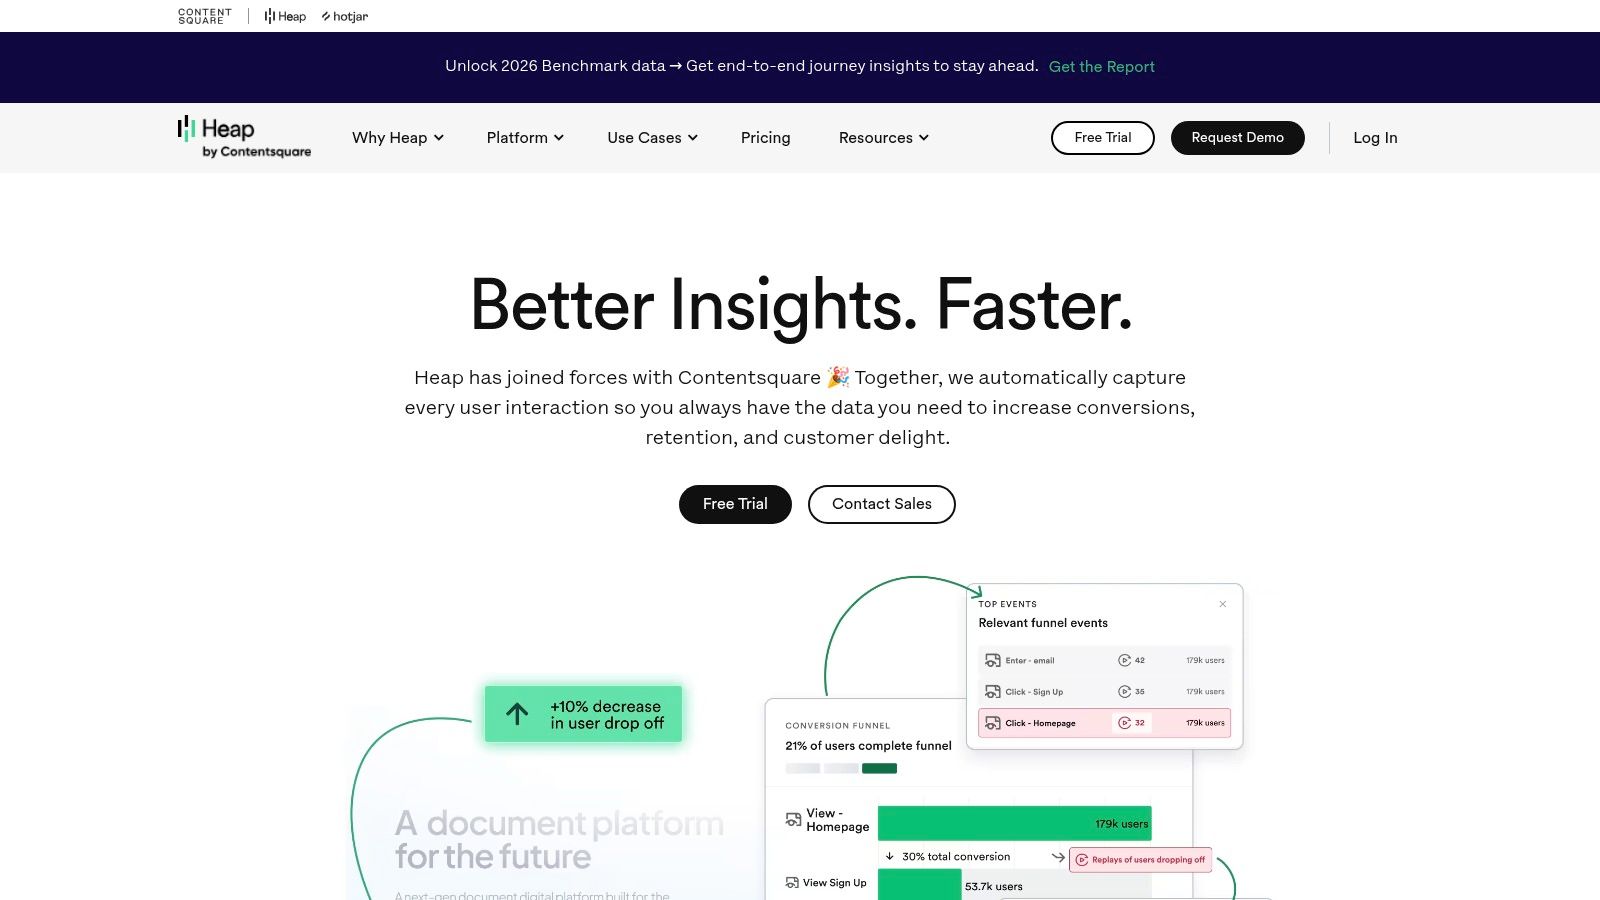
Heap focuses on automatic capture of user interactions, with governance controls intended to keep that broad collection usable. It combines product analytics with session replays and journey maps, helping teams move from “where did users stop?” to “what happened during the interaction?”
That can reduce the pressure to define every event before collecting useful behavioral data. A SaaS team might investigate a signup flow, inspect a journey, and then formalize the events that matter for ongoing reporting.
Automatic capture isn't automatic clarity
Autocapture reduces initial instrumentation effort, but it doesn't remove the need for governance. Teams still need to decide which interactions represent meaningful product actions, how identities are resolved, and which data should be retained or excluded. Without those decisions, a large volume of captured activity can make reports harder to interpret.
Heap's plan structure includes specified data history limits, and pricing commonly requires a sales conversation rather than a fully self-serve checkout. That makes pricing transparency a different trade-off from tools with public calculators or free entry plans. A small team should ask how data volume, retention, and replay usage affect the eventual cost.
Heap is a behavioral tool, not a billing analytics replacement. It can help explain what users did before a signup or cancellation, but it doesn't by itself provide the billing movement categories that finance and operations teams need. If the core question is “which user actions are associated with activation?”, Heap may be a strong candidate. If it's “which source produced this MRR?”, another layer is required.
9. Dreamdata

Best for: B2B SaaS teams with longer buying cycles, account-based marketing, and CRM-linked revenue attribution.
Dreamdata maps account journeys across advertising, web activity, marketing automation, and CRM systems. Its focus is multi-touch B2B attribution, where several people and touchpoints may be associated with an opportunity before revenue is recorded.
That is a different problem from lightweight source attribution. A small self-serve SaaS may primarily need to know whether a visitor source is associated with a signup and later subscription. A sales-led B2B SaaS company may need to connect account activity with pipeline stages, opportunities, and revenue across a more complicated go-to-market process.
When implementation is justified
Dreamdata includes multi-touch and AI-based attribution, content and revenue analytics, company identification, cookieless tracking options, and data export to warehouses such as BigQuery and Snowflake. These capabilities make sense when a company has the CRM structure, marketing channels, and data ownership needed to maintain account-level models.
The cost is implementation involvement. Advanced capabilities are commonly placed on custom-priced tiers, and data modeling can require more work than a basic analytics setup. For a founder without a sales operations function, that may be too much infrastructure for the question at hand.
Dreamdata also illustrates why attribution should never be presented as causation. A model can assign credit across tracked touchpoints according to its rules, but the result remains a representation of the available data and attribution model. Missing consent, anonymous activity, or incomplete CRM relationships can change the output.
Choose Dreamdata when multi-touch account attribution is the primary business requirement. Choose a lighter tool when the team needs a direct source-to-signup-to-customer view and doesn't yet operate a complex B2B revenue process.
10. HockeyStack
Best for: B2B SaaS go-to-market teams that need deal-level attribution and pipeline or ARR narratives.
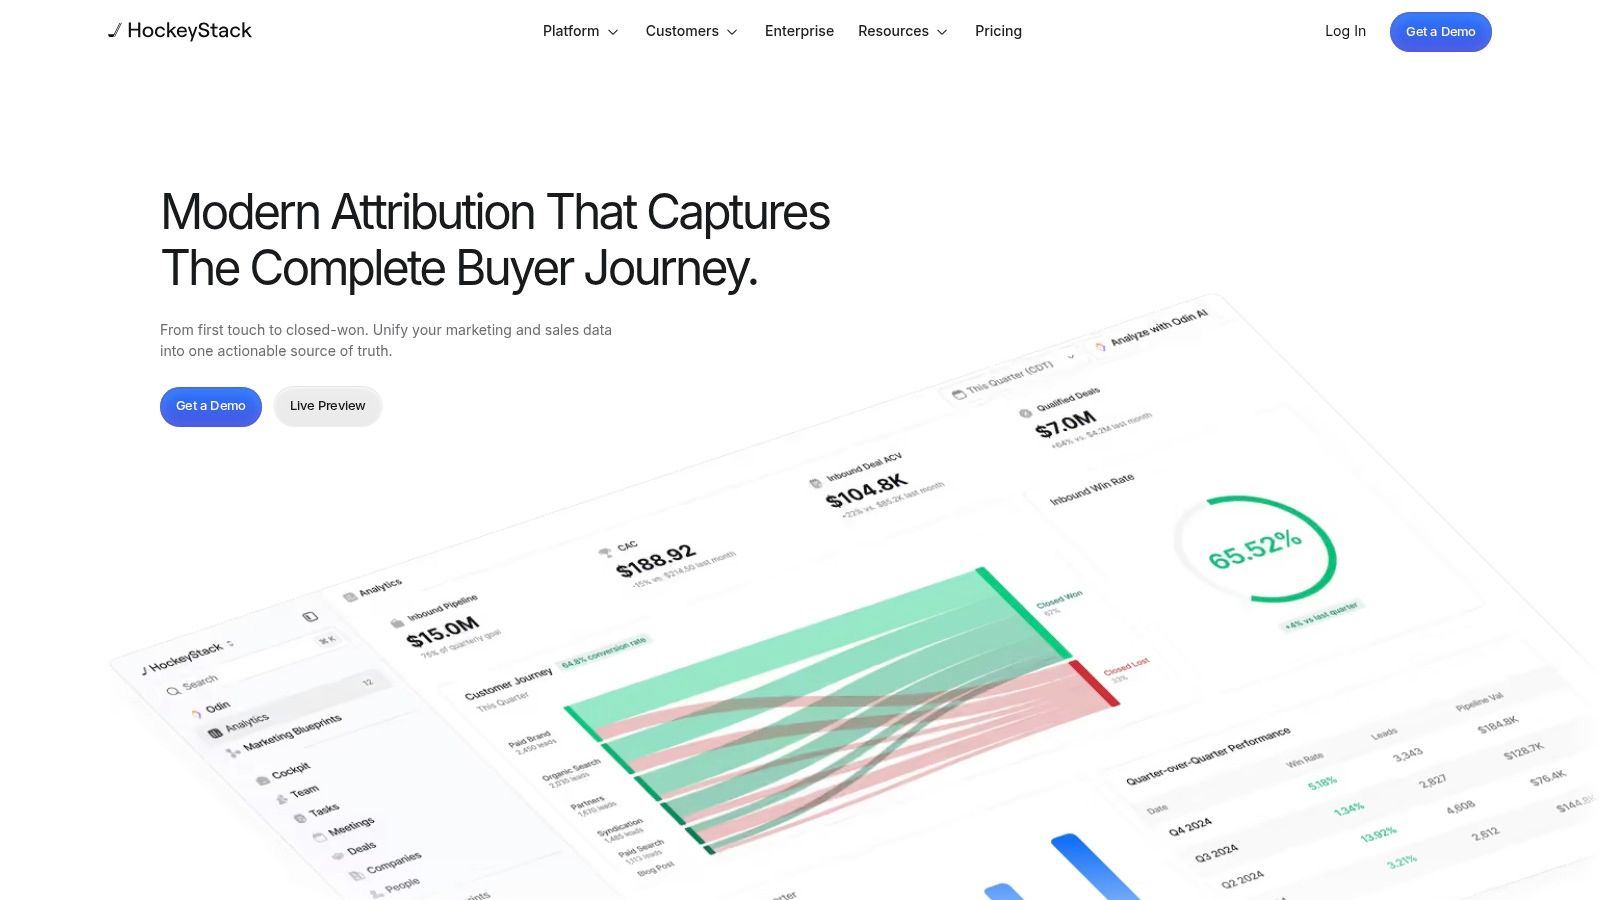
HockeyStack brings marketing, sales, and product touchpoints into account-based attribution dashboards. Its central question is not merely which page received a click. It's how activity across the go-to-market system relates to opportunities and revenue.
That makes it a natural fit for teams with an established CRM, paid media program, and sales process. Case-study-driven templates and white-glove support can help larger organizations align marketing and sales around pipeline and ARR reporting, particularly when different teams currently tell different performance stories.
Why it may be too heavy
Public pricing isn't listed, so evaluation generally involves a sales process. That can be reasonable for an enterprise rollout, but it's less convenient for a solo founder who wants to test a focused reporting workflow without a procurement cycle.
HockeyStack also requires a meaningful data foundation. If CRM records are incomplete, account identities don't reconcile, or marketing touchpoints aren't tracked consistently, the platform can't manufacture a reliable journey. The result may look polished while still reflecting gaps in the underlying data.
The choice is therefore about organizational maturity rather than feature count. HockeyStack suits a B2B SaaS team that needs shared GTM reporting and can support implementation. It isn't the obvious first tool for a small subscription business whose most urgent question is which source produces customers and MRR.
Top 10 SaaS Analytics Tools Comparison
| Product | Core capabilities | Quality ★ | Price / Value 💰 | Target audience 👥 | Unique selling points ✨ |
|---|---|---|---|---|---|
| 🏆 Chartsy | Connect website → signups → Stripe/Paddle; MRR movement breakdowns; AI plain‑English queries; dashboards | ★★★★☆ (4.5/5 G2) | 💰 Affordable, 14‑day free trial (no card) | 👥 Founders, solo builders, small marketing/ops teams | ✨ Read‑only Stripe/Paddle, AI Q&A, fast time‑to‑insight |
| ChartMogul | Standardizes MRR/ARR, churn, LTV; multi‑source billing ingestion | ★★★★ | 💰 Scales with ARR tracked | 👥 Finance & RevOps teams | ✨ Purpose‑built subscription metrics, flexible data model |
| Baremetrics | 28+ subscription metrics, cohorts, Payment Recovery add‑on | ★★★★ | 💰 Mid‑range; Recovery add‑on with ROI promise | 👥 Early→mid SaaS teams (Stripe friendly) | ✨ Revenue recovery tooling tied to ROI |
| ProfitWell Metrics | Out‑of‑the‑box MRR/churn/LTV, Paddle native dashboards | ★★★★ | 💰 Core product free; paid enhancements available | 👥 Startups, Paddle users | ✨ No‑cost baseline for SaaS KPIs |
| Mixpanel | Event‑based funnels, retention, cohorts, templates | ★★★★ | 💰 Usage/event pricing, can grow with volume | 👥 Product & growth teams | ✨ Strong funnel/cohort analysis and fast UI |
| Amplitude | Advanced cohorts, experimentation, AI insights | ★★★★ | 💰 Free → Enterprise tiers; costs grow with events/add‑ons | 👥 Growth/product teams, enterprises | ✨ Enterprise‑grade analytics + experimentation |
| PostHog | Product analytics + feature flags, A/B tests, session replays | ★★★★ | 💰 Generous free tier; cloud or self‑host options | 👥 Engineering‑led teams, self‑hosters | ✨ All‑in‑one stack with open‑source option |
| Heap | Auto‑capture interaction data, session replays, journey maps | ★★★★ | 💰 Quote/plan based (not always self‑serve) | 👥 Product teams needing fast insights | ✨ Automatic data capture reduces instrumentation work |
| Dreamdata | Multi‑touch B2B attribution; CRM & pipeline mapping; warehouse export | ★★★★ | 💰 Custom pricing; enterprise focus | 👥 B2B account‑based GTM & Rev teams | ✨ Account‑level attribution + data export for warehouses |
| HockeyStack | Deal‑level revenue attribution; CRM & ad integrations; ABM templates | ★★★★ | 💰 Typically sales‑led pricing (custom) | 👥 B2B GTM teams, sales & marketing ops | ✨ Pipeline/ARR narratives and deal‑level attribution |
Choose the Smallest Tool That Answers Your Question
The best SaaS analytics tool is the smallest one that answers the decision in front of you. A founder who can't connect tracked sources and signups to paying customers has an acquisition-to-revenue blind spot. A finance lead who can't explain MRR movement has a subscription reporting blind spot. A product manager who can't locate activation friction has a behavioral blind spot. Buying a larger platform won't fix the wrong layer.
Choose Chartsy when the priority is connecting tracked marketing sources and signups to Stripe or Paddle customers, monitoring MRR movements, and asking plain-English questions without SQL. Its most distinctive role in this list is the link between acquisition and subscription revenue. It can help a small team see which sources are associated with paying customers, then inspect new revenue, expansion, contraction, and churn. The team still needs to validate tracking and avoid treating attribution as proof of causation.
Choose ChartMogul, Baremetrics, or ProfitWell Metrics when subscription KPI depth is the main need. ChartMogul suits standardized revenue analytics across billing sources. Baremetrics is compelling for Stripe-centered reporting with payment recovery in the same product family. ProfitWell Metrics provides a no-cost subscription analytics baseline, particularly for Paddle users. These tools start with billing, so they may need a separate acquisition layer.
Choose Mixpanel, Amplitude, PostHog, or Heap when product behavior is central. Mixpanel and Amplitude provide structured event-based analysis, PostHog combines analytics with engineering workflows, and Heap reduces the initial burden of manual interaction capture. None should be assumed to explain source-to-revenue performance without deliberate identity and billing connections.
Choose Dreamdata or HockeyStack when a larger B2B SaaS team needs multi-touch, CRM-linked attribution. They address account journeys, opportunities, pipeline, and GTM alignment, but implementation and commercial evaluation are heavier than a founder-first reporting workflow.
Before committing, document five decisions:
- Billing source: record whether the business relies on Stripe, Paddle Billing, Paddle Classic, or another system.
- Attribution rule: define which tracked relationship receives credit and what the model cannot prove.
- Required events: list the signup, activation, upgrade, downgrade, cancellation, and payment events the team must trust.
- Reporting owner: name the person responsible for maintaining definitions and reviewing anomalies.
- Pricing basis: check whether cost follows ARR, events, seats, history, usage, or a negotiated contract.
That exercise often reveals that the comparison isn't between ten dashboards. It's between a short list of unanswered business questions. Research on academic research with PlotStudio AI also reinforces the value of matching analytical methods to the question rather than treating software selection as a feature-counting exercise.
For Chartsy, the practical next step is small. Connect a read-only billing source, add the tracking script, and validate whether the resulting source-to-signup-to-paying-customer view answers the team's first growth question. If it does, save the relevant chart to a dashboard and use the MRR movement breakdown to decide what deserves investigation next.
Chartsy connects website traffic and signup tracking with Stripe and Paddle billing so small SaaS teams can relate acquisition activity to paying customers, MRR, and churn. Ask plain-English questions, create charts without SQL, and start by testing your own source-to-revenue workflow at Chartsy.

Written by
Chartsy TeamAnalytics team at Chartsy
The Chartsy Team writes guides, product updates, and resources to help SaaS and eCommerce founders make sense of their metrics, without SQL or spreadsheets.
Chartsy
