Need a clear picture of how your existing customers are growing or shrinking? Here’s a step‑by‑step guide that walks you through the entire NRR calculation and shows you how to turn the number into action.
Table of Contents
- Step 1: Start With the Net Revenue Retention Formula
- Step 2: Set the Beginning and Ending Revenue Periods
- Step 3: Add Expansion and Subtract Churn and Contraction
- Step 4: Calculate and Interpret Your NRR Percentage
- Step 5: Track NRR by Plan, Customer Segment, and Cohort
Step 1: Start With the Net Revenue Retention Formula
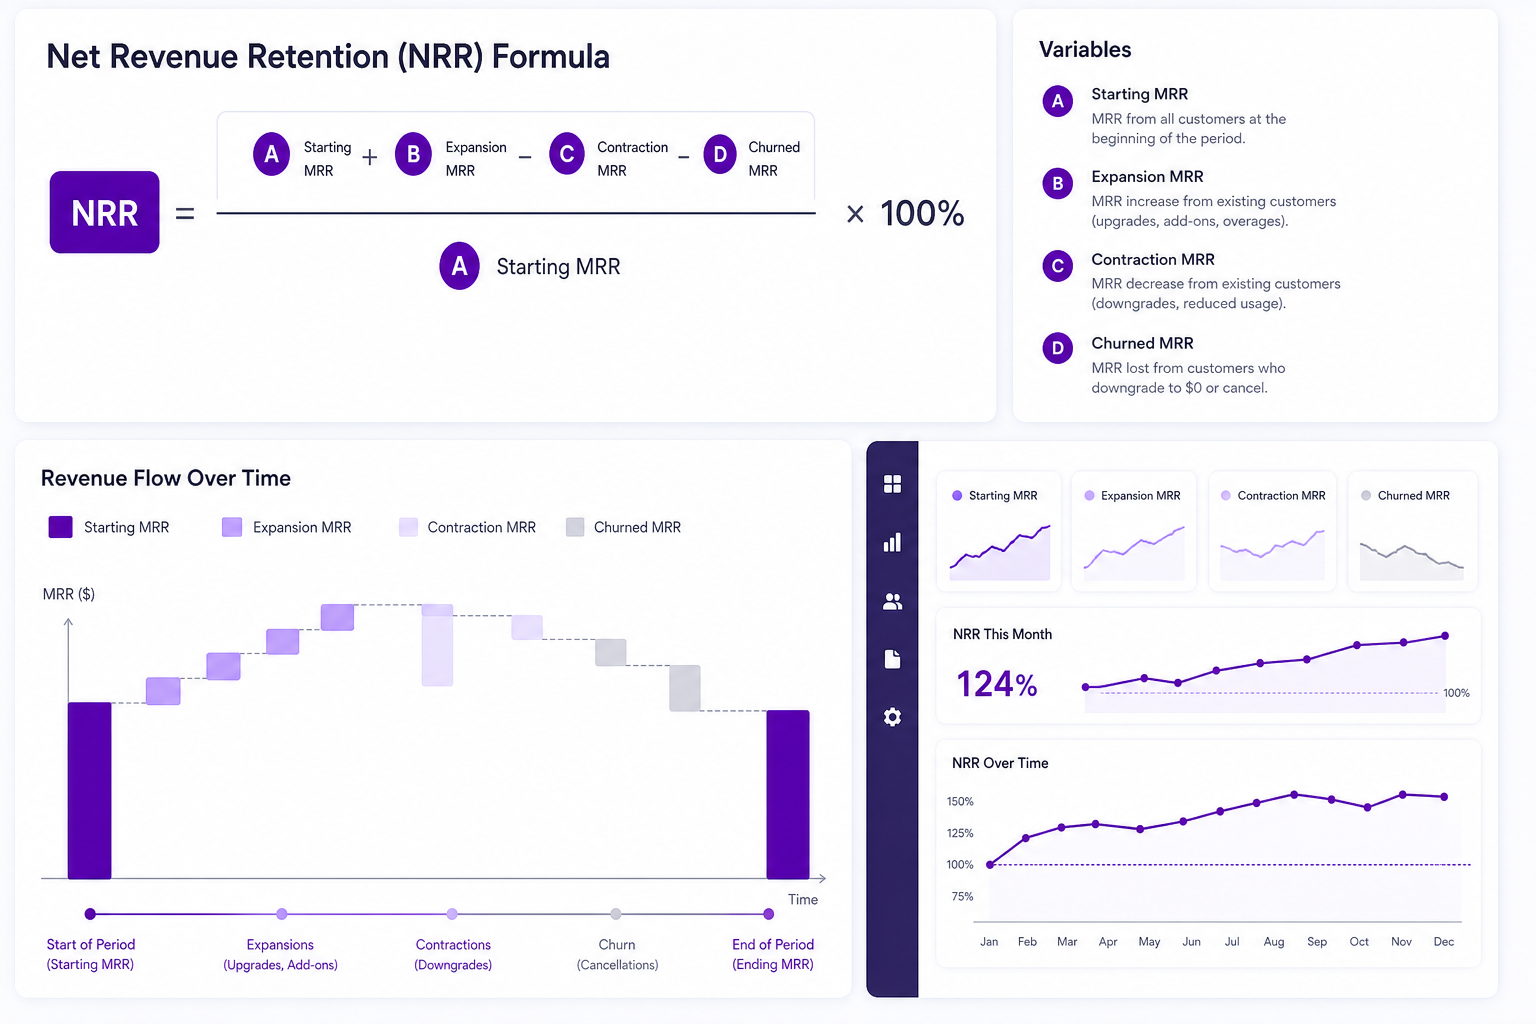
The core equation is simple:NRR = (Starting MRR + Expansion MRR , Contraction MRR , Churned MRR) ÷ Starting MRR × 100. It captures the revenue you kept, added, and lost from the same cohort of customers over a chosen period.
When you plug numbers into the formula, you end up with a percentage. Anything above 100 % means the cohort grew on its own; below 100 % signals net loss. This metric is the go‑to signal for investors because it shows whether you can expand revenue without constantly hunting new customers.
Chartsy makes the math painless. Its AI‑driven parser pulls raw invoice data from Stripe or Paddle, then runs the exact calculation for you, so you never have to guess which line items belong where.
Step 2: Set the Beginning and Ending Revenue Periods
First, pick the window you’ll measure , most teams use a trailing 12‑month period because it smooths seasonal spikes. Grab the MRR snapshot for the exact cohort of customers that were active on day 1 of that window. That snapshot is your “Starting MRR.”
Next, pull the same cohort’s MRR at the end of the window. Do not include any brand‑new customers that joined after day 1; they belong in a separate “New MRR” bucket that the NRR formula deliberately ignores.
To keep the data clean, pull the numbers straight from your billing platform’s export. Even if you’re using a spreadsheet, make sure you filter by “first payment date” or “account creation date” so you only keep the original cohort.
Having a reliable start‑and‑end figure is the foundation; if you slip on this step, every downstream insight will be off.
Step 3: Add Expansion and Subtract Churn and Contraction
Now break down everything that happened to that cohort. Expansion MRR includes upgrades, cross‑sells, and any usage‑based growth that came from those same accounts. Contraction MRR captures downgrades or seat reductions. Churned MRR is the revenue that vanished because a customer cancelled entirely.
Each of these pieces lives in your Stripe or Paddle data as separate line items , upgrades appear as “plan change” events, downgrades as “plan downgrade,” and cancellations as “subscription canceled.” Pull them into a single table and sum each column.
Here’s a quick visual of how the pieces fit together:
Once you have the totals, plug them back into the formula. If expansion outweighs the sum of churn and contraction, your NRR will climb above 100 %.
For teams that need a faster way to pull these buckets, Chartsy’s AI chat can answer “What’s my expansion MRR for Q1?” in plain English, saving you hours of manual work.
Step 4: Calculate and Interpret Your NRR Percentage
Take the numbers from Step 3 and run the division. Start with your opening MRR, add expansion MRR, and subtract churned and contracted MRR. Your calculation looks like this:
NRR = (starting MRR + expansion MRR − churned MRR − contraction MRR) ÷ starting MRR × 100. The result tells you how the existing base changed on its own.
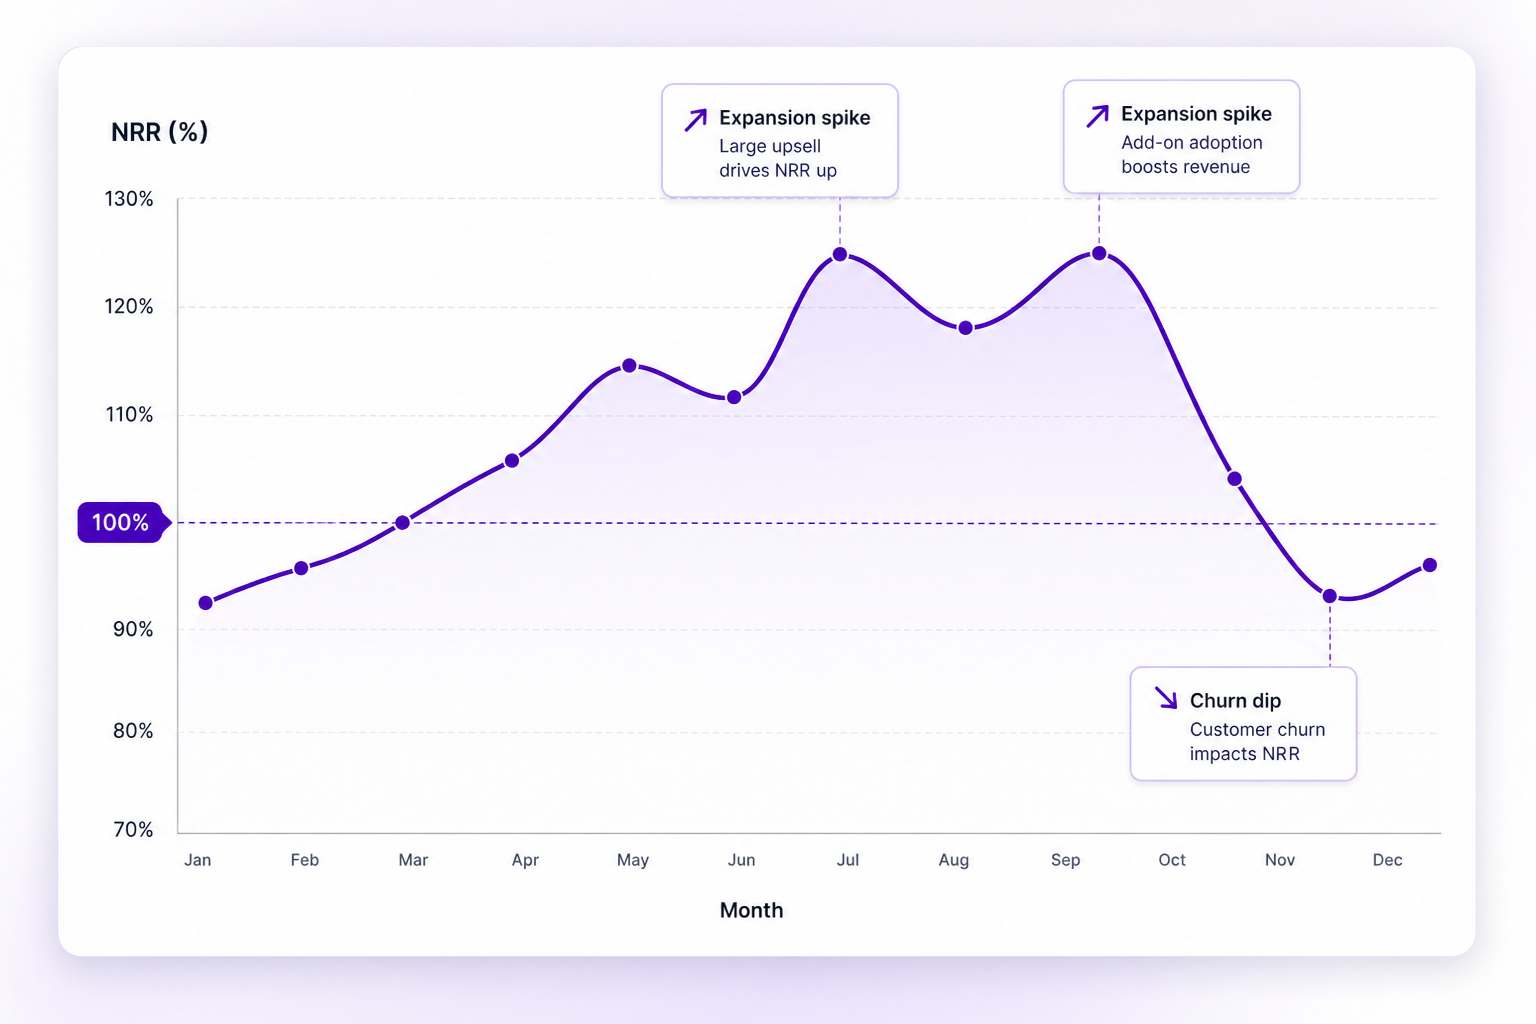
Interpretation matters. An NRR just over 100 % is healthy but may hide churn pockets. Look at the components: if expansion is high but churn is also high, you might be “painting over” a problem that will surface later. Conversely, a low NRR usually signals product‑market fit issues or pricing friction.
MRR is commonly used as the denominator for SaaS metrics because it reflects recurring subscription revenue.
Chartsy can automatically plot NRR over time, flagging months where the metric dips below a threshold you set, so you can investigate the cause right away.
Step 5: Track NRR by Plan, Customer Segment, and Cohort
Overall NRR gives you a headline, but drilling into slices tells you where the growth or loss lives. Break the metric down by product tier, by company size, or by signup month. You might discover that enterprise plans sit at 130 % while SMB plans hover at 95 %.
Cohort analysis is especially powerful. Group customers by the month they first paid, then calculate NRR for each cohort. If newer cohorts show declining NRR, you may need to improve onboarding or adjust pricing.
Chartsy’s dashboard lets you slice NRR instantly , no extra SQL needed. You can also export the data to a BI tool if you prefer a custom view.
For teams that want to streamline their data pipeline, consider exploring data integration services. These services can support the pull of raw Stripe/Paddle data into the analytics layer, making the NRR workflow more efficient.
FAQ
What is Net Revenue Retention?
Net Revenue Retention (NRR) measures the percentage of recurring revenue retained from existing customers after accounting for expansion, contraction, and churn.
How do I choose the measurement period?
Most SaaS firms use a trailing 12‑month window because it smooths seasonality and aligns with annual budgeting cycles.
Can NRR be over 100%?
Yes. An NRR above 100% means the revenue from your current customers grew enough to offset any losses, indicating a self‑sustaining business.
What’s the difference between NRR and Gross Revenue Retention?
Gross Revenue Retention excludes expansion revenue, so it can never exceed 100%, while NRR adds expansion and can go above 100%.
How often should I calculate NRR?
Calculate it at least quarterly; many teams run it monthly to catch trends early and adjust product or pricing tactics.
Why does my NRR differ across plans?
Different plans attract different customer segments and have varying upgrade paths, so it’s normal for enterprise tiers to show higher NRR than lower‑priced plans.
Ready to see your own NRR in real time? Try Chartsy’s free trial , it connects to Stripe or Paddle in minutes and gives you an instant, AI‑powered view of all the numbers you need.

Written by
Chartsy TeamThe Chartsy Team writes guides, product updates, and resources to help SaaS and eCommerce founders make sense of their metrics, without SQL or spreadsheets.
Chartsy