You need a reliable MRR number to steer your SaaS. Here’s a step‑by‑step guide that takes you from the raw data to a clean, real‑time figure you can trust.
Table of Contents
- Step 1: Define Which Subscriptions Count as MRR
- Step 2: Apply the Basic MRR Formula
- Step 3: Calculate New, Expansion, Contraction, Churn, and Reactivation MRR
- Step 4: Work Through a Real SaaS MRR Example
- Step 5: Validate the Number and Track MRR Automatically
- FAQ
- Conclusion
Step 1: Define Which Subscriptions Count as MRR
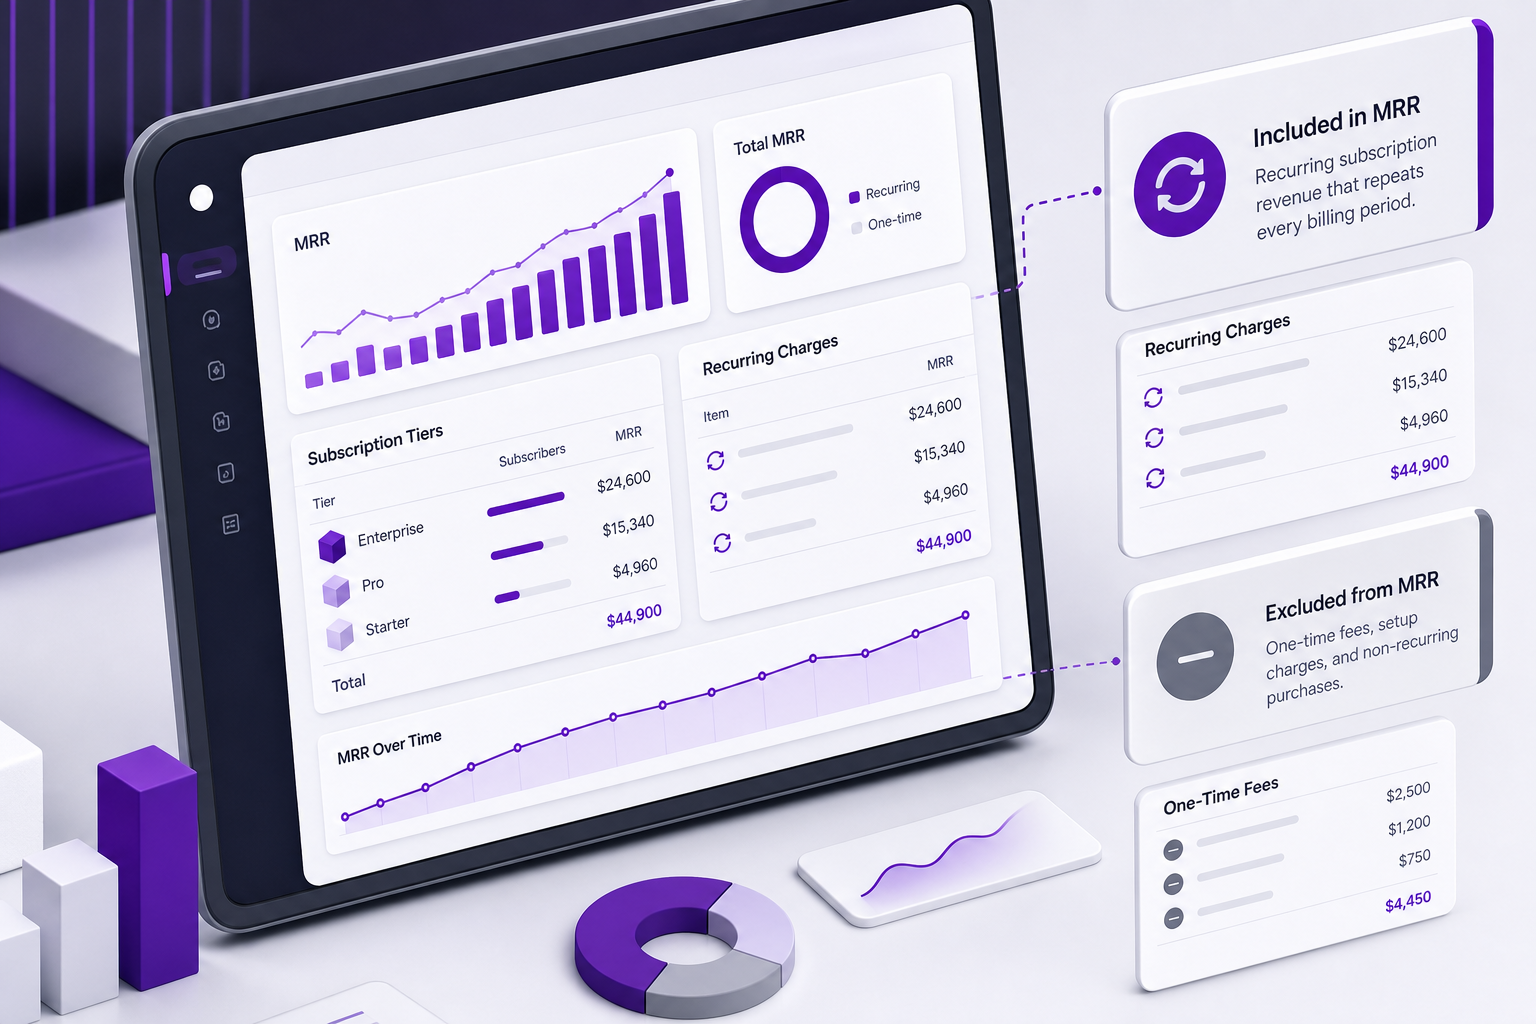
MRR is the predictable, recurring revenue you earn each month from active subscriptions. It includes the monthly charge, any recurring add‑ons, and discounts that are applied every billing cycle. It doesnot include one‑time setup fees, professional services, or taxes.
Only recurring invoice items belong in MRR, while one‑off charges are excluded.
This definition works for founders who need a clean signal for cash flow, finance teams that report to investors, and product managers tracking plan upgrades.
Watch out for hidden traps. If you count annual plans at full price each month, you’ll overstate MRR. Instead, divide the annual amount by 12 (or by the exact number of days in the contract) to get a true monthly contribution.
Step 2: Apply the Basic MRR Formula
The core calculation is simple:
MRR = Number of active paying customers × Average revenue per customer per month
That average is often called ARPU (Average Revenue Per User). Multiply your active customer count by their average monthly payment to calculate MRR.
When a plan is billed yearly, divide the annual amount by twelve to get its monthly MRR.
Wikipedia explains why the metric matters for forecasting and investor updates.
Keep the numbers in a spreadsheet or, better yet, let a tool pull them directly from your billing system.
Step 3: Calculate New, Expansion, Contraction, Churn, and Reactivation MRR
Top‑line MRR hides the story. Break it into five movements to see what’s really happening.
New MRR is revenue from brand‑new customers acquired this month.
Expansion MRR captures upgrades, seat additions, or add‑on purchases from existing customers.
Contraction MRR measures downgrades or reduced seat counts.
Churned MRR is the revenue lost when a subscription is cancelled entirely.
Reactivation MRR adds back revenue from customers who return after a churn.
Put them together in the classic waterfall formula:
Ending MRR = Beginning MRR + New MRR + Expansion MRR + Reactivation MRR , Contraction MRR , Churned MRR
Net New MRR = New + Expansion + Reactivation , Contraction , Churned.
Understanding each component helps you spot a leaky bucket or a growth engine.
Wikipedia’s churn entry provides background on revenue churn. Wikipedia provides a solid baseline for calculating the loss side of the equation.
Step 4: Work Through a Real SaaS MRR Example
Let’s walk through a month for a fictional analytics startup.
| Component | Amount |
|---|---|
| Beginning MRR | Not provided |
| New MRR | Not provided |
| Expansion MRR | Not provided |
| Reactivation MRR | Not provided |
| Contraction MRR | Not provided |
| Churned MRR | Not provided |
| Ending MRR | Not provided |
The net new MRR combines new, expansion, and reactivation MRR, then subtracts contraction and churned MRR. The result depends on the underlying inputs.
Seeing the numbers laid out makes it clear where to focus: improve retention to reduce churn, or push more expansions to grow existing accounts.
For a deeper look at how each line is built from Stripe invoices, check out What Is MRR? Monthly Recurring Revenue Explained. It walks through the exact invoice fields Chartsy uses.
Step 5: Validate the Number and Track MRR Automatically
Manual spreadsheets are prone to error. A single missed invoice can throw off your entire forecast.
Chartsy connects directly to Stripe or Paddle, pulls every paid invoice, and runs the MRR logic in real time. It includes upgrades, refunds, and reactivations out of the box, so you never have to guess.
Set up a weekly health check: pull the MRR dashboard, compare the net new figure to your sales pipeline, and flag any month where churn exceeds expansion.
Because the data updates automatically, you’ll catch a rising churn rate before it hurts your runway.

Pro Tip: Schedule a recurring Slack reminder to review the MRR waterfall each Monday. That simple habit keeps the whole team aligned on growth health.
FAQ
What is the simplest way to calculate MRR?
The simplest way is to multiply the number of active paying customers by the average monthly price they pay. That gives you a quick snapshot of recurring revenue.
Do I need to include discounts in MRR?
Yes. Discounts that apply every month lower the recurring amount, so they belong in the MRR total. One‑time coupons or trial discounts are excluded.
How do I handle annual contracts?
Break the annual amount into a monthly figure by dividing by 12 (or by the exact number of days in the contract). Add that monthly slice to your MRR.
What’s the difference between churned MRR and contraction MRR?
Churned MRR is lost when a customer cancels entirely. Contraction MRR is lost when an existing customer downgrades or reduces seats but stays on the platform.
Can I trust an automated tool for MRR?
Yes, as long as the tool reads actual invoice data from your payment processor. Chartsy, for example, pulls raw Stripe and Paddle invoices, applies the same rules you’d use manually, and updates in real time.
Conclusion
Use the step‑by‑step method above to get a clean MRR number, break it into its movements, and keep it up to date automatically. To see the process in action, set up a free Chartsy connection to your Stripe or Paddle account and start tracking real‑time MRR today.

Written by
Chartsy TeamThe Chartsy Team writes guides, product updates, and resources to help SaaS and eCommerce founders make sense of their metrics, without SQL or spreadsheets.
Chartsy