Found a SaaS metric that looks good on paper but never shows up in your bank account? That’s the gap Chartsy Growth tries to close. Below are the core ways the feature turns traffic data into real revenue insight and how you can act on it today.
Table of Contents
- What Chartsy Growth Measures: From Traffic to Revenue
- Use Case 1: Find Which Acquisition Sources Bring Paying Customers
- Use Case 2: Connect Campaigns, Launches, and UTMs to MRR
- Use Case 3: Compare High‑Traffic Channels with High‑Value Channels
- Use Case 4: Identify Sources That Produce Higher‑Value, Longer‑Lived Customers
- FAQ: Chartsy Growth Feature Use Cases
- Conclusion
What Chartsy Growth Measures: From Traffic to Revenue
If you already know what Chartsy Growth is (see the Chartsy Growth Feature Overview for that), the four scenarios below show what the feature looks like in practice, across four different questions a growth team actually asks week to week.
Each scenario below uses its own numbers and its own decision, so treat them as a menu: skim for the one closest to what you're trying to figure out right now.
For the setup steps behind any of these, see the How to Use Chartsy Growth Feature guide.
Use Case 1: Find Which Acquisition Sources Bring Paying Customers
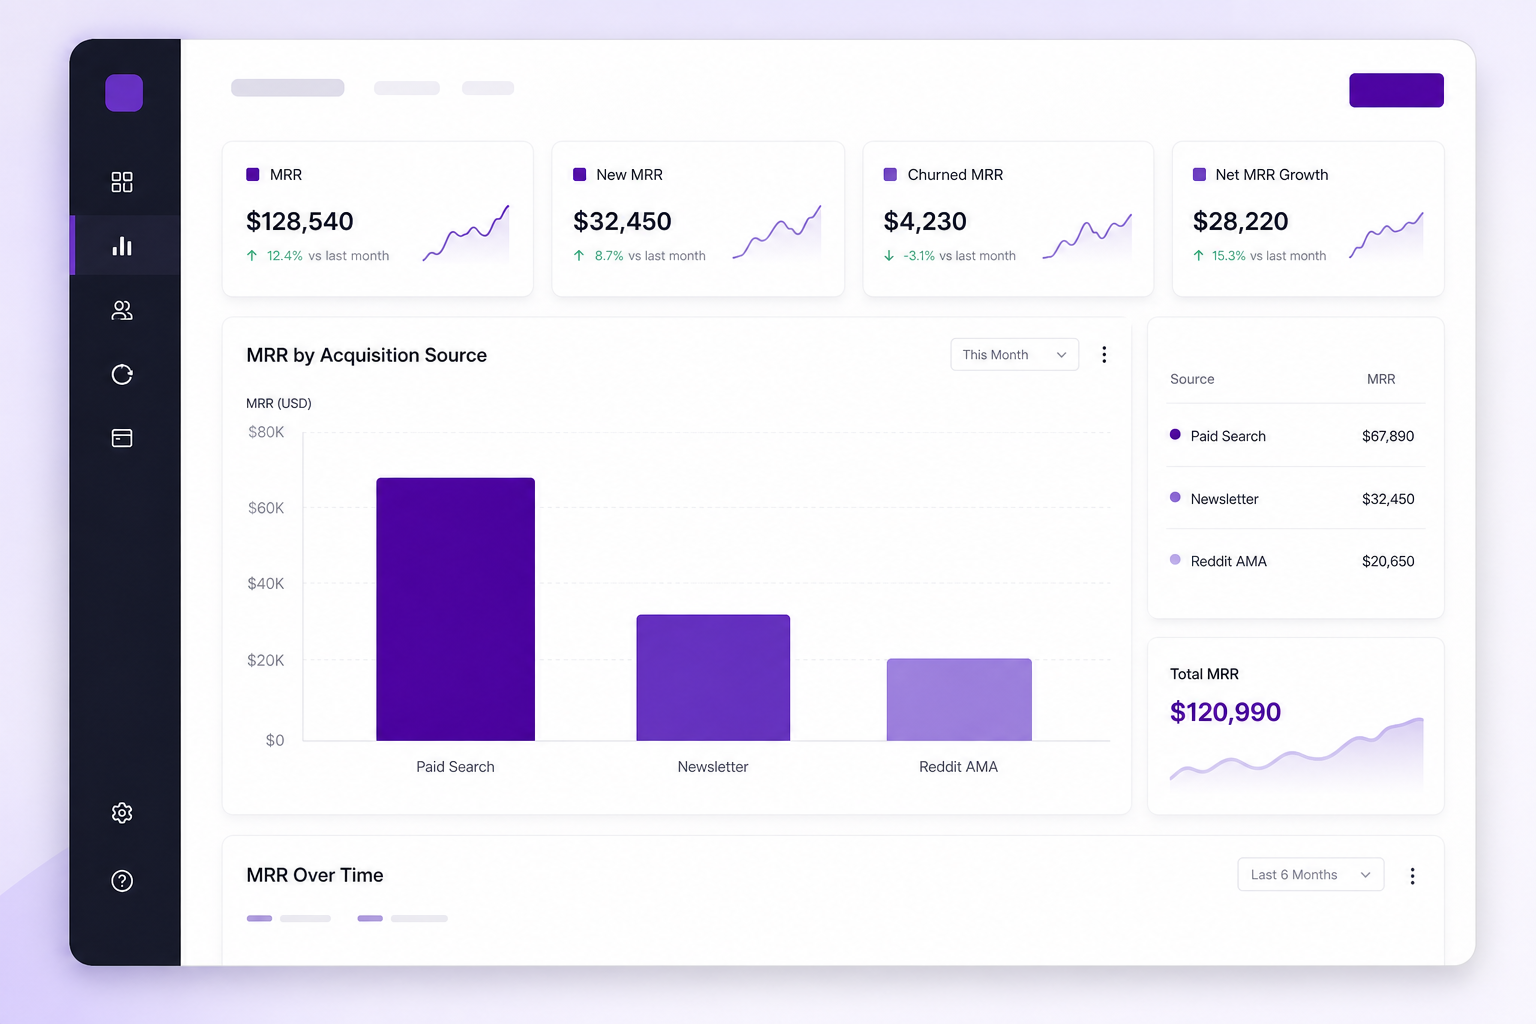
Imagine you ran a summer promotion across three channels: a paid search campaign, a newsletter sponsorship, and a Reddit AMA. After a month you saw strong traffic, newsletter clicks, and AMA viewers. The raw traffic numbers look impressive for the paid search, but you need to know who actually paid.
Chartsy Growth matches each signup to its first‑touch source. In the dashboard you’ll see that the paid search produced 12 new customers, the newsletter 45, and the AMA 30. That translates to different amounts of MRR respectively.
With those figures you can reallocate budget to the newsletter, which gave you the highest ROI per dollar spent.
Bottom line: traffic alone can be misleading; revenue tells the real story.
For more context on how Growth works under the hood, check the Chartsy Growth Feature Overview page.
Use Case 2: Connect Campaigns, Launches, and UTMs to MRR
When you launch a new feature, you often create a landing page with its own UTM parameters. After the launch you want to know if that page actually moved the needle on revenue.
Growth reads the UTM values, ties them to sign‑ups, and then adds the resulting subscription amount to your MRR total. The result is a line chart that shows a spike in MRR right after the launch, broken out by the specific campaign tag.
That visual lets you answer questions like “Did our Product Hunt launch add $12k of MRR?” or “Which ad group drove the most expansion revenue?” without pulling data from two separate tools.
Seeing the numbers in real time helps you decide whether to double‑down on the launch or tweak the messaging.
Pro Tip: Tag each major release with a unique UTM (e.g., utm_source=producthunt&utm_campaign=v2launch) so Growth can isolate its impact.
Use Case 3: Compare High‑Traffic Channels with High‑Value Channels
Many founders chase the channel that brings the most clicks, assuming it will also bring the most money. Growth lets you put traffic and revenue side by side.
In the Growth dashboard you can add a two‑axis chart: the left axis shows visits, the right axis shows MRR. A channel like SEO might sit high on the traffic side but low on the revenue side, while a niche community referral sits low on visits but high on MRR.
This visual makes it easy to spot “high‑value, low‑traffic” opportunities that deserve more attention.
One caution: if a source has very few data points, the revenue line can swing wildly. Treat outliers with a healthy dose of skepticism.
Key Takeaway: Balance volume with value; a smaller source can out‑perform a larger one in dollars.
Use Case 4: Identify Sources That Produce Higher‑Value, Longer‑Lived Customers
Not all customers are equal. Some channels bring users who stay for years and upgrade often; others bring churn‑prone sign‑ups.
Growth adds cohort tables that show average lifetime value (LTV) and churn rate by acquisition source. For example, you might discover that referrals from a developer forum have stronger LTV and lower churn than paid Facebook ads.
Armed with that data you can shift acquisition spend toward the forum and perhaps negotiate a partnership.
Remember that cohort data needs at least a few months of history to be reliable. Early‑stage startups should interpret the numbers as trends, not absolutes.

For a deeper look at how churn and lifetime value interact, see churn and how to calculate LTV for SaaS.
FAQ: Chartsy Growth Feature Use Cases
What does Chartsy Growth actually track?
Chartsy Growth tracks visitor UTM data, sign‑up events, and Stripe or Paddle subscription activity, then aggregates them by source to show MRR, churn, and LTV per channel.
Can I use Growth with a payment processor other than Stripe or Paddle?
No, the feature only supports Stripe and Paddle at the moment; other processors require a manual data export.
How does Growth handle visitors who move between subdomains?
Growth sets first‑touch and last‑touch cookies that are shared across all subdomains, so a visitor who lands on marketing.example.com and signs up on app.example.com stays linked to the original source.
Is the data in Growth updated in real time?
Yes, each time Chartsy syncs with Stripe or Paddle the revenue attribution tables refresh automatically.
Does Growth show the impact of a specific campaign, like a Product Hunt launch?
It does. By tagging the launch with a unique UTM, Growth rolls the resulting sign‑ups and MRR into a single line on the campaign report.
Can I export the source‑by‑revenue report?
You can download any chart as a CSV or PNG directly from the dashboard for presentations or deeper analysis.
Conclusion
These four scenarios aren't exhaustive, but they cover the questions that come up most: which source pays, whether a launch mattered, where the traffic-vs-value gap sits, and which channel brings customers who stick around.
Next step: pick the use case closest to your current question, open Chartsy Growth, and ask it directly rather than estimating from a spreadsheet.

Written by
Chartsy TeamAnalytics team at Chartsy
The Chartsy Team writes guides, product updates, and resources to help SaaS and eCommerce founders make sense of their metrics, without SQL or spreadsheets.
Chartsy
