
You open your billing dashboard and see that MRR is up. Then the questions start. Which campaign brought those customers in? How much of the increase came from upgrades rather than new accounts? Did churn rise because customers canceled, or because payments failed? If your answers require exporting several reports into a spreadsheet, you've outgrown a basic subscription dashboard.
A useful Baremetrics alternative should do more than display recurring revenue. It should preserve the difference between billing events, operational MRR, and accounting revenue, while connecting acquisition sources to paying customers and subscription outcomes. That combination matters most for SaaS founders, solo builders, and small teams that need reliable answers without maintaining a custom data warehouse.
Table of Contents
- Why SaaS Founders Look for a Baremetrics Alternative
- Core Criteria for Evaluating Subscription Analytics Tools
- Comparing the Best Baremetrics Alternatives for SaaS
- Connecting Marketing Attribution to Recurring Revenue
- Handling Complex MRR and Churn Calculations
- Migrating Your Analytics Without Losing Historical Data
- Choosing the Right Platform for Your SaaS Stage
Why SaaS Founders Look for a Baremetrics Alternative
Baremetrics began with a focused problem. In October 2013, founder Josh Pigford needed a faster way to understand recurring-revenue metrics for two SaaS products running on Stripe. He built the first version in eight days, concentrating on MRR, churn, and customer lifetime value rather than trying to build a broad business-intelligence system. The original Baremetrics story shows why the category became useful in the first place: founders needed payment data translated into understandable subscription metrics.
That narrow focus is still valuable. A SaaS team often wants a clean view of recurring revenue, customer retention, and lifetime value without assembling reports manually. The problem appears when the business asks questions that sit outside the billing system.
The questions a billing dashboard can't answer alone
Suppose a founder sees new MRR rising after a content campaign. A billing-only tool may show the new subscriptions, but it won't necessarily show whether those customers came from organic search, a partner referral, direct traffic, or a paid campaign. Marketing sees signup volume, finance sees recurring revenue, and neither team can confidently connect the two.
The same gap appears in retention analysis. A dashboard may show churn, but not whether customers acquired through a particular source are more likely to cancel, downgrade, or expand. That doesn't prove the source caused the outcome, but it gives the team a useful place to investigate.
Practical rule: If your team can see MRR and churn but can't trace those metrics back to plans, customers, and acquisition sources, you have subscription reporting, not complete revenue analysis.
Complexity grows faster than the dashboard
Many SaaS companies begin with one billing provider and one standard plan structure. Later, they add annual subscriptions, multiple currencies, trials, discounts, refunds, or a second provider during a migration. The same customer movement can then appear differently depending on when each provider considers a subscription canceled or expired.
Rigid dashboards become a problem too. Preset reports are useful for common metrics, but operators often need questions specific to their business. They may want to compare MRR by plan and acquisition source, isolate reactivations, or inspect whether a group of customers expanded after converting from a specific signup path.
A Baremetrics alternative should therefore be evaluated as an operational system, not just a replacement chart library. The relevant question is whether it helps a small team explain why reported revenue changed, which customers contributed to that change, and what marketing evidence is associated with those customers. For a broader look at why standard dashboards often fail this test, see why most SaaS dashboards fail.
Core Criteria for Evaluating Subscription Analytics Tools
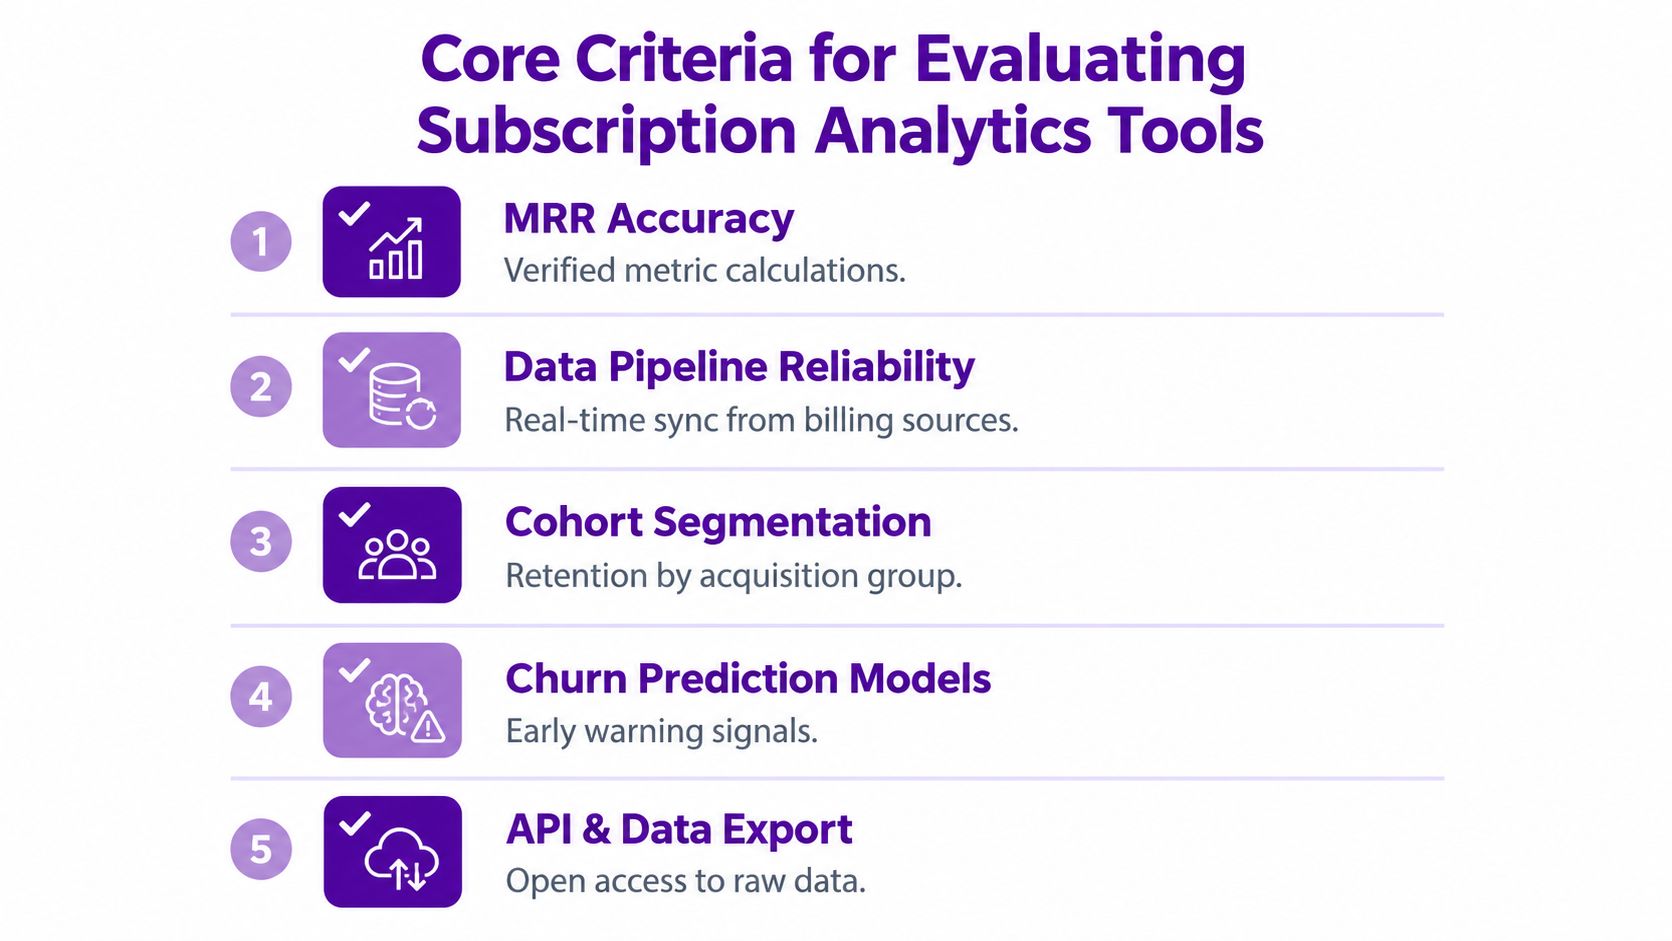
A subscription analytics tool earns trust through its data model. Attractive charts aren't enough if the underlying system treats every successful payment as recurring revenue or quietly changes churn timing across providers.
1. Separate MRR from accounting revenue
MRR is an operational run-rate metric, not a synonym for cash collected or recognized accounting revenue. A meaningful implementation calculates MRR from active recurring subscription components. One-time charges, professional services, and other non-recurring transactions should remain outside recurring-revenue totals, as explained in Stripe's revenue recognition documentation.
This distinction matters when a customer pays an onboarding fee, receives a prorated invoice, or gets a refund. A payment summary can report the cash event correctly while still producing a misleading MRR figure.
2. Read invoice and event detail
Subscription objects provide useful state information, but invoices and line-item events often carry the detail needed to understand prorations, refunds, discounts, and subscription-item changes. Test whether a tool can explain the movement behind a number instead of only showing the latest subscription snapshot.
3. Test difficult billing cases
Before switching platforms, create a test list that includes:
- Annual subscriptions: Confirm how the contract is normalized into monthly recurring value.
- Prorations: Check whether mid-cycle upgrades create temporary invoice effects or permanent MRR changes.
- Refunds: Verify that a refund doesn't automatically erase recurring revenue that remains active.
- Paused subscriptions: Establish when the system removes or preserves MRR.
- Failed payments: Separate involuntary payment loss from deliberate cancellation.
- Currency conversion: Document how reports normalize currencies and when conversion occurs.
- One-time sales: Ensure non-recurring revenue remains outside MRR.
4. Make denominators visible
A churn percentage without a documented denominator is difficult to audit. Customer churn counts customers, while revenue churn measures lost MRR. Gross revenue churn generally focuses on cancellations and contractions against starting-period MRR, while net revenue churn also considers expansion and upgrades.
For practical guidance on interpreting SaaS analytics and avoiding misleading headline metrics, Prometheus Agency's analytics insights offers useful context. The important operational test is simple: can your team reproduce the reported result from a movement ledger?
5. Support segmentation and access
Founders need fast answers, while marketing and operations teams need repeatable views. Look for segmentation by plan, customer, country, acquisition source, and billing provider. Plain-English analysis can reduce the need for SQL, but the tool should still make the underlying filters and definitions understandable.
The best platform isn't necessarily the one with the largest feature list. It's the one that keeps metric definitions stable when billing events become messy.
Comparing the Best Baremetrics Alternatives for SaaS
A fair comparison starts with the problem each platform solves. Baremetrics is associated with clean, standard subscription reporting for Stripe-focused SaaS teams. ChartMogul is commonly considered when consolidation across billing sources and deeper customer segmentation matter. Built-in Stripe or Paddle reporting can be sufficient for teams that only need operational payment visibility.
Chartsy sits in a different part of the category. It connects website traffic and signups with billing data from Stripe, Paddle Billing, Paddle Classic, and Freemius, and it can accept other billing data through a Custom API. Its plain-English interface lets users ask questions and create charts without writing SQL. That makes it relevant to small teams that need to connect acquisition evidence with subscription outcomes, not just monitor a billing ledger.
| Platform | Primary Billing Integrations | Attribution to Revenue | Best For |
|---|---|---|---|
| Baremetrics | Stripe-focused | Primarily subscription reporting | SaaS teams wanting established, standard billing dashboards |
| ChartMogul | Multiple billing sources and custom ingestion | Subscription analysis, with external attribution often required | Teams consolidating complex billing data |
| Stripe Dashboard | Stripe | Limited connection between traffic and recurring revenue | Early teams needing basic Stripe operations |
| Paddle analytics | Paddle billing data | Closely tied to Paddle reporting | SaaS businesses committed to Paddle |
| Chartsy | Stripe, Paddle Billing, Paddle Classic, Freemius, and Custom API | Connects website visits and signups to paying customers and recurring revenue | Founders and small teams combining acquisition and subscription analysis |
The trade-off is important. A mature subscription analytics platform may offer deeper controls for specialized finance or data teams. A simpler interface may be more useful to a solo founder who needs an answer immediately and won't maintain complex reports.
Match the tool to the question
Choose a Stripe-centered dashboard when your main need is monitoring standard MRR and churn from one billing source. Consider a multi-source platform when you need a consolidated reporting layer and have the operational capacity to define and maintain a canonical metric model.
Choose an attribution-oriented platform when marketing decisions depend on retained subscription revenue. For example, a small growth team may need to compare acquisition source, plan, customer conversion, and MRR movement in one place. Product analytics comparisons such as the SigOS top analytics list can help with broader product-data evaluation, but billing reconciliation and revenue definitions still require a dedicated test.
Don't choose based on integration count alone. More connectors can create more inconsistent definitions if one provider records churn at cancellation and another records it at the end of the paid period. The right Baremetrics alternative makes those rules visible and gives your team a way to investigate discrepancies.
Connecting Marketing Attribution to Recurring Revenue
Traffic and signup growth can look healthy while the subscription base underperforms. A channel may generate many trials but few paying customers, or it may attract customers who start on a low-value plan and later cancel. Those outcomes are materially different from a source that produces fewer signups but more retained MRR.
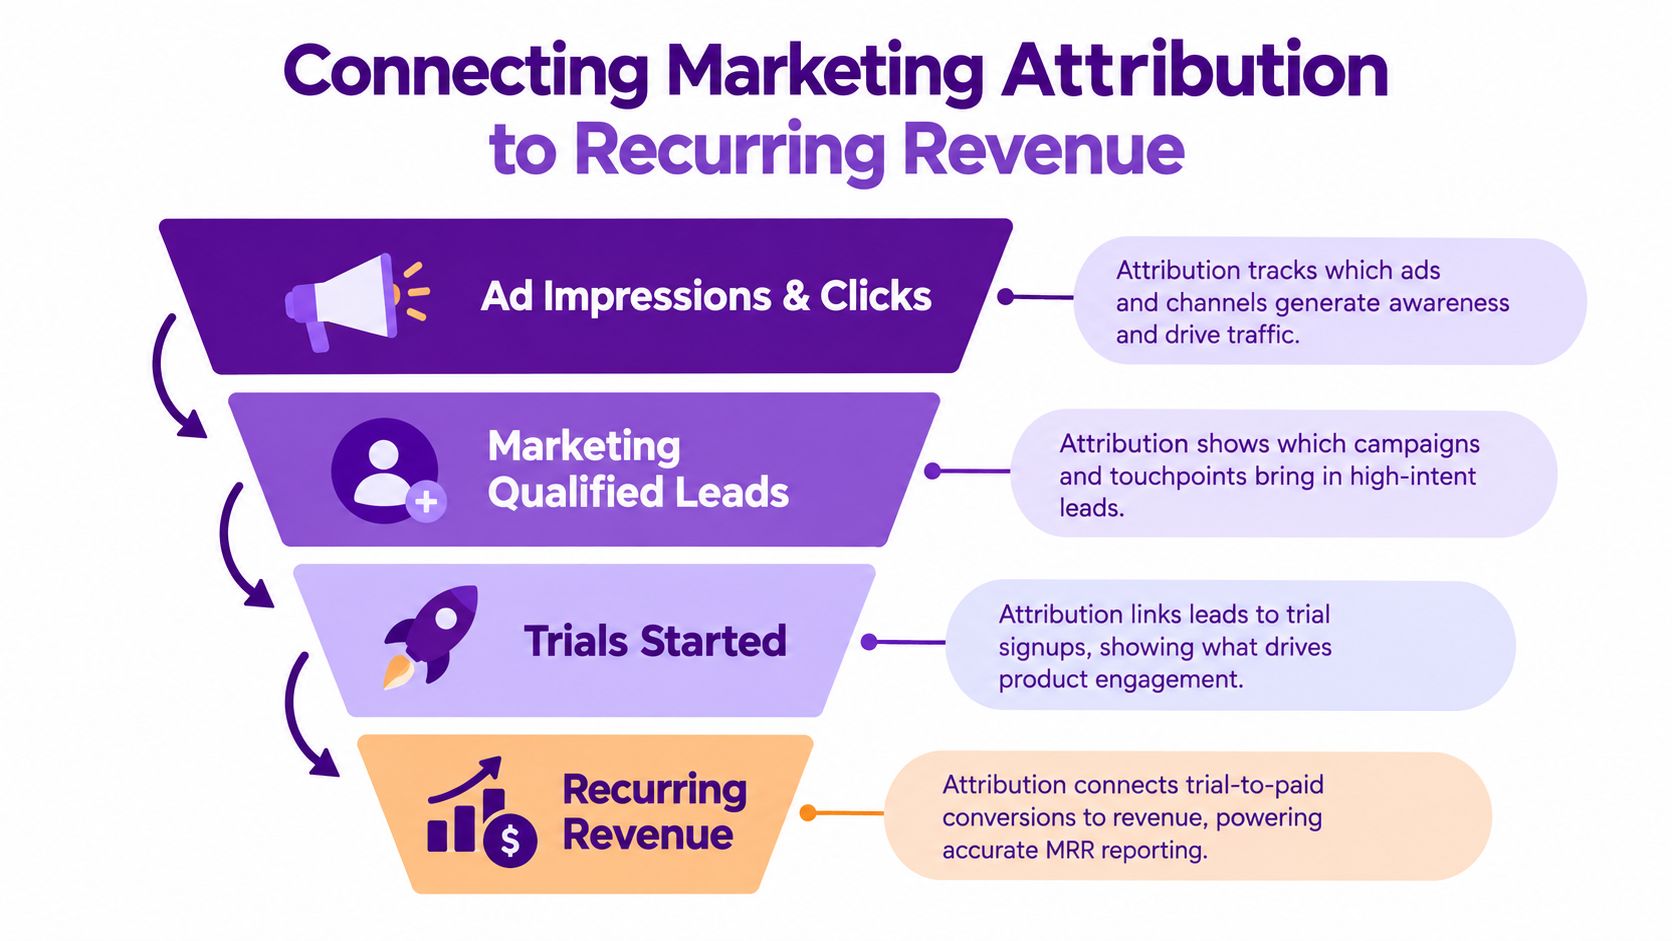
A subscription analytics platform becomes more useful when it joins the funnel to billing outcomes. The analytical path is:
- Acquisition source: Identify where the visitor came from.
- Signup: Record the account or user who entered the product.
- Payment: Connect the signup to a paying customer.
- Recurring revenue: Track the resulting MRR and its later movements.
- Retention evidence: Observe cancellations, contractions, reactivations, and expansions.
The purpose isn't to claim that a source caused retention. Attribution data shows an observed relationship between a source and customer outcomes. Product quality, pricing, onboarding, sales involvement, and customer fit may also explain the result.
First-click and last-click tell different stories
A customer may discover a product through an educational article, return through direct traffic, and finally convert after clicking a branded campaign. First-click attribution credits discovery, while last-click attribution credits the final recorded interaction. Neither view automatically explains the entire buying process.
Direct traffic deserves special attention. It can represent genuine brand awareness, copied links, bookmarks, untagged campaigns, or missing referral information. Treating every direct visit as an independent acquisition channel can distort the report.
A useful dashboard should let the team inspect several views without confusing them. Compare source-level signups with paying customers, then compare paying customers with MRR movements and churn. If one source produces new MRR but another produces more expansion, the decision may depend on payback period, customer fit, and retention quality rather than signup volume alone.
A signup is an event. Retained recurring revenue is a business outcome. They shouldn't share the same reporting column.
One-time purchases need separate treatment as well. They may be commercially important, but they shouldn't be mixed into subscription MRR when the goal is to understand recurring growth. For a practical perspective on joining marketing evidence to revenue outcomes, see marketing revenue attribution.
The broader gap is well described in Baremetrics' discussion of SaaS metrics platforms: web and funnel tools often answer attribution questions, while subscription tools focus on MRR, churn, LTV, and cohorts. The practical value of a connected system is that it allows a small team to examine both sides without stitching together disconnected exports.
Handling Complex MRR and Churn Calculations
MRR should explain a change, not merely announce it. Stripe distinguishes new subscriptions, expansion, contraction, and churn, with new MRR including a new customer or a free-to-paid conversion. Expansion increases an existing customer's MRR through a plan change, higher quantity, or lower discount. Contraction reduces MRR while leaving a non-zero subscription, while churn takes paid MRR to zero through cancellation, a downgrade to free, or delinquency. Stripe's MRR event guidance-totals) documents these distinctions.
Build a movement ledger
Start with the opening MRR balance. Then record each movement category separately before checking the ending balance:
- New MRR: A new paid subscription or conversion from free.
- Expansion MRR: An existing customer increases recurring value.
- Contraction MRR: An existing customer decreases recurring value but remains paid.
- Churn MRR: A paid subscription reaches zero recurring value.
- Reactivation MRR: A previously churned customer returns.
The core reconciliation is:
Beginning MRR + new MRR + expansion MRR + reactivation MRR − contraction MRR − churn MRR = ending MRR
If the equation doesn't reconcile, investigate event timing, refunds, currency conversion, duplicate records, and treatment of failed payments. Don't patch the difference with an unexplained adjustment. That creates a report that balances today and becomes impossible to trust later.
Keep customer churn separate from revenue churn
A large customer can create significant lost MRR through one cancellation, while many small customers can create substantial customer churn with limited revenue impact. Report the numerator and denominator for each metric so a reader knows whether the report counts customers or recurring dollars.
Failed-payment churn also deserves its own classification. A voluntary cancellation suggests a different operational response from an involuntary loss caused by an unpaid invoice. Combining them hides the difference between product or pricing dissatisfaction and payment-recovery problems.
Multi-subscription customers complicate the picture. If a customer has several paid subscriptions and cancels only one, the customer may still be active even though the account's MRR contracts. A later return after complete cancellation should be recorded as reactivation, not folded into new customer growth.
A practical audit asks four questions:
- Does the report define when churn begins?
- Does it separate voluntary cancellation from delinquency?
- Does it show customer churn separately from MRR churn?
- Can every net MRR change be traced to an event category?
If the answer to any question is no, the headline metric needs qualification before it reaches a board report or planning meeting.
Migrating Your Analytics Without Losing Historical Data
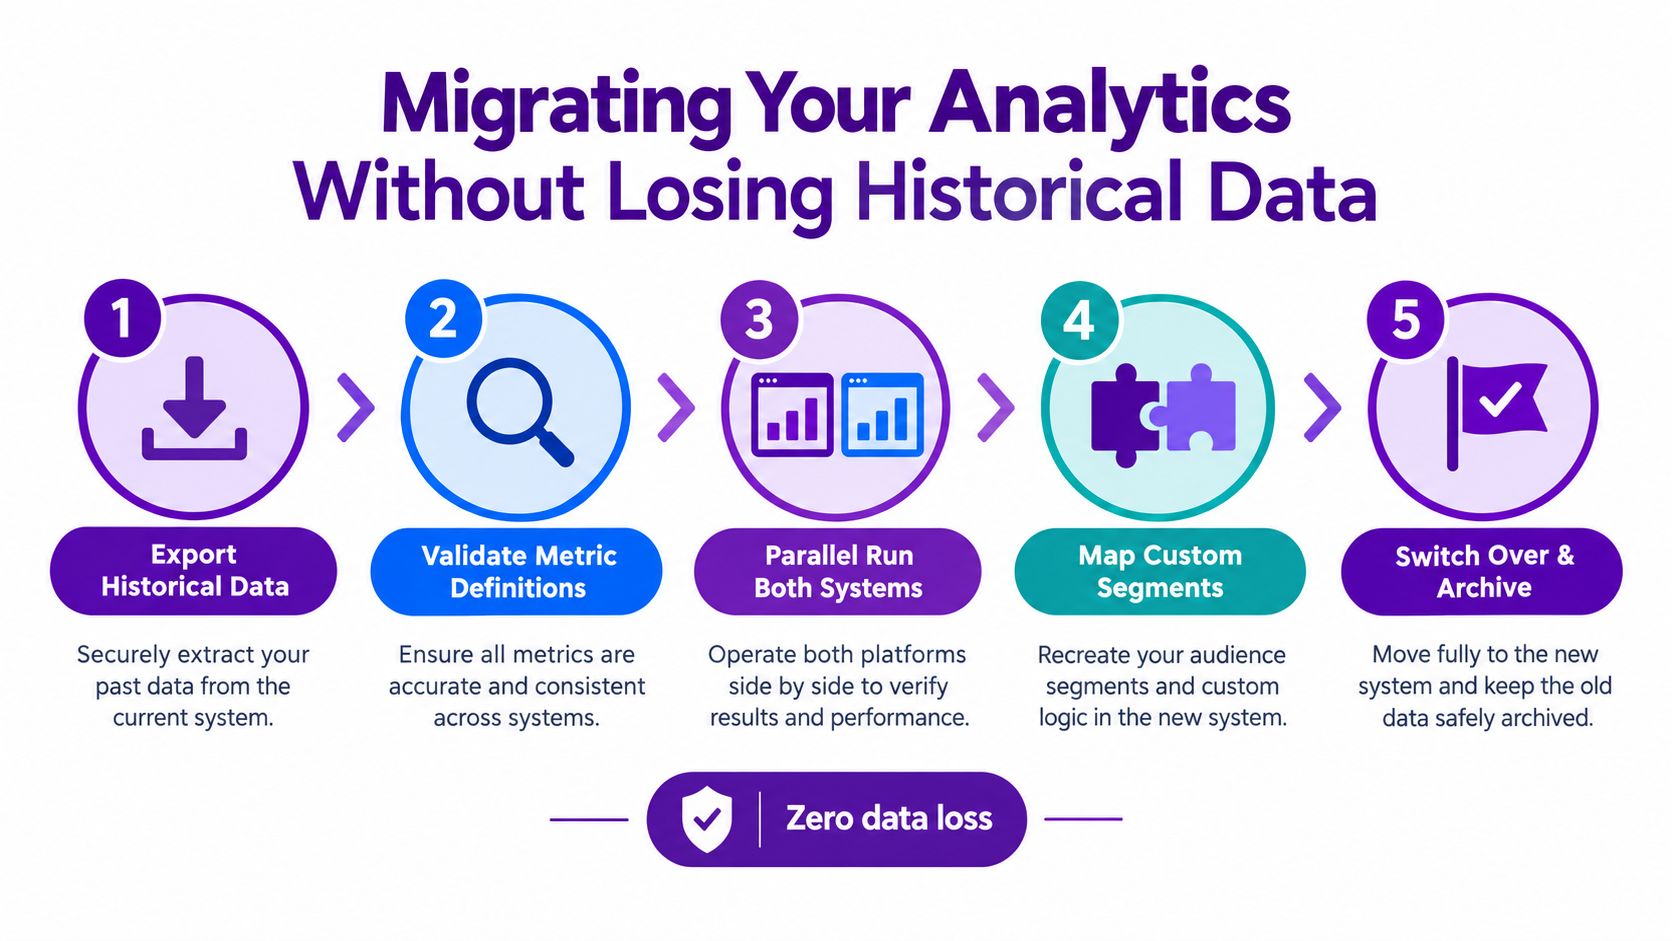
Analytics migrations fail when teams connect the new tool before agreeing on what the old numbers mean. Start with definitions, not dashboards. Write down how your team treats trials, annual plans, refunds, failed payments, reactivations, currencies, and one-time charges.
A practical migration sequence
Export what you can from the existing system. Preserve historical reports, customer identifiers, subscription records, and any movement data your current platform exposes. Keep the original files read-only so later reconciliations have a stable reference.
Map the source events. Match provider events to your canonical categories: new, expansion, contraction, churn, refund, failed payment, and reactivation. Don't assume Stripe, Paddle Billing, Paddle Classic, and Freemius use identical event names or timing.
Normalize time and currency. Choose a reporting timezone and document it. Decide how to treat exchange rates and whether historical values remain in their billing currency or are converted into a reporting currency.
Run both systems in parallel. Compare a controlled period across the old and new reports. Reconcile total active subscriptions, ending MRR, new MRR, churn, refunds, and failed payments. Differences are useful if the team can explain them.
Archive the old definitions. Once the new model is accepted, retain the old reports and write down the date of the change. Historical comparisons are much easier when future readers know why two systems disagree.
The cross-provider problem deserves special care. Stripe and Paddle can use different churn timing, with Stripe potentially treating a subscription as churned at cancellation while Paddle may count churn when the paid period ends. That difference can change reported MRR and retention even when the underlying customer relationship hasn't changed. Baremetrics' comparison of Stripe analytics platforms highlights why integration lists alone don't solve reconciliation.
If your billing system isn't supported natively, a Custom API can provide a path, but it requires sending billing data into the analytics platform. It isn't an automatic connection to every provider. For a migration-focused checklist, use switching from Stripe to Paddle without losing revenue history.
Choosing the Right Platform for Your SaaS Stage
A solo founder on one billing provider usually needs fast answers more than an elaborate analytics stack. The right platform should make it easy to inspect MRR, identify churn movements, and connect paying customers to acquisition sources without requiring SQL or a dedicated analyst.
A growing marketing or operations team has a different requirement. It needs shared definitions, saved dashboards, repeatable segments, and a way to compare marketing sources with subscription outcomes. In that environment, the ability to distinguish new MRR from expansion and churn matters more than a polished total-revenue chart.
Teams using several billing providers should prioritize reconciliation. Ask whether the platform supports your providers directly, how it handles conflicting churn dates, and whether it can preserve a common customer and event model. If the provider isn't natively supported, confirm what must be sent through an API and who will maintain that pipeline.
Chartsy is a practical option for SaaS teams that want website visits, signups, paying customers, and subscription revenue in one analysis. It supports Stripe, Paddle Billing, Paddle Classic, and Freemius data, offers a Custom API for other billing systems, and provides plain-English questions, charts, dashboards, and reporting around MRR movements and churn. The trade-off is that teams still need to define their metric rules and validate provider-specific edge cases rather than assuming any tool can infer business meaning automatically.
Choose based on your next reporting problem, not on the longest feature list. If your unanswered question is “Which source brings customers who continue paying?” a billing-only dashboard is unlikely to be enough.
Use Chartsy to connect website traffic and signups with billing data from Stripe, Paddle Billing, Paddle Classic, Freemius, or a Custom API. Start by validating one workflow, such as tracing acquisition source to paying customer and MRR movement, then expand the dashboards your team uses day to day.

Written by
Chartsy TeamAnalytics team at Chartsy
The Chartsy Team writes guides, product updates, and resources to help SaaS and eCommerce founders make sense of their metrics, without SQL or spreadsheets.
Chartsy
