Want to know exactly how much each paying customer adds to your monthly revenue? Below is a step‑by‑step guide that shows you the ARPU formula, how to pull the right data, and what to do once you have the number.
Table of Contents
- Step 1: Choose the Right ARPU Formula for Your SaaS Business
- Step 2: Gather MRR and Active Customer or User Data
- Step 3: Calculate ARPU With a Real SaaS Example
- Step 4: Interpret ARPU Changes Alongside Churn and Retention
- Step 5: Track ARPU Consistently and Turn the Result Into Action
- FAQ: ARPU Formula Questions
- Conclusion
Step 1: Choose the Right ARPU Formula for Your SaaS Business
The classic ARPU formula is simple: total MRR divided by the count of active paying customers in the same period. Some platforms call it ARPA ( average revenue per account) when they focus on seat‑based pricing. The key is to be consistent about the time window you use , most SaaS teams work month‑by‑month.
When you compare tools, you’ll see slight variations. Paddle explains that ARPU helps you spot trends and adjust pricing to move revenue in the right direction. Baremetrics defines the formula as MRR ÷ active customers and notes that it excludes free‑trial users. Decide whether you need a per‑seat view (use ARPU) or a per‑account view (use ARPA) before you start pulling numbers.
Bottom line: pick the version that matches how you bill , per seat or per account , and stick with it.
Step 2: Gather MRR and Active Customer or User Data
First, pull your Monthly Recurring Revenue (MRR) from your billing system. Make sure you’re looking at committed MRR , exclude one‑off set‑up fees or professional services that aren’t recurring.
Next, count only the customers who are paying that month. Free or trial users should be left out; otherwise your ARPU will be artificially low. ARPU is calculated by dividing MRR by the number of active customers or users for the month, so exclude non‑paying accounts. Record these two numbers in a simple spreadsheet so you can repeat the calculation each month.
By now you should have two clean inputs: a dollar figure for MRR and an integer for active paying customers.
What Is ARPU? Average Revenue Per User Explained | Chartsy Blog
Step 3: Calculate ARPU With a Real SaaS Example
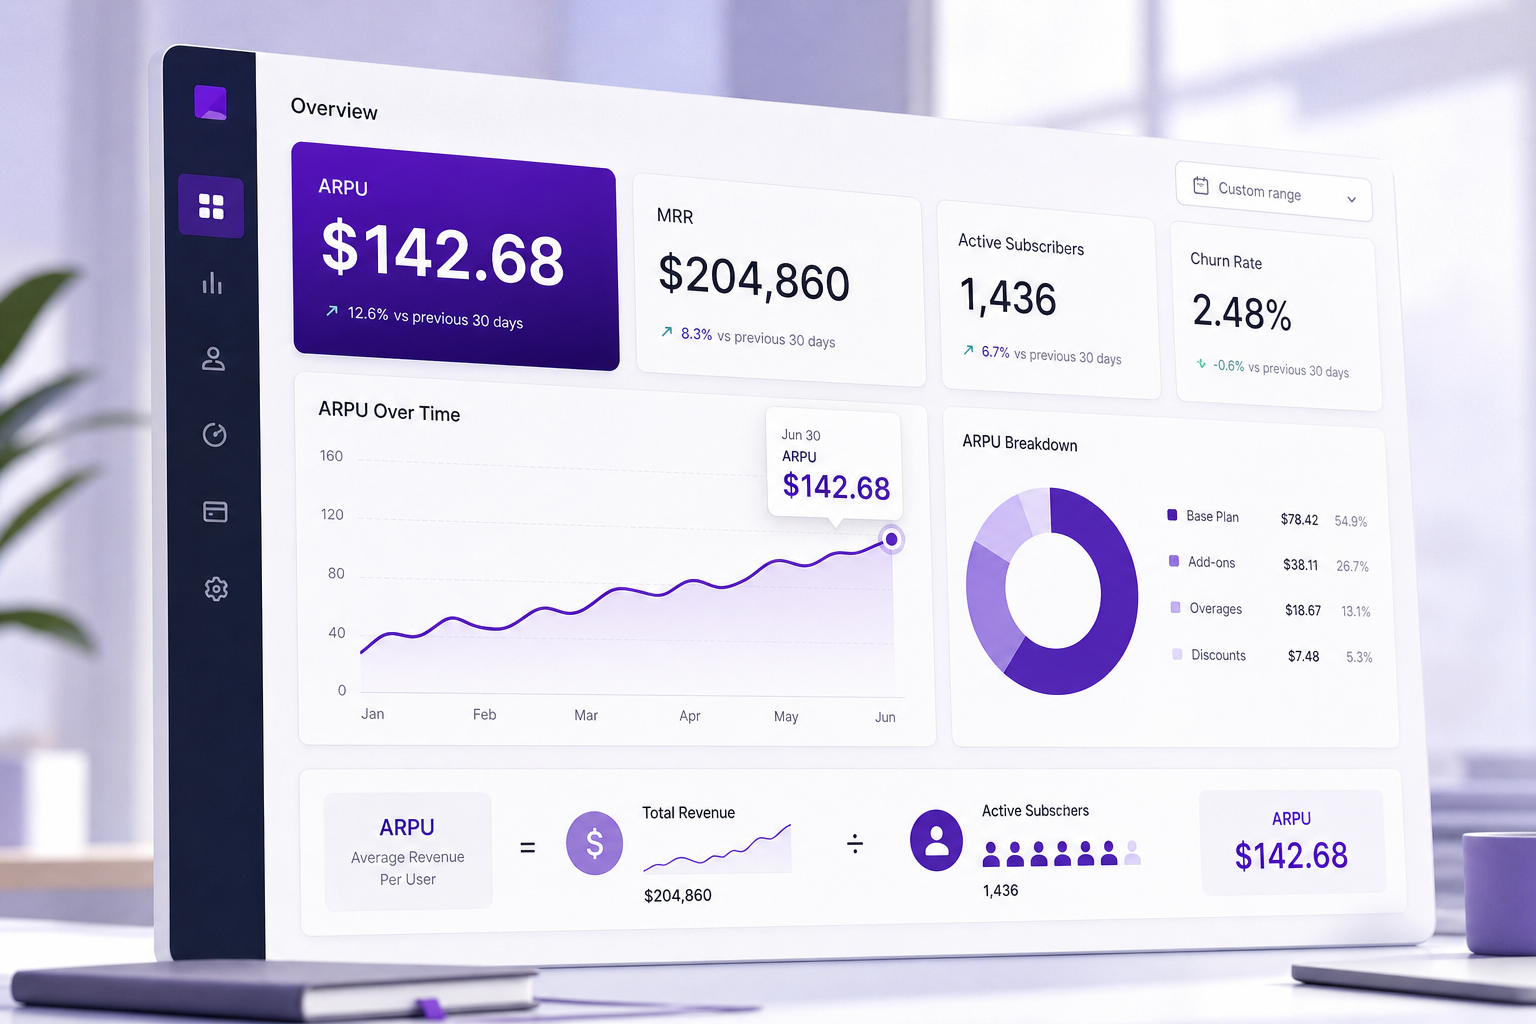
Let’s walk through a concrete scenario. Imagine a productivity app that reports monthly recurring revenue for March and has a known number of active paying customers. The calculation is straightforward:
ARPU = monthly recurring revenue ÷ number of active paying customers. Multiply by 12 if you want an annual view.
This figure tells you the average revenue each account contributes. If you notice a sudden dip, you know either MRR fell or the customer count rose without a matching price increase.
When you compare this number across months, you’ll see whether growth is coming from more users or from higher‑value deals.
Step 4: Interpret ARPU Changes Alongside Churn and Retention
ARPU alone can be misleading. A rising ARPU while churn spikes means you’re extracting more money per user but losing them faster. Conversely, a flat ARPU with falling churn signals stable pricing and improving retention.
Segment the metric to get a clearer picture. Look at ARPU by pricing tier, by acquisition cohort, and by usage intensity. A blended ARPU can hide meaningful differences between segments, leading to pricing mis-alignment. By drilling into tiers, you might discover that enterprise customers are under‑monetized relative to their usage.
Also watch ARPU against expansion ARR. If expansion revenue lifts ARPU faster than new‑logo MRR, you’re successfully upselling existing customers.
Key Takeaway: Pair ARPU with churn and cohort analysis; the combination tells you whether pricing or retention is the growth driver.
Step 5: Track ARPU Consistently and Turn the Result Into Action
Set up a recurring dashboard that pulls MRR and active customer counts automatically. Chartsy can connect to Stripe or Paddle, import the raw data, and let you ask plain‑English questions like “What is my ARPU this month?” without writing SQL.
Schedule a monthly review: compare the current ARPU to the previous month, note any deviation, and ask why. If ARPU fell, dig into the plans that lost users or the new discounts you introduced. If it rose, identify which segments grew and consider expanding those offers.
Turn insights into experiments. For example, test a higher‑price tier for power users, or add a value‑add feature to the mid‑tier and measure the ARPU impact over the next quarter.
Pro Tip: Document the exact definition you use (per seat vs. per account) and share it with finance, product, and sales. Consistency prevents mis‑aligned forecasts.

FAQ: ARPU Formula Questions
What is the exact ARPU formula?
The ARPU formula is total monthly recurring revenue divided by the number of active paying customers for the same month.
Do I include free trial users in the ARPU calculation?
No. Free‑trial users do not generate revenue, so they should be excluded to avoid skewing the average.
How often should I recalculate ARPU?
Most SaaS teams recalculate ARPU monthly, aligning the metric with their MRR reporting cadence.
Can I use ARPU for a business that sells seats per account?
Yes, but you may prefer ARPA (average revenue per account) if you want to see revenue per whole account rather than per individual seat.
What does a falling ARPU indicate?
A falling ARPU can signal discounting, a shift to lower‑priced plans, or the acquisition of lower‑value customers.
How does churn affect ARPU?
High‑value customers leaving will drop ARPU more sharply than low‑value churn, so track churn by revenue tier as well as by count.
Conclusion
Pick a consistent ARPU definition, pull clean MRR and customer data each month, and use the number to spot pricing or retention issues. For a ready‑made dashboard that answers “What is my ARPU?” in plain English, check out Chartsy’s analytics platform.
SaaS Pricing Calculator: How to Price Your Product | Chartsy Blog

Written by
Chartsy TeamThe Chartsy Team writes guides, product updates, and resources to help SaaS and eCommerce founders make sense of their metrics, without SQL or spreadsheets.
Chartsy